| Param | Original file | Final file |
|---|---|---|
| Filename | modeM0/AS1A13_090T01_9000006464_51761cztM0_level2.fits | modeM0/AS1A13_090T01_9000006464_51761cztM0_level2_quad_clean.evt |
| Size (bytes) | 869,112,000 | 101,917,440 |
| Size | 828.8 MB | 97.2 MB |
| Events in quadrant A | 5,709,432 | 744,790 |
| Events in quadrant B | 6,475,480 | 770,836 |
| Events in quadrant C | 4,734,655 | 699,905 |
| Events in quadrant D | 14,628,287 | 310,694 |
| Mode SS | |||
|---|---|---|---|
| Quadrant | BADHDUFLAG | Total packets | Discarded packets |
| A | 0 | 160 | 0 |
| B | 0 | 160 | 0 |
| C | 0 | 160 | 0 |
| D | 0 | 160 | 0 |
| Mode M0 | |||
|---|---|---|---|
| Quadrant | BADHDUFLAG | Total packets | Discarded packets |
| A | 0 | 22508 | 0 |
| B | 0 | 24813 | 0 |
| C | 0 | 19906 | 0 |
| D | 0 | 49054 | 0 |
| Quadrant | Total seconds | Saturated seconds | Saturation percentage |
|---|---|---|---|
| A | 8049 | 140 | 1.739347% |
| B | 8049 | 664 | 8.249472% |
| C | 8050 | 396 | 4.919255% |
| D | 8050 | 4724 | 58.683230% |
Noise dominated data is calculated using 1-second bins in cleaned event files. If a bin has >2000 counts, and if more than 50% of those come from <1% of pixels, then it is considered to be noise-dominated and hence unusable.
| Quadrant | # 1 sec bins | Bins with >0 counts | Bins with >2000 counts | High rate bins dominated by noise | Noise dominated (total time) | Noise dominated (detector-on time) | Marked lightcurve |
|---|---|---|---|---|---|---|---|
| A | 8049 | 8049 | 51 | 51 | 0.63% | 0.63% | 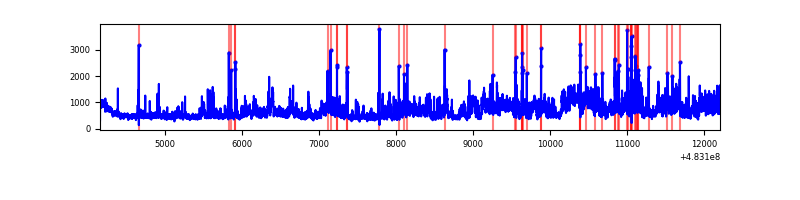 |
| B | 8049 | 8049 | 414 | 414 | 5.14% | 5.14% | 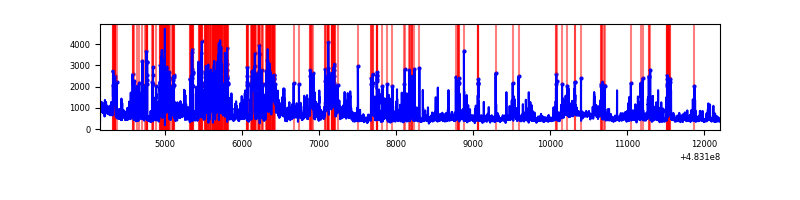 |
| C | 8050 | 8050 | 333 | 333 | 4.14% | 4.14% | 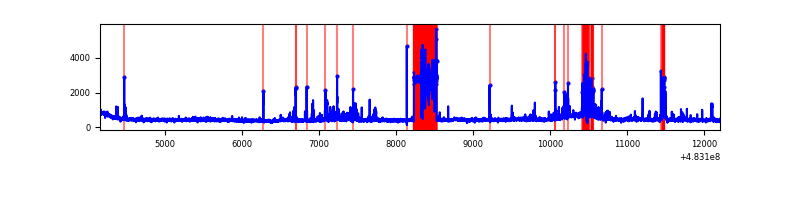 |
| D | 8050 | 8050 | 3616 | 3616 | 44.92% | 44.92% | 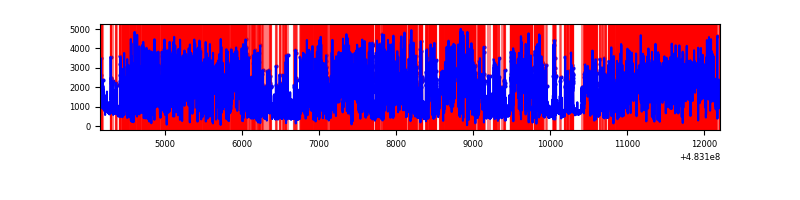 |
Top three noisy pixels from each quadrant. If the there are fewer than three noisy pixels in the level2.evt file, extra rows are filled as -1
| Pixel properties | Quadrant properties | ||||||
|---|---|---|---|---|---|---|---|
| Quadrant | DetID | PixID | Counts | Sigma | Mean | Median | Sigma |
| A | 12 | 3 | 1286468 | 5947.02 | 885 | 864 | 216.2 |
| A | 5 | 240 | 157346 | 723.86 | 885 | 864 | 216.2 |
| A | 12 | 194 | 155574 | 715.67 | 885 | 864 | 216.2 |
| B | 4 | 206 | 1854789 | 9853.83 | 862 | 830 | 188.1 |
| B | 10 | 44 | 294775 | 1562.32 | 862 | 830 | 188.1 |
| B | 0 | 213 | 192436 | 1018.39 | 862 | 830 | 188.1 |
| C | 13 | 3 | 844412 | 3690.73 | 840 | 834 | 228.6 |
| C | 14 | 245 | 185711 | 808.85 | 840 | 834 | 228.6 |
| C | 3 | 233 | 77147 | 333.88 | 840 | 834 | 228.6 |
| D | 11 | 129 | 11032800 | 70197.9 | 558 | 539 | 157.2 |
| D | 8 | 176 | 414880 | 2636.44 | 558 | 539 | 157.2 |
| D | 7 | 159 | 285637 | 1814.07 | 558 | 539 | 157.2 |
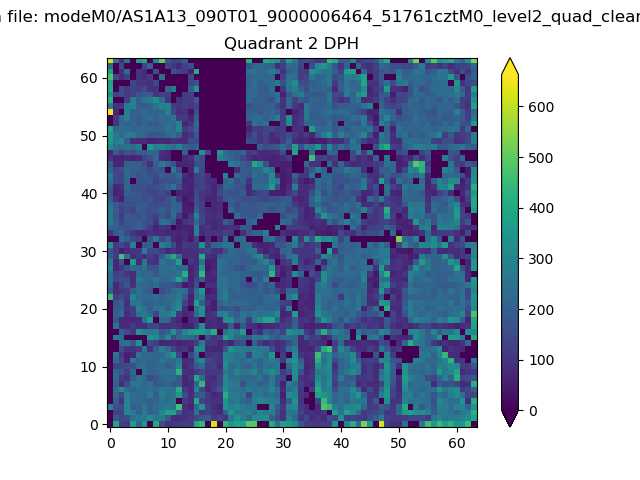
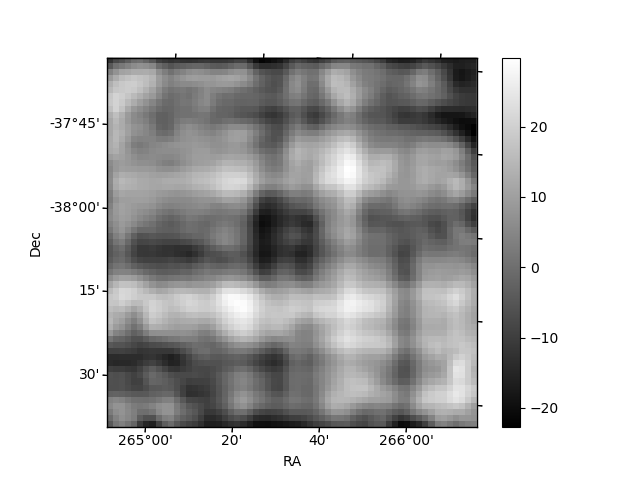
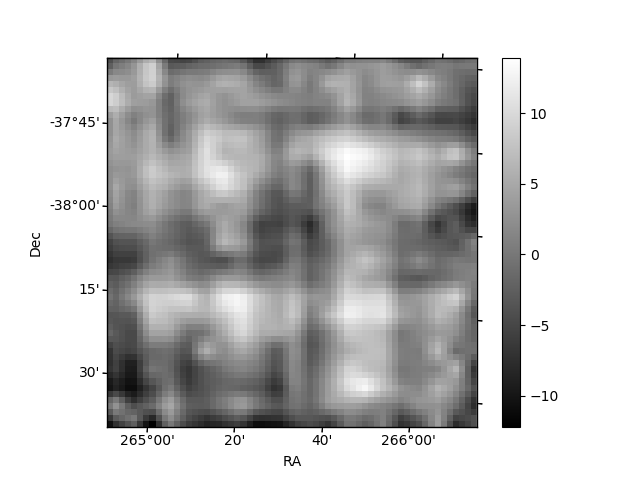
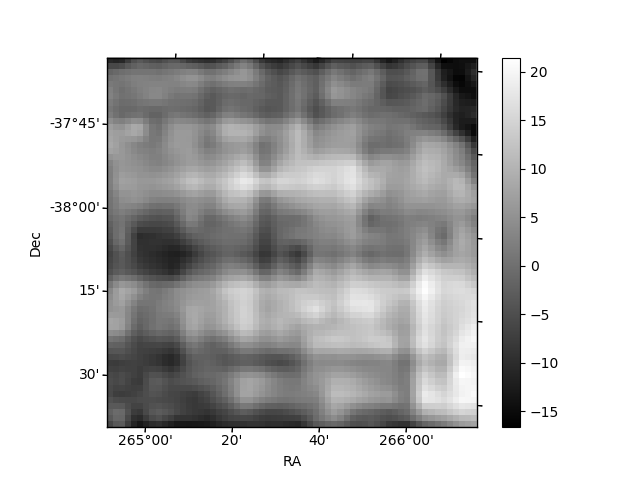
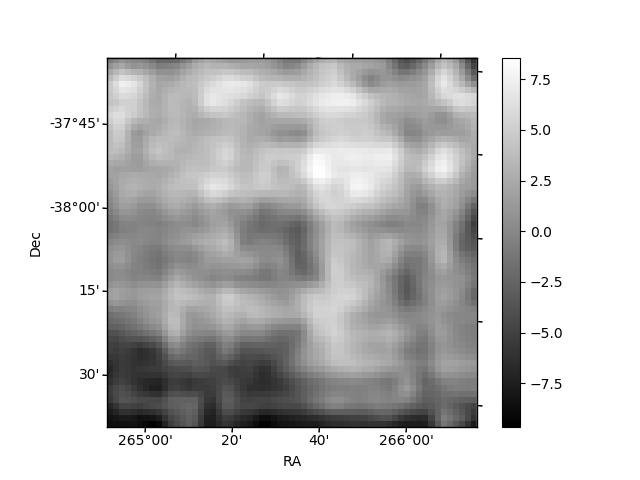
Histogram calculated using DETX and DETY for each event in the final _common_clean file
| Quadrant A | 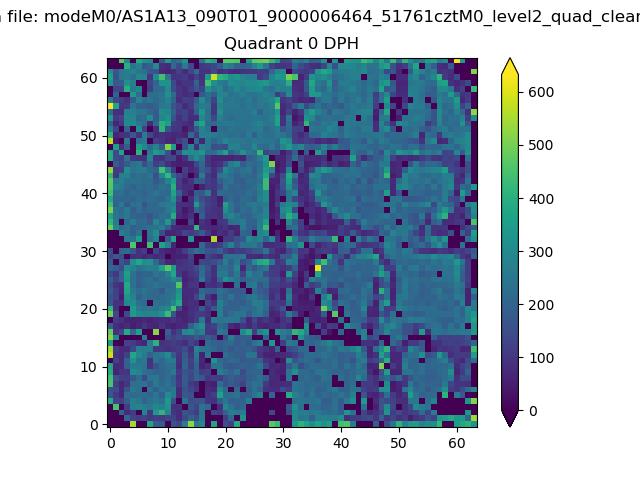 |
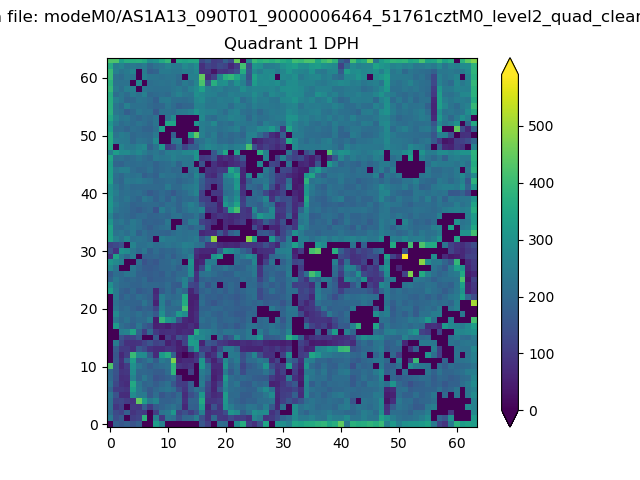 |
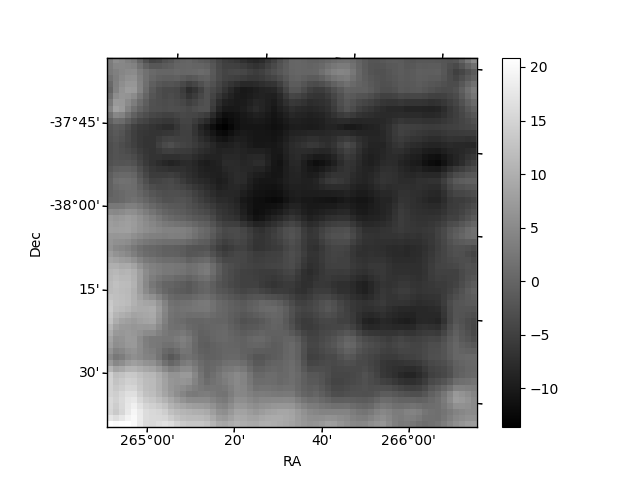
Quadrant B |
|---|---|---|---|
| Quadrant D | 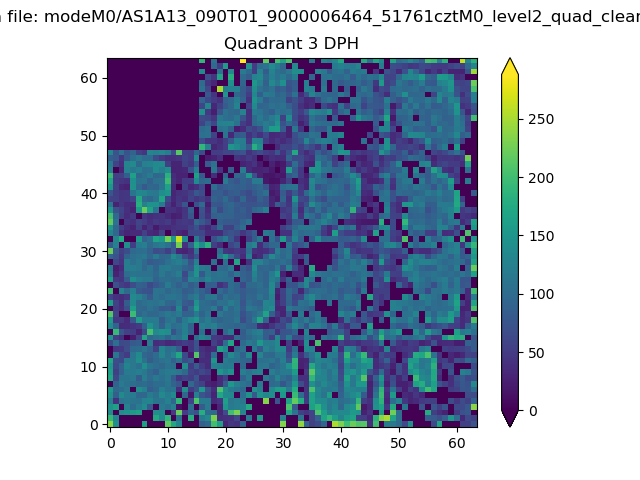 |
 |
Quadrant C |
| Plot type | Count rate plots | Images |
|---|---|---|
| Comparison with Poisson distribution Blue bars denote a histogram of data divided into 1 sec bins. Red curve is a Poisson curve with rate = median count rate of data. |
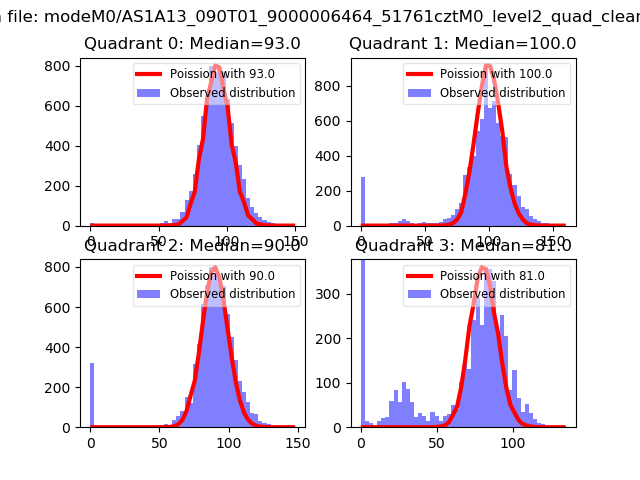 |
 |
| Quadrant-wise count rates Data is divided into 100 sec bins |
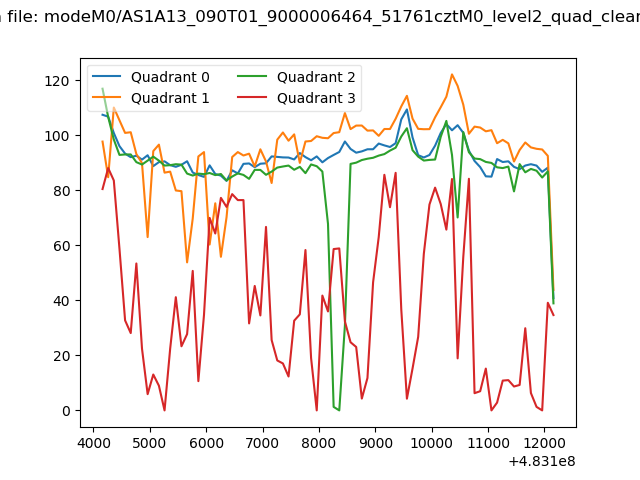 |
|
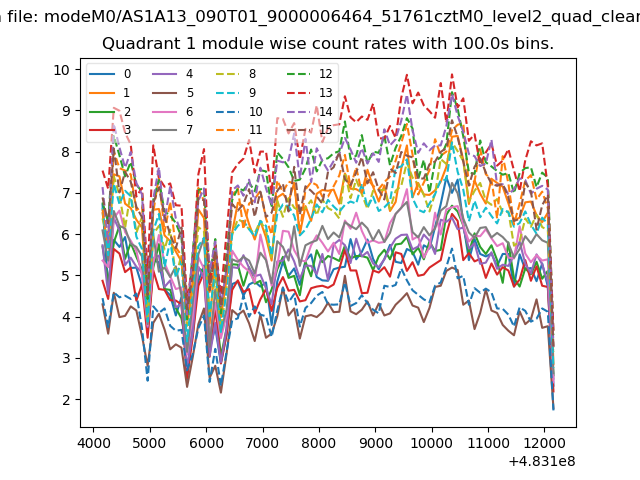
| Module-wise count rates for Quadrant A Data is divided into 100 sec bins |
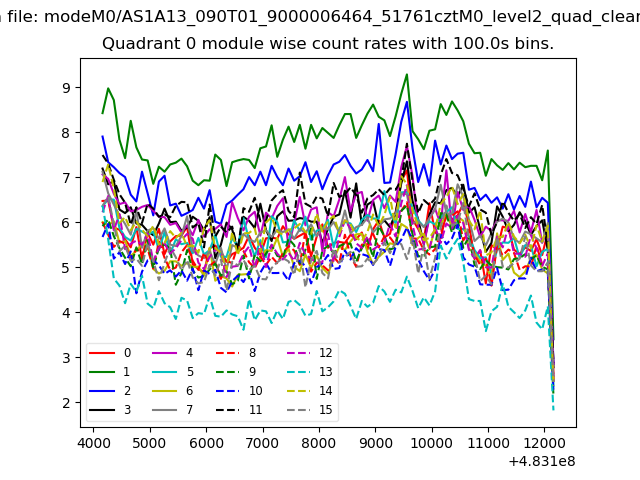 |
 |
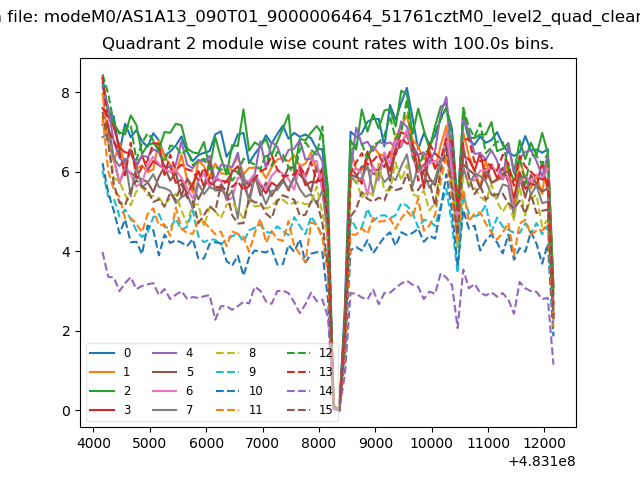
| Module-wise count rates for Quadrant B Data is divided into 100 sec bins |
 |
 |
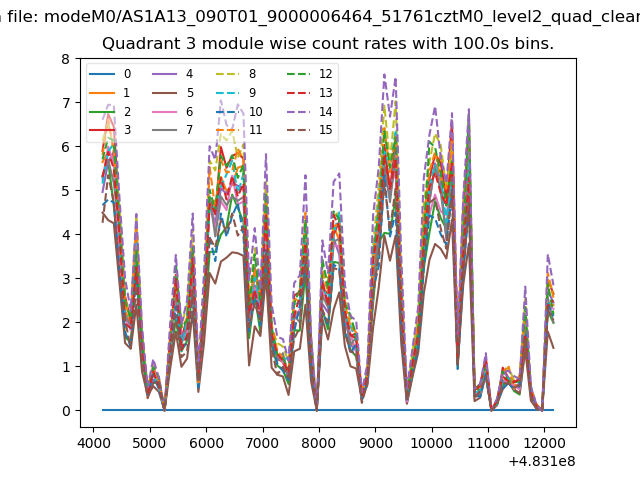
| Module-wise count rates for Quadrant C Data is divided into 100 sec bins |
 |
 |
| Module-wise count rates for Quadrant D Data is divided into 100 sec bins |
 |
 |
| Parameter | Plot |
|---|---|
| CZT HV Monitor | 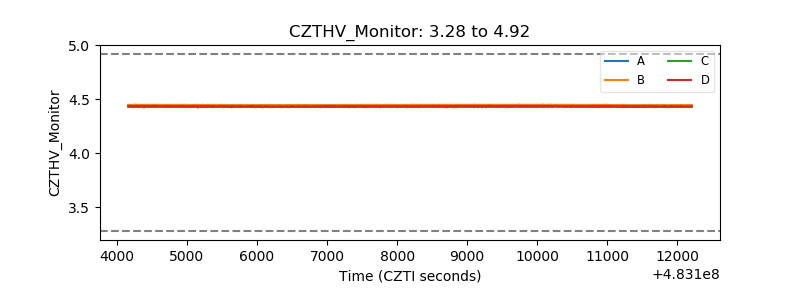 |
| D_VDD | 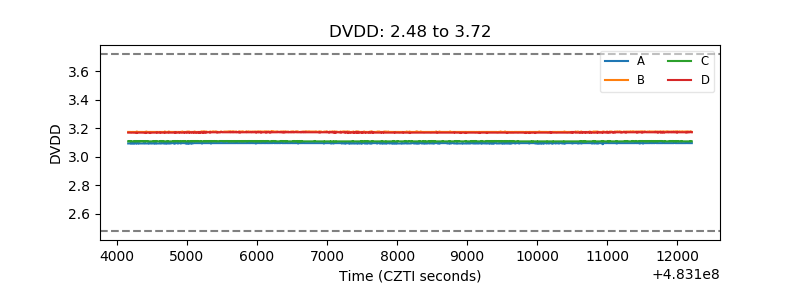 |
| Temperature 1 | 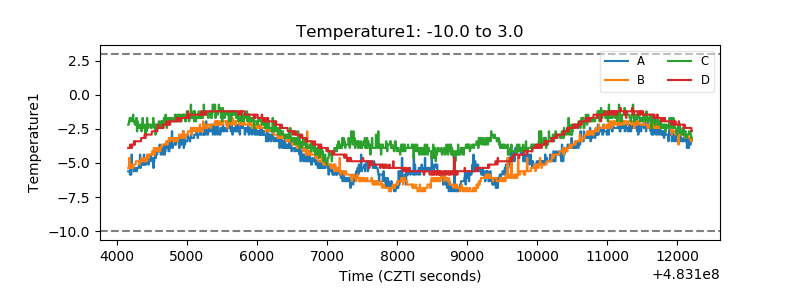 |
| Veto HV Monitor | 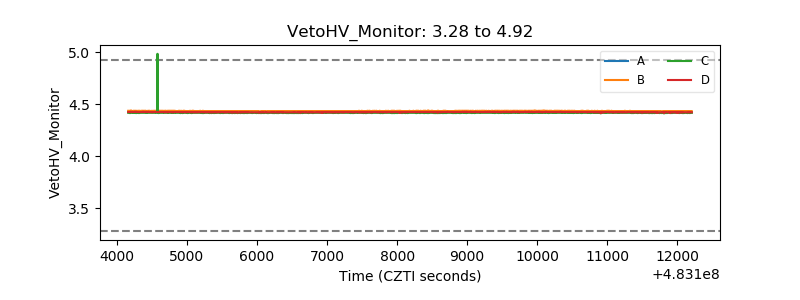 |
| Veto LLD | 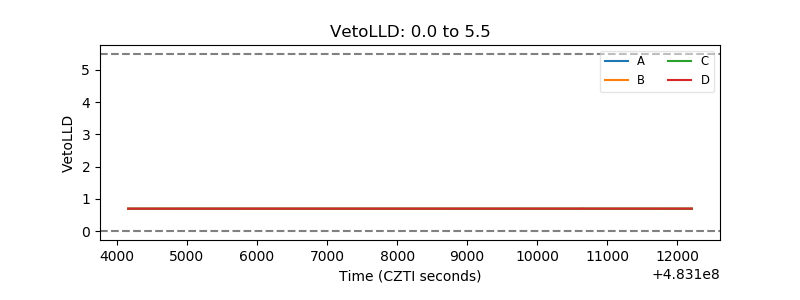 |
| Alpha Counter | 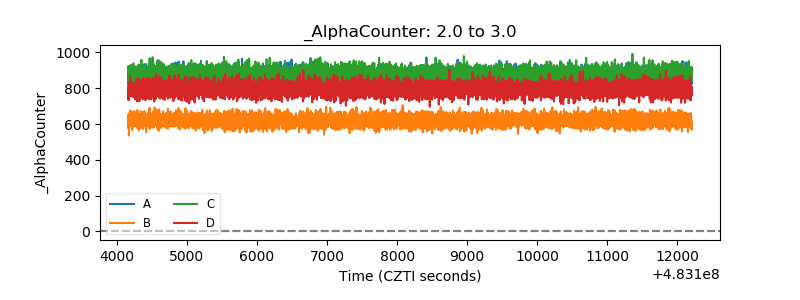 |
| _CPM_Rate | 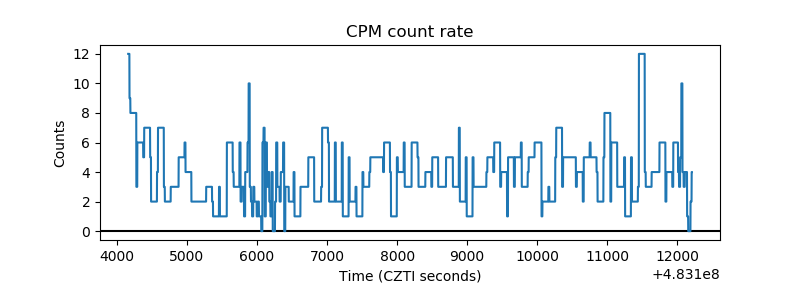 |
| CZT Counter | 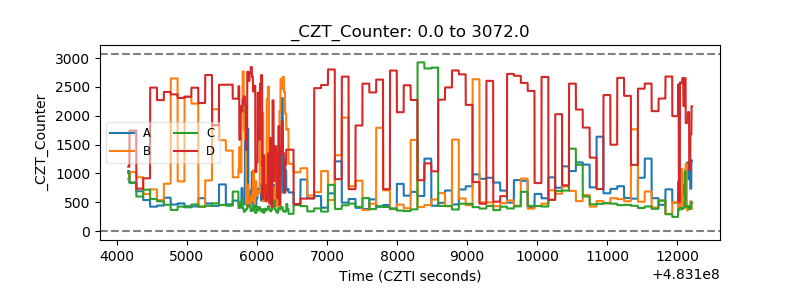 |
| +2.5 Volts monitor | 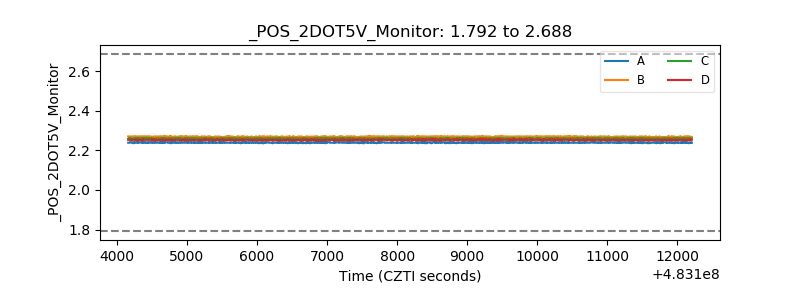 |
| +5 Volts monitor | 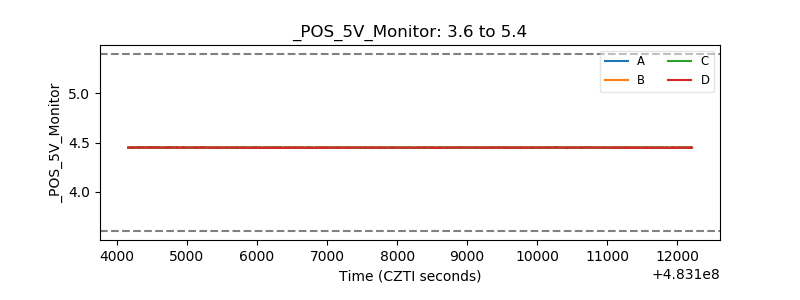 |
| _ROLL_ROT | 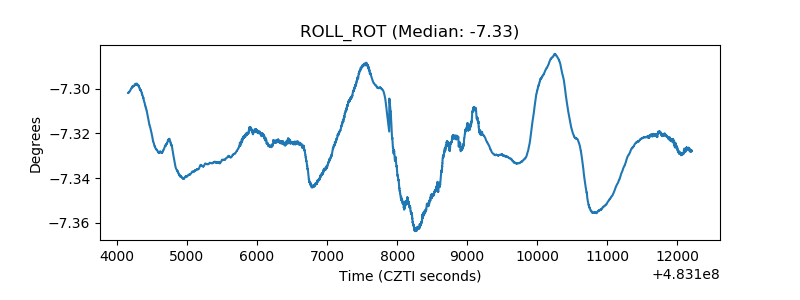 |
| _Roll_DEC | 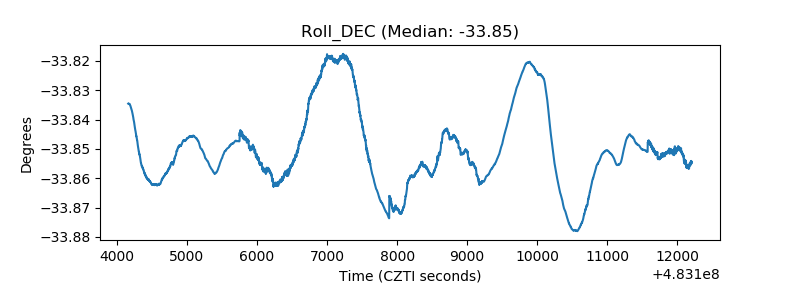 |
| _Roll_RA | 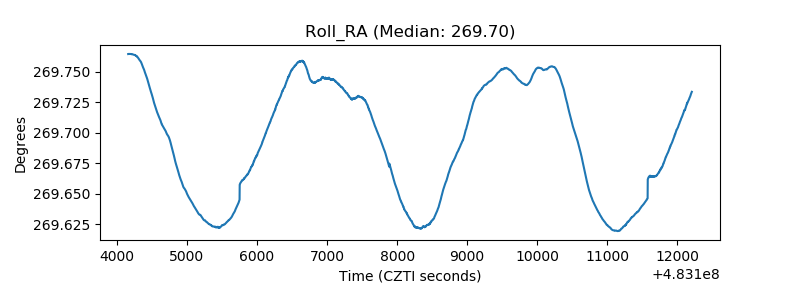 |
| Veto Counter | 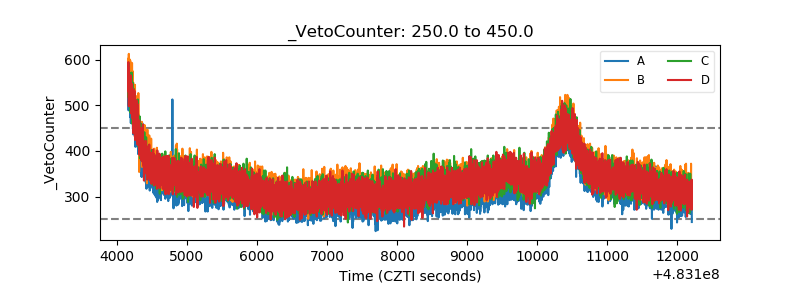 |