| Param | Original file | Final file |
|---|---|---|
| Filename | modeM0/AS1A13_090T01_9000006464_51765cztM0_level2.fits | modeM0/AS1A13_090T01_9000006464_51765cztM0_level2_quad_clean.evt |
| Size (bytes) | 2,152,661,760 | 244,788,480 |
| Size | 2.0 GB | 233.4 MB |
| Events in quadrant A | 13,236,249 | 1,765,874 |
| Events in quadrant B | 16,393,133 | 1,834,021 |
| Events in quadrant C | 16,732,873 | 1,512,574 |
| Events in quadrant D | 31,792,742 | 931,756 |
| Mode M9 | |||
|---|---|---|---|
| Quadrant | BADHDUFLAG | Total packets | Discarded packets |
| A | 0 | 11 | 0 |
| B | 0 | 11 | 0 |
| C | 0 | 11 | 0 |
| D | 0 | 11 | 0 |
| Mode SS | |||
|---|---|---|---|
| Quadrant | BADHDUFLAG | Total packets | Discarded packets |
| A | 0 | 400 | 0 |
| B | 0 | 400 | 0 |
| C | 0 | 400 | 0 |
| D | 0 | 400 | 0 |
| Mode M0 | |||
|---|---|---|---|
| Quadrant | BADHDUFLAG | Total packets | Discarded packets |
| A | 0 | 53158 | 4 |
| B | 0 | 62374 | 4 |
| C | 0 | 63549 | 4 |
| D | 0 | 108189 | 4 |
| Quadrant | Total seconds | Saturated seconds | Saturation percentage |
|---|---|---|---|
| A | 19832 | 754 | 3.801936% |
| B | 19832 | 2064 | 10.407422% |
| C | 19832 | 2525 | 12.731948% |
| D | 19833 | 8618 | 43.452831% |
Noise dominated data is calculated using 1-second bins in cleaned event files. If a bin has >2000 counts, and if more than 50% of those come from <1% of pixels, then it is considered to be noise-dominated and hence unusable.
| Quadrant | # 1 sec bins | Bins with >0 counts | Bins with >2000 counts | High rate bins dominated by noise | Noise dominated (total time) | Noise dominated (detector-on time) | Marked lightcurve |
|---|---|---|---|---|---|---|---|
| A | 20958 | 19842 | 298 | 298 | 1.42% | 1.50% | 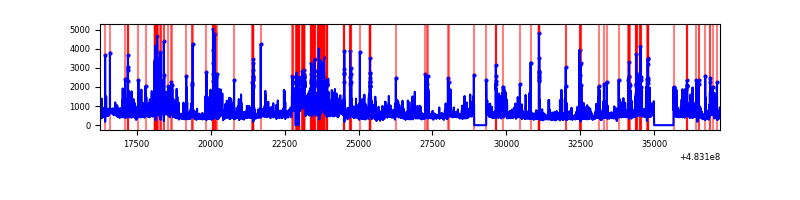 |
| B | 20958 | 19842 | 1200 | 1200 | 5.73% | 6.05% | 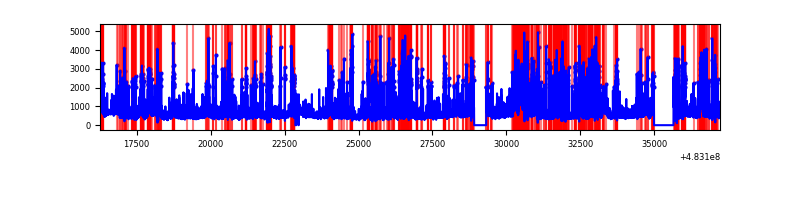 |
| C | 20957 | 19841 | 1807 | 1807 | 8.62% | 9.11% |  |
| D | 20959 | 19839 | 7001 | 7001 | 33.40% | 35.29% | 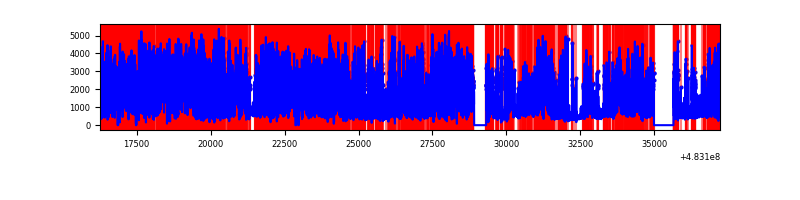 |
Top three noisy pixels from each quadrant. If the there are fewer than three noisy pixels in the level2.evt file, extra rows are filled as -1
| Pixel properties | Quadrant properties | ||||||
|---|---|---|---|---|---|---|---|
| Quadrant | DetID | PixID | Counts | Sigma | Mean | Median | Sigma |
| A | 12 | 3 | 1780700 | 3352.21 | 2146 | 2093 | 530.6 |
| A | 8 | 249 | 659849 | 1239.7 | 2146 | 2093 | 530.6 |
| A | 11 | 3 | 398015 | 746.21 | 2146 | 2093 | 530.6 |
| B | 4 | 206 | 5867426 | 13174.95 | 2077 | 2005 | 445.2 |
| B | 8 | 128 | 550921 | 1232.98 | 2077 | 2005 | 445.2 |
| B | 7 | 252 | 338151 | 755.05 | 2077 | 2005 | 445.2 |
| C | 15 | 218 | 5270160 | 9728.36 | 1991 | 1974 | 541.5 |
| C | 15 | 230 | 581953 | 1071.0 | 1991 | 1974 | 541.5 |
| C | 0 | 209 | 430498 | 791.32 | 1991 | 1974 | 541.5 |
| D | 11 | 129 | 21253938 | 47327.83 | 1589 | 1529 | 449.0 |
| D | 8 | 176 | 1140708 | 2536.88 | 1589 | 1529 | 449.0 |
| D | 7 | 60 | 710762 | 1579.42 | 1589 | 1529 | 449.0 |
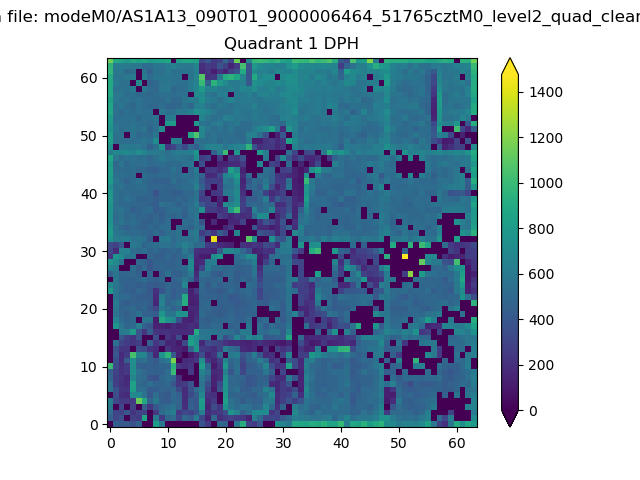
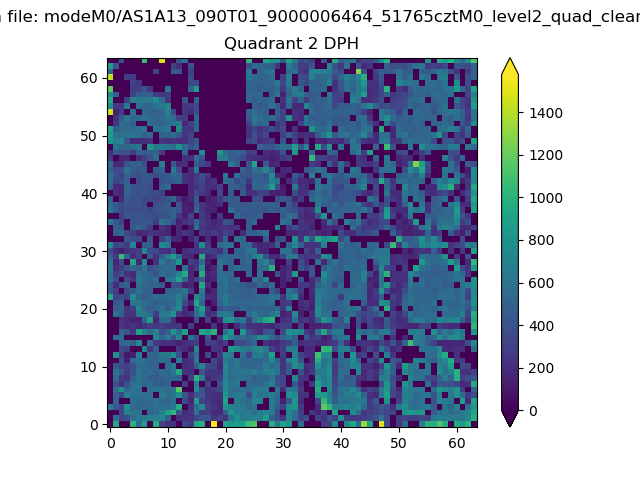
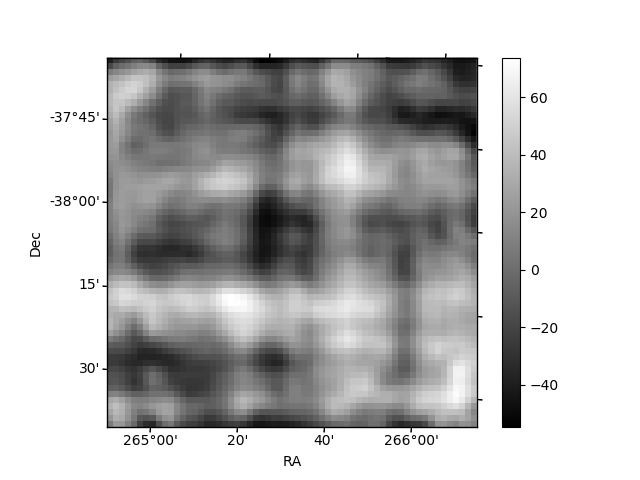
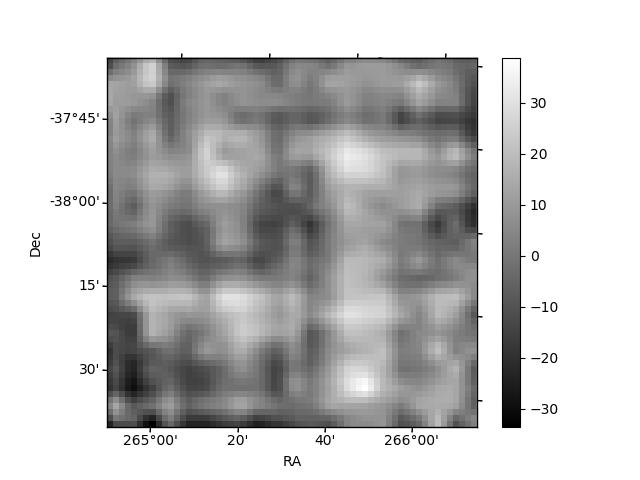
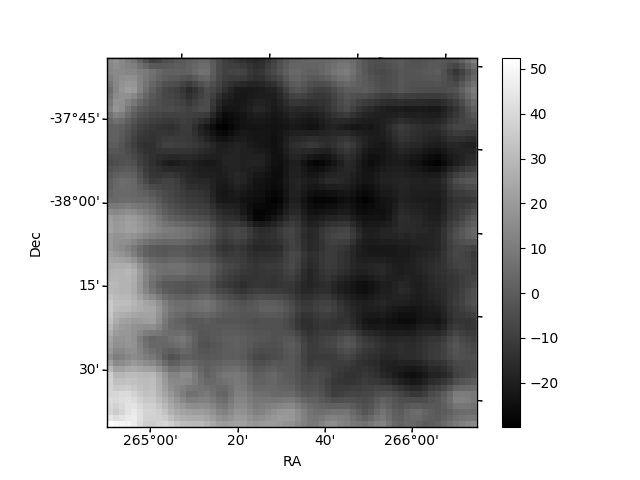
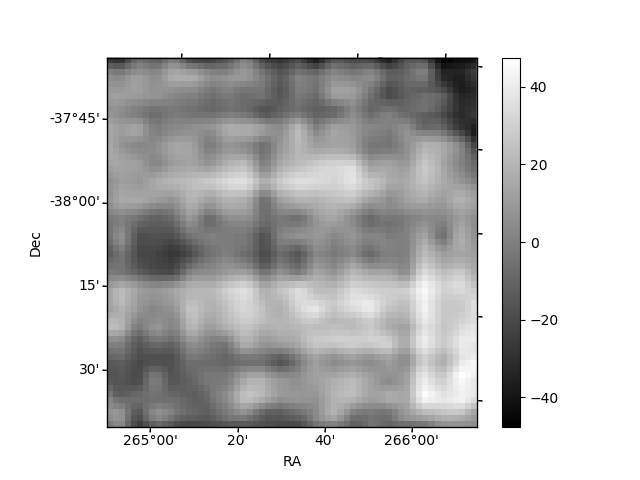
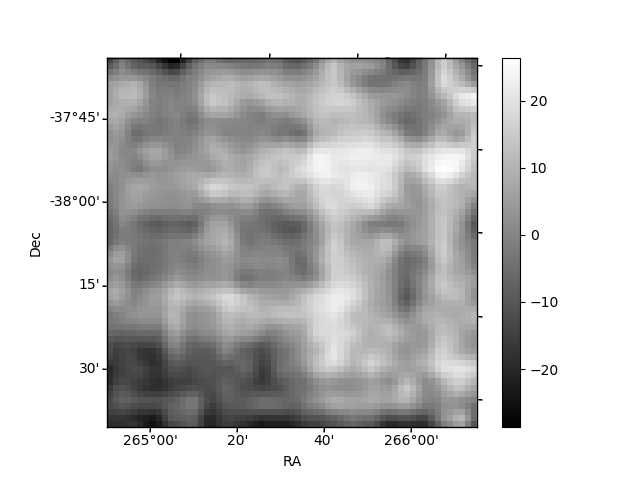
Histogram calculated using DETX and DETY for each event in the final _common_clean file
| Quadrant A | 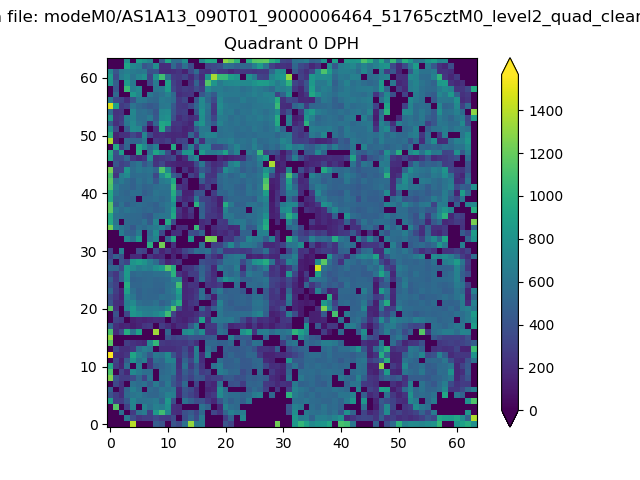 |
 |
Quadrant B |
|---|---|---|---|
| Quadrant D | 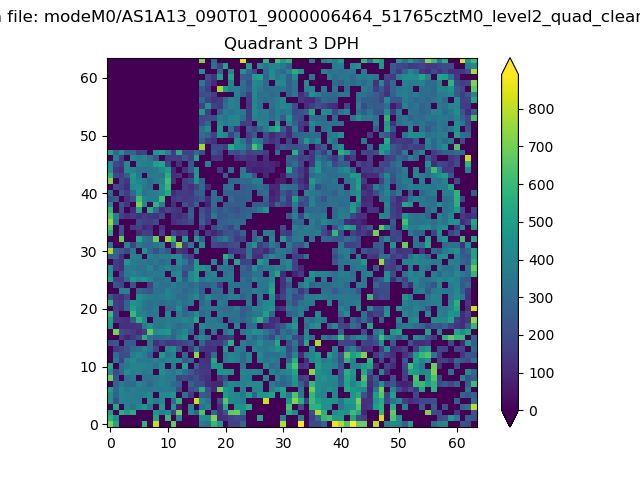 |
 |
Quadrant C |
| Plot type | Count rate plots | Images |
|---|---|---|
| Comparison with Poisson distribution Blue bars denote a histogram of data divided into 1 sec bins. Red curve is a Poisson curve with rate = median count rate of data. |
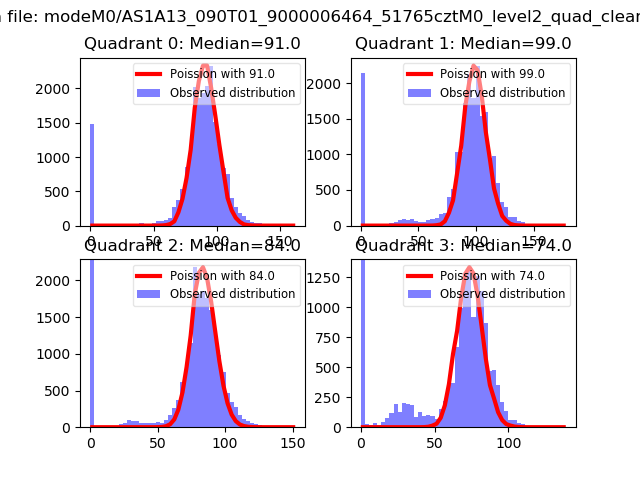 |
 |
| Quadrant-wise count rates Data is divided into 100 sec bins |
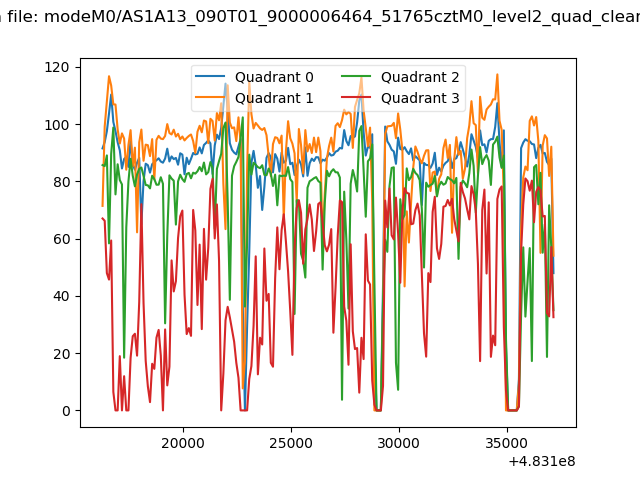 |
|
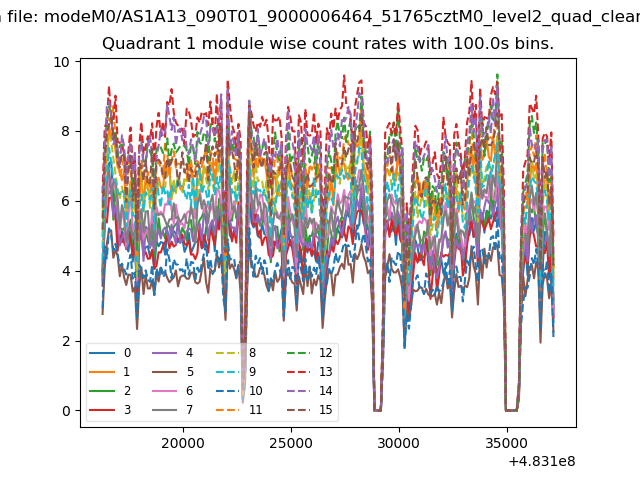
| Module-wise count rates for Quadrant A Data is divided into 100 sec bins |
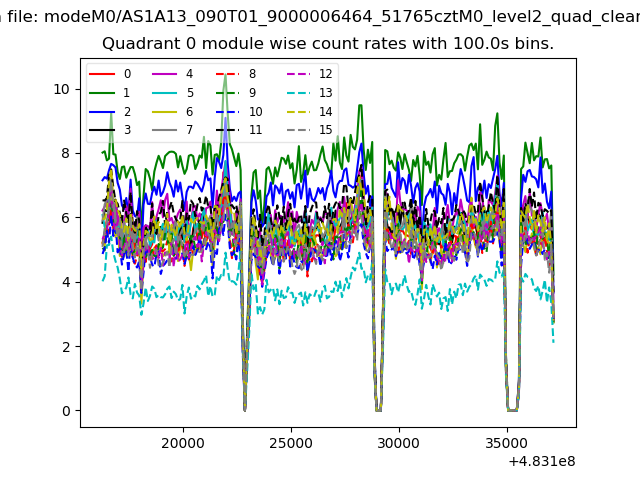 |
 |
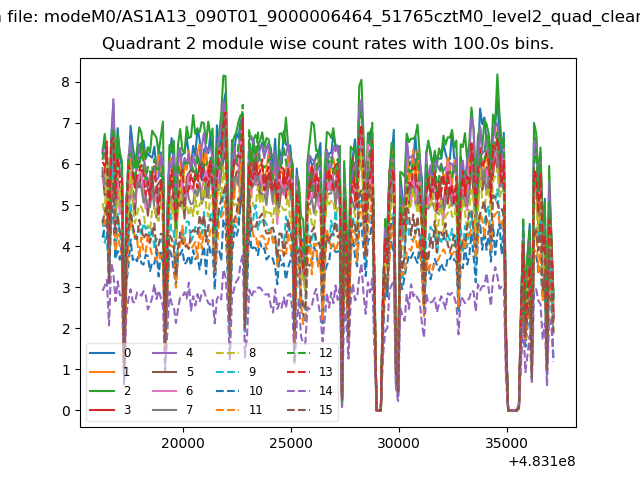
| Module-wise count rates for Quadrant B Data is divided into 100 sec bins |
 |
 |
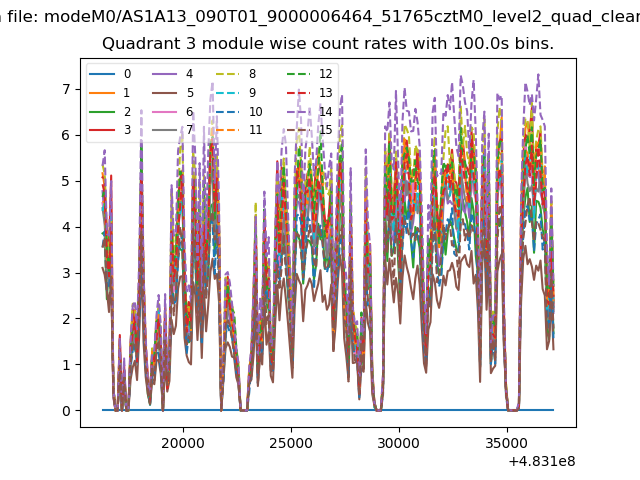
| Module-wise count rates for Quadrant C Data is divided into 100 sec bins |
 |
 |
| Module-wise count rates for Quadrant D Data is divided into 100 sec bins |
 |
 |
| Parameter | Plot |
|---|---|
| CZT HV Monitor | 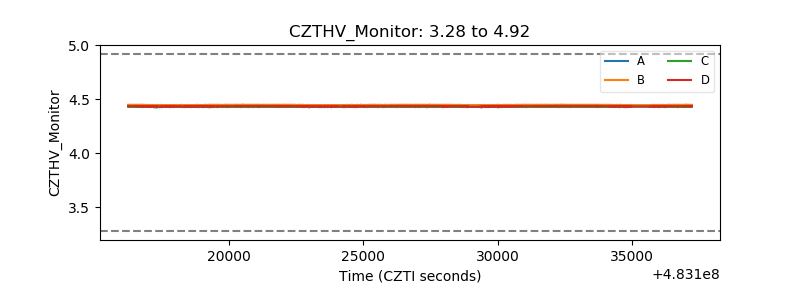 |
| D_VDD | 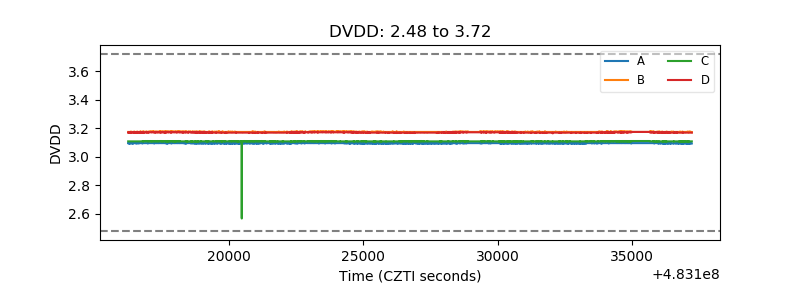 |
| Temperature 1 | 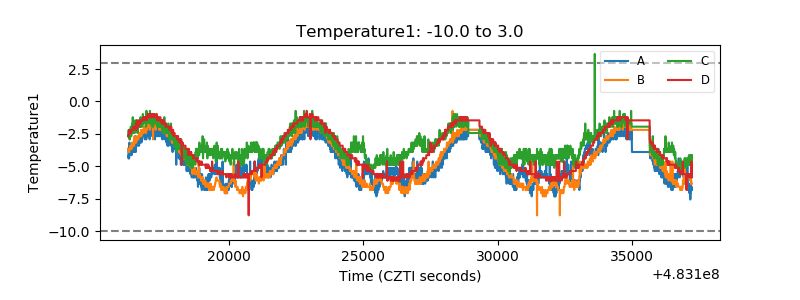 |
| Veto HV Monitor | 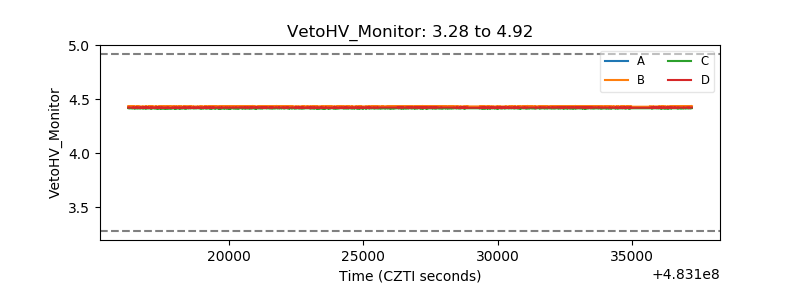 |
| Veto LLD | 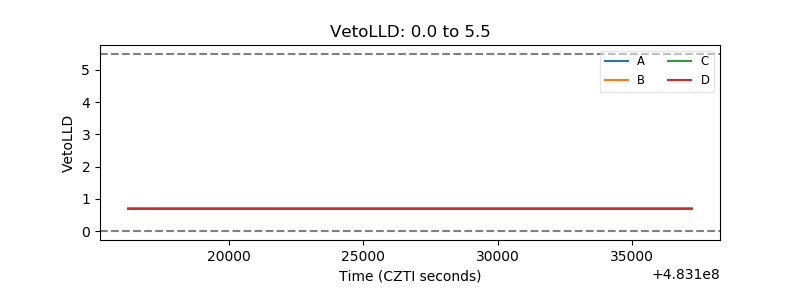 |
| Alpha Counter | 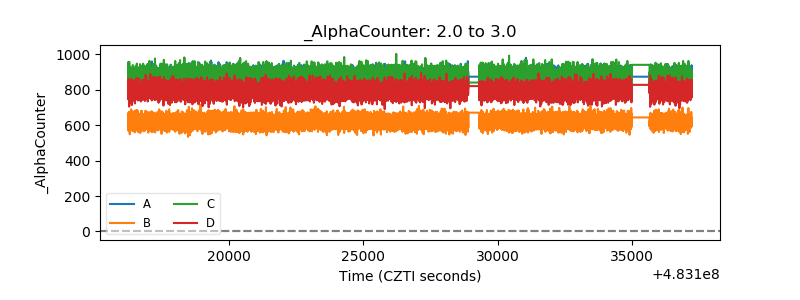 |
| _CPM_Rate | 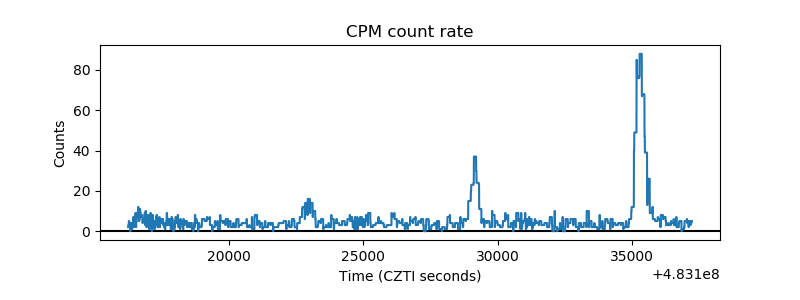 |
| CZT Counter | 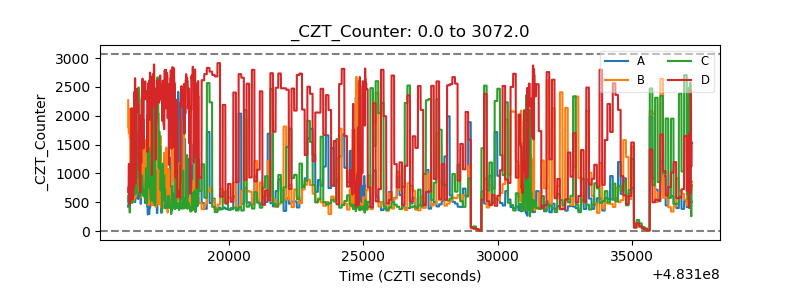 |
| +2.5 Volts monitor | 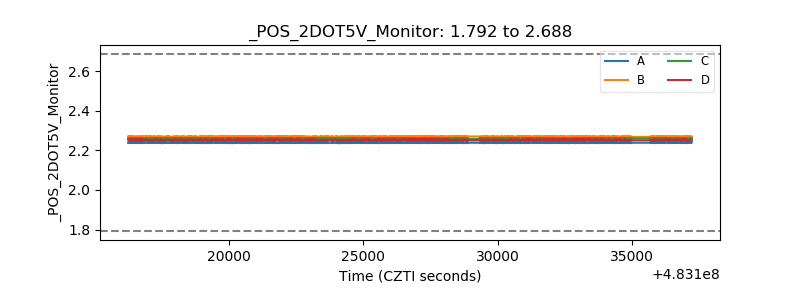 |
| +5 Volts monitor | 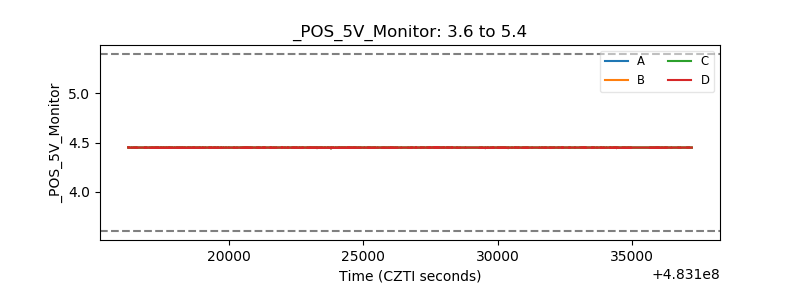 |
| _ROLL_ROT | 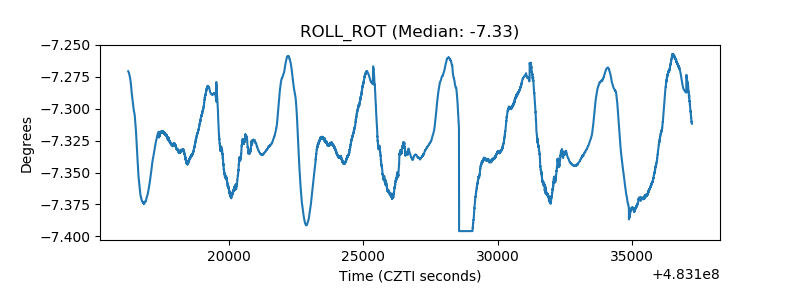 |
| _Roll_DEC | 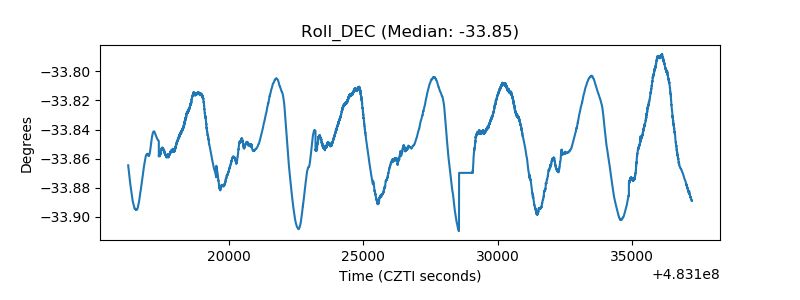 |
| _Roll_RA | 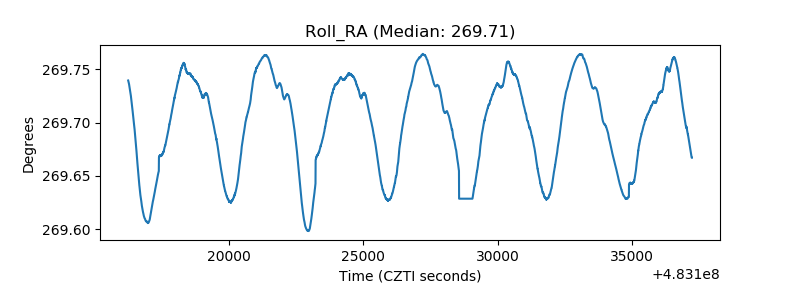 |
| Veto Counter | 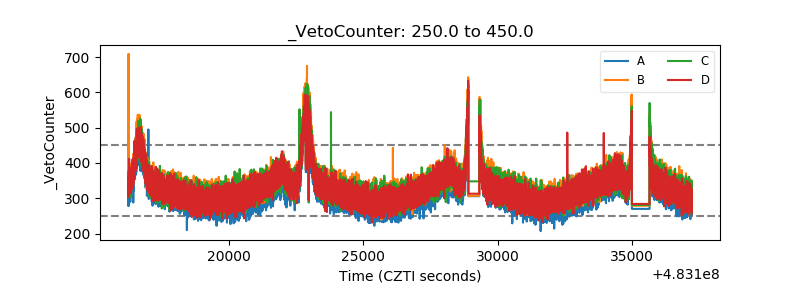 |