| Param | Original file | Final file |
|---|---|---|
| Filename | modeM0/AS1A13_090T01_9000006464_51766cztM0_level2.fits | modeM0/AS1A13_090T01_9000006464_51766cztM0_level2_quad_clean.evt |
| Size (bytes) | 752,696,640 | 83,704,320 |
| Size | 717.8 MB | 79.8 MB |
| Events in quadrant A | 4,812,462 | 592,518 |
| Events in quadrant B | 6,393,702 | 577,640 |
| Events in quadrant C | 8,073,486 | 455,200 |
| Events in quadrant D | 8,070,939 | 448,003 |
| Mode M9 | |||
|---|---|---|---|
| Quadrant | BADHDUFLAG | Total packets | Discarded packets |
| A | 0 | 9 | 0 |
| B | 0 | 9 | 0 |
| C | 0 | 9 | 0 |
| D | 0 | 9 | 0 |
| Mode SS | |||
|---|---|---|---|
| Quadrant | BADHDUFLAG | Total packets | Discarded packets |
| A | 0 | 132 | 0 |
| B | 0 | 132 | 0 |
| C | 0 | 132 | 0 |
| D | 0 | 132 | 0 |
| Mode M0 | |||
|---|---|---|---|
| Quadrant | BADHDUFLAG | Total packets | Discarded packets |
| A | 0 | 18912 | 1 |
| B | 0 | 23667 | 1 |
| C | 0 | 28410 | 1 |
| D | 0 | 28603 | 1 |
| Quadrant | Total seconds | Saturated seconds | Saturation percentage |
|---|---|---|---|
| A | 6612 | 382 | 5.777374% |
| B | 6612 | 1164 | 17.604356% |
| C | 6613 | 1833 | 27.718131% |
| D | 6612 | 1524 | 23.049002% |
Noise dominated data is calculated using 1-second bins in cleaned event files. If a bin has >2000 counts, and if more than 50% of those come from <1% of pixels, then it is considered to be noise-dominated and hence unusable.
| Quadrant | # 1 sec bins | Bins with >0 counts | Bins with >2000 counts | High rate bins dominated by noise | Noise dominated (total time) | Noise dominated (detector-on time) | Marked lightcurve |
|---|---|---|---|---|---|---|---|
| A | 7456 | 6607 | 258 | 258 | 3.46% | 3.90% | 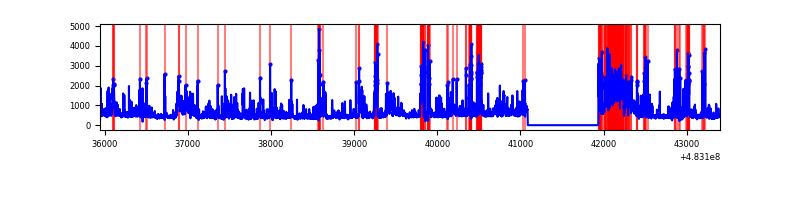 |
| B | 7456 | 6607 | 701 | 701 | 9.40% | 10.61% | 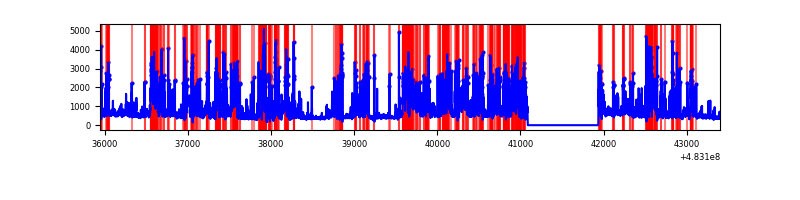 |
| C | 7457 | 6606 | 1430 | 1430 | 19.18% | 21.65% |  |
| D | 7456 | 6607 | 1341 | 1341 | 17.99% | 20.30% | 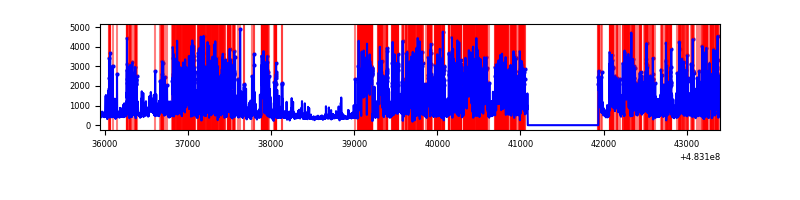 |
Top three noisy pixels from each quadrant. If the there are fewer than three noisy pixels in the level2.evt file, extra rows are filled as -1
| Pixel properties | Quadrant properties | ||||||
|---|---|---|---|---|---|---|---|
| Quadrant | DetID | PixID | Counts | Sigma | Mean | Median | Sigma |
| A | 2 | 143 | 1013358 | 5970.33 | 685 | 669 | 169.6 |
| A | 8 | 249 | 244493 | 1437.47 | 685 | 669 | 169.6 |
| A | 3 | 79 | 100411 | 588.03 | 685 | 669 | 169.6 |
| B | 4 | 206 | 3369390 | 23645.04 | 650 | 625 | 142.5 |
| B | 6 | 51 | 65366 | 454.41 | 650 | 625 | 142.5 |
| B | 4 | 174 | 63381 | 440.47 | 650 | 625 | 142.5 |
| C | 15 | 230 | 3337686 | 20161.1 | 596 | 593 | 165.5 |
| C | 15 | 218 | 1670070 | 10086.17 | 596 | 593 | 165.5 |
| C | 9 | 38 | 219193 | 1320.68 | 596 | 593 | 165.5 |
| D | 11 | 129 | 5027349 | 29587.62 | 602 | 581 | 169.9 |
| D | 8 | 176 | 278348 | 1634.94 | 602 | 581 | 169.9 |
| D | 3 | 12 | 156681 | 918.81 | 602 | 581 | 169.9 |
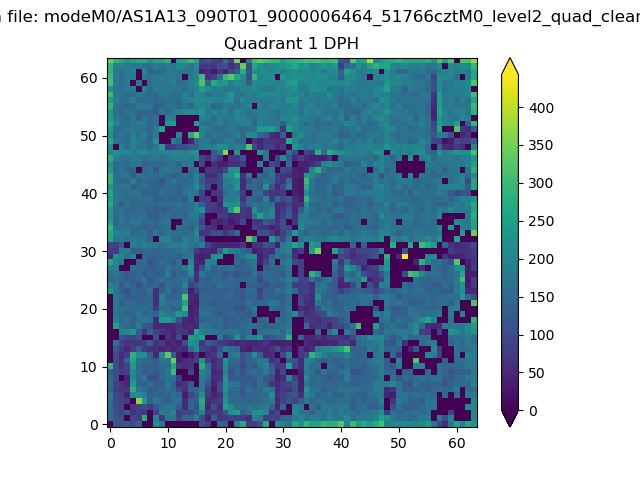
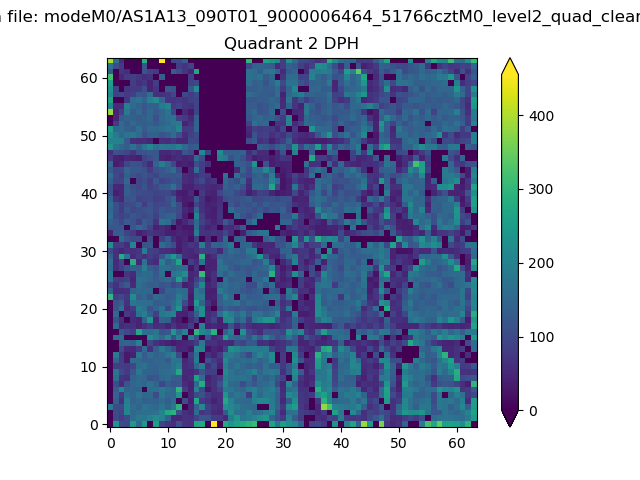
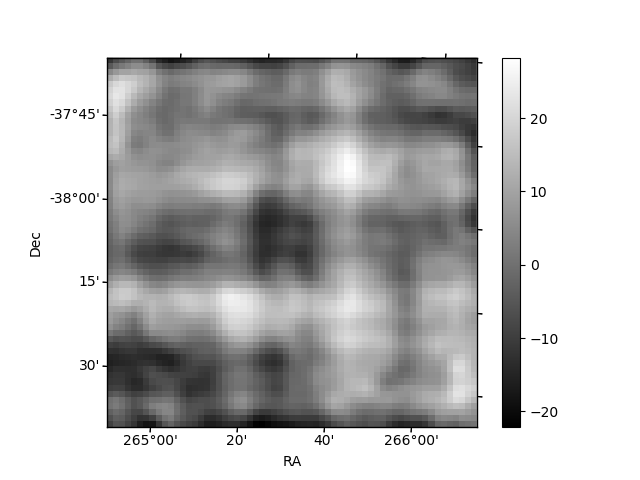
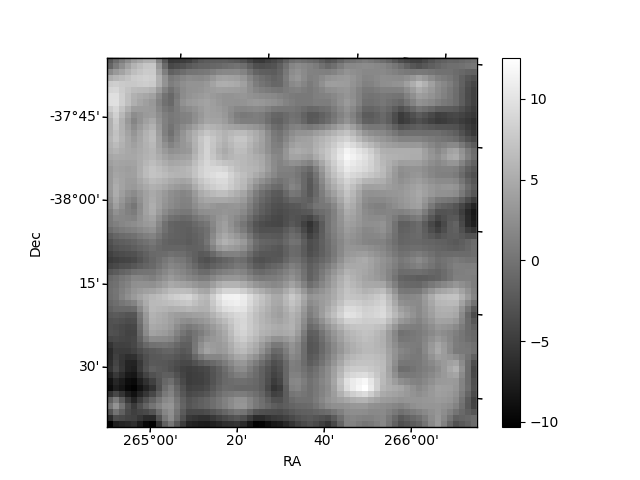
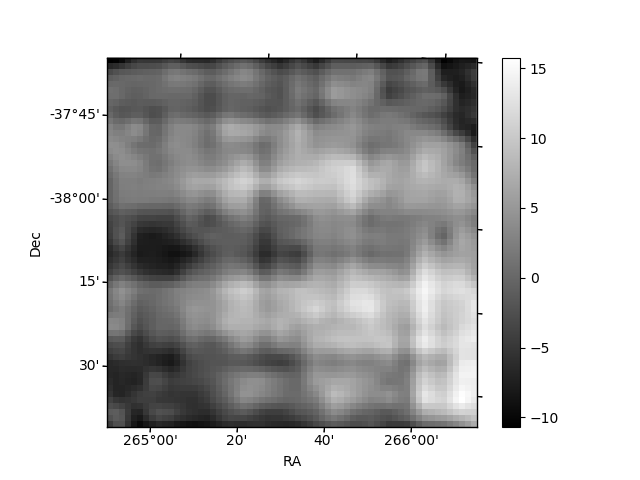
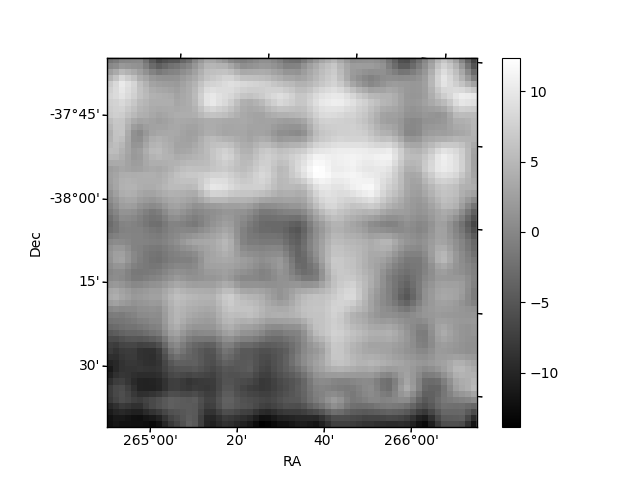
Histogram calculated using DETX and DETY for each event in the final _common_clean file
| Quadrant A | 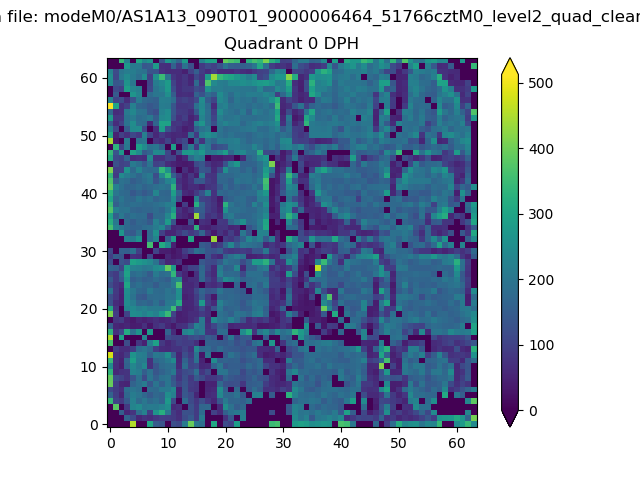 |
 |
Quadrant B |
|---|---|---|---|
| Quadrant D | 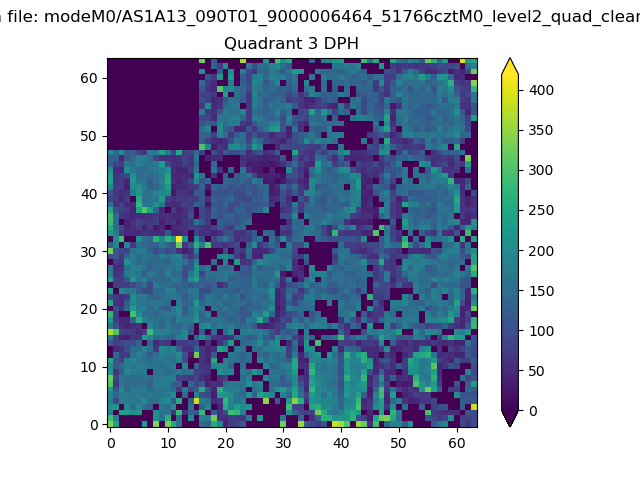 |
 |
Quadrant C |
| Plot type | Count rate plots | Images |
|---|---|---|
| Comparison with Poisson distribution Blue bars denote a histogram of data divided into 1 sec bins. Red curve is a Poisson curve with rate = median count rate of data. |
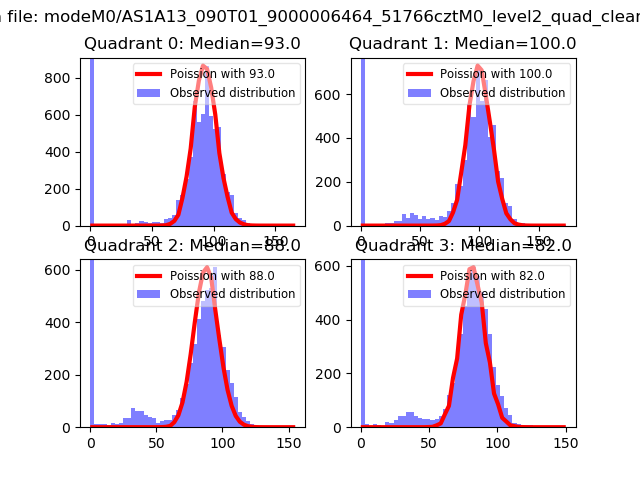 |
 |
| Quadrant-wise count rates Data is divided into 100 sec bins |
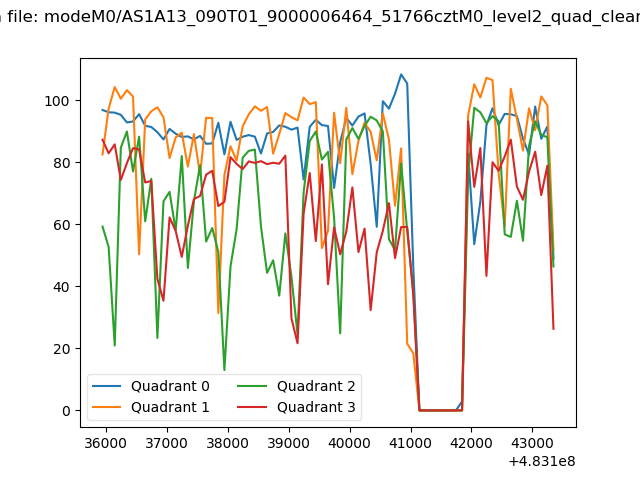 |
|
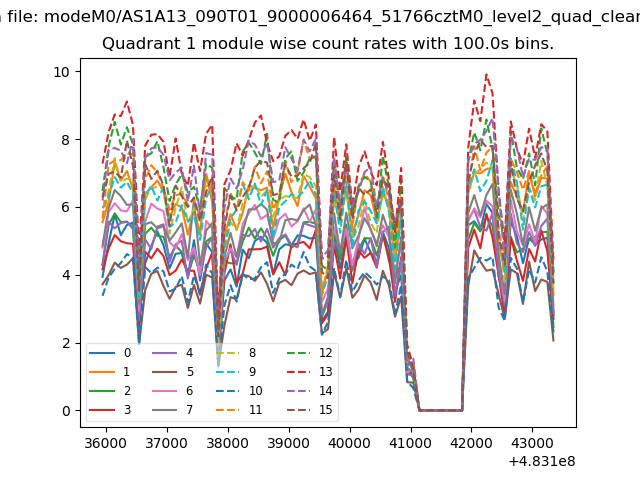
| Module-wise count rates for Quadrant A Data is divided into 100 sec bins |
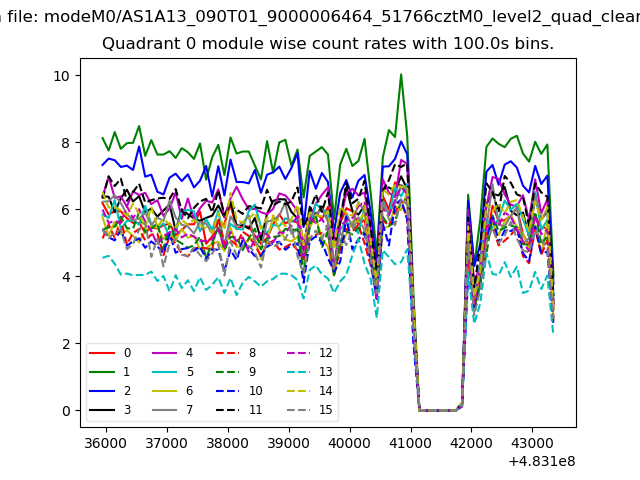 |
 |
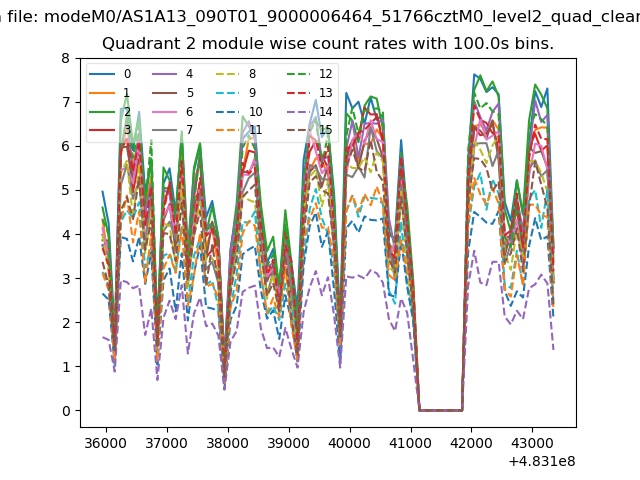
| Module-wise count rates for Quadrant B Data is divided into 100 sec bins |
 |
 |
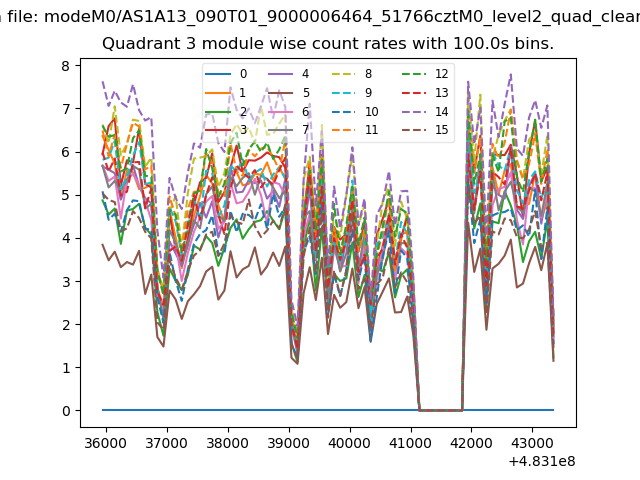
| Module-wise count rates for Quadrant C Data is divided into 100 sec bins |
 |
 |
| Module-wise count rates for Quadrant D Data is divided into 100 sec bins |
 |
 |
| Parameter | Plot |
|---|---|
| CZT HV Monitor | 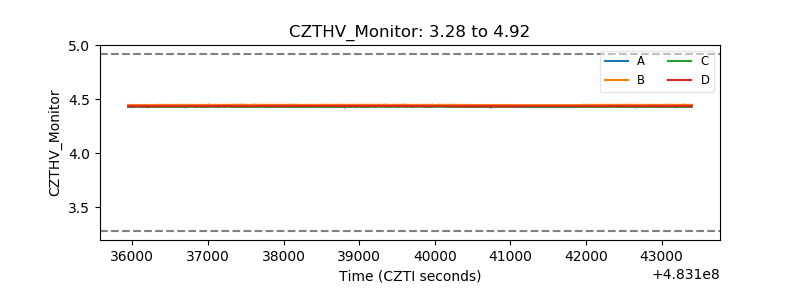 |
| D_VDD | 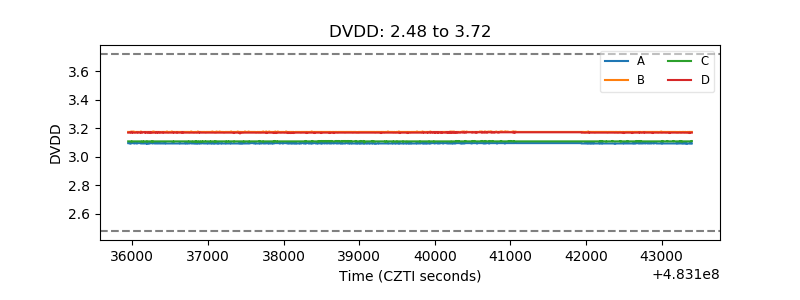 |
| Temperature 1 | 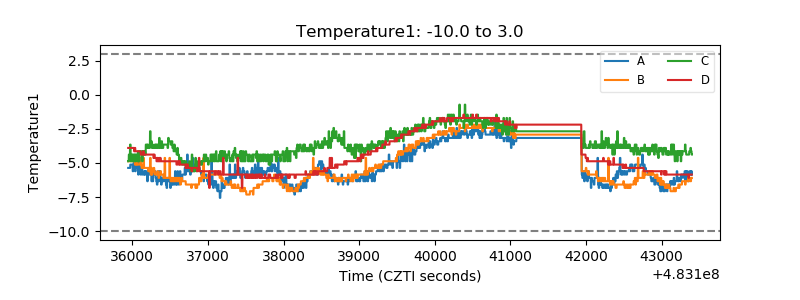 |
| Veto HV Monitor | 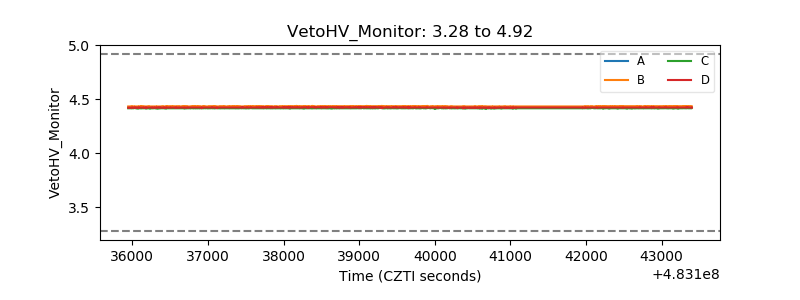 |
| Veto LLD | 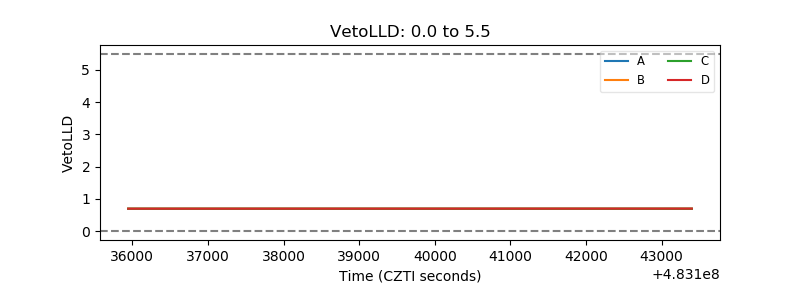 |
| Alpha Counter | 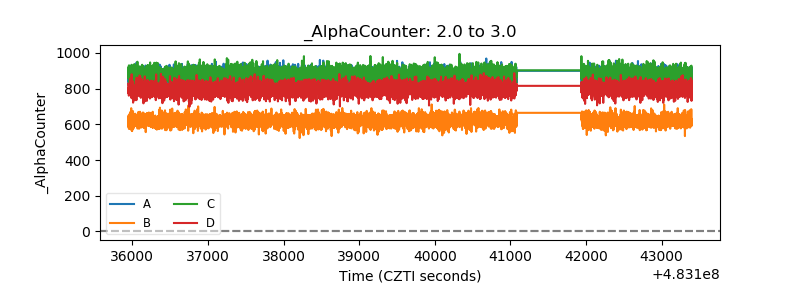 |
| _CPM_Rate | 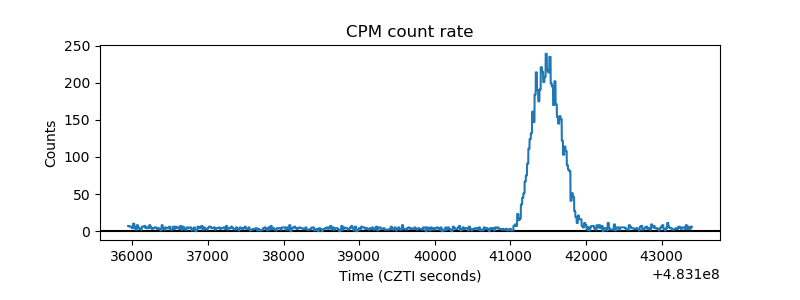 |
| CZT Counter | 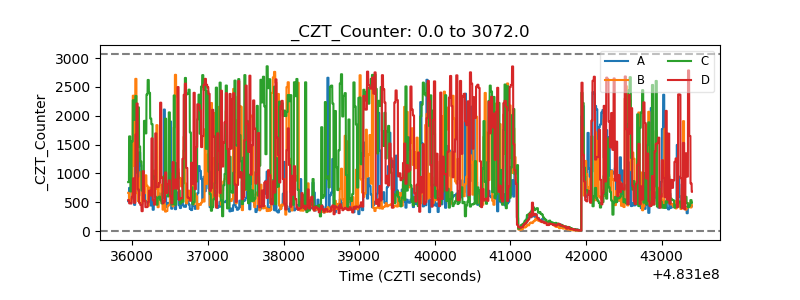 |
| +2.5 Volts monitor | 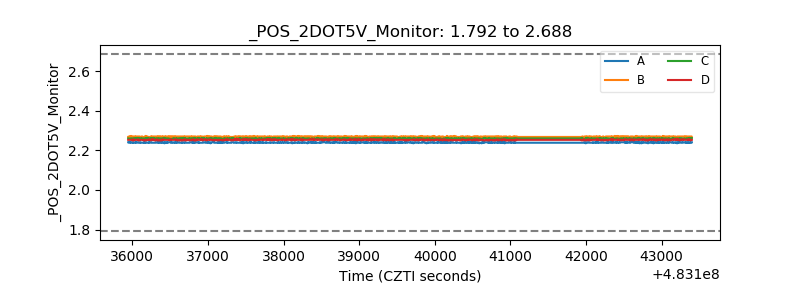 |
| +5 Volts monitor | 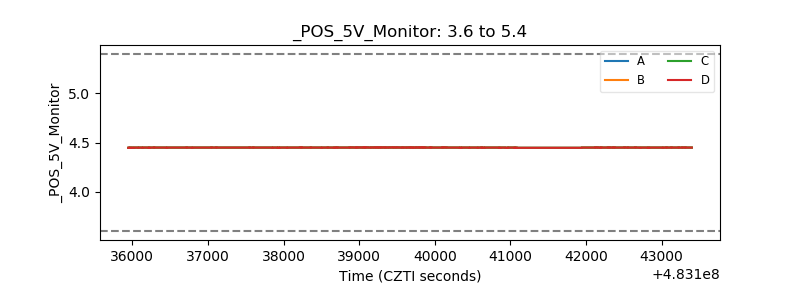 |
| _ROLL_ROT | 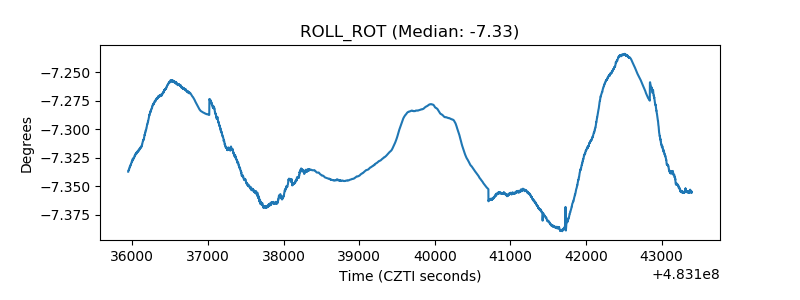 |
| _Roll_DEC | 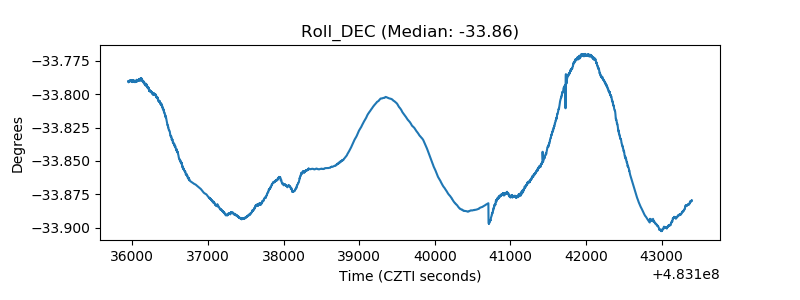 |
| _Roll_RA | 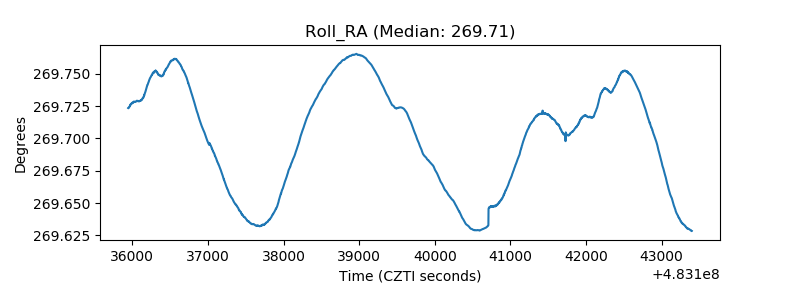 |
| Veto Counter | 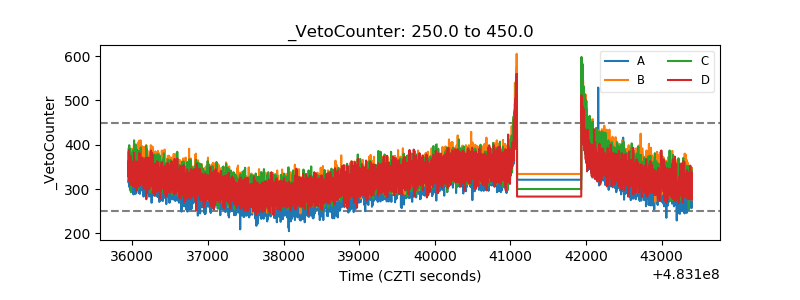 |