| Param | Original file | Final file |
|---|---|---|
| Filename | modeM0/AS1A13_090T01_9000006464_51770cztM0_level2.fits | modeM0/AS1A13_090T01_9000006464_51770cztM0_level2_quad_clean.evt |
| Size (bytes) | 693,201,600 | 88,404,480 |
| Size | 661.1 MB | 84.3 MB |
| Events in quadrant A | 4,787,179 | 604,751 |
| Events in quadrant B | 4,842,141 | 668,346 |
| Events in quadrant C | 5,925,252 | 562,137 |
| Events in quadrant D | 9,605,271 | 391,443 |
| Mode M9 | |||
|---|---|---|---|
| Quadrant | BADHDUFLAG | Total packets | Discarded packets |
| A | 0 | 20 | 0 |
| B | 0 | 21 | 0 |
| C | 0 | 21 | 0 |
| D | 0 | 21 | 0 |
| Mode SS | |||
|---|---|---|---|
| Quadrant | BADHDUFLAG | Total packets | Discarded packets |
| A | 0 | 128 | 0 |
| B | 0 | 128 | 0 |
| C | 0 | 128 | 0 |
| D | 0 | 128 | 0 |
| Mode M0 | |||
|---|---|---|---|
| Quadrant | BADHDUFLAG | Total packets | Discarded packets |
| A | 0 | 18610 | 2 |
| B | 0 | 18764 | 2 |
| C | 0 | 21835 | 2 |
| D | 0 | 33010 | 2 |
| Quadrant | Total seconds | Saturated seconds | Saturation percentage |
|---|---|---|---|
| A | 6457 | 437 | 6.767849% |
| B | 6457 | 396 | 6.132879% |
| C | 6457 | 786 | 12.172836% |
| D | 6457 | 2422 | 37.509679% |
Noise dominated data is calculated using 1-second bins in cleaned event files. If a bin has >2000 counts, and if more than 50% of those come from <1% of pixels, then it is considered to be noise-dominated and hence unusable.
| Quadrant | # 1 sec bins | Bins with >0 counts | Bins with >2000 counts | High rate bins dominated by noise | Noise dominated (total time) | Noise dominated (detector-on time) | Marked lightcurve |
|---|---|---|---|---|---|---|---|
| A | 7580 | 6451 | 302 | 302 | 3.98% | 4.68% | 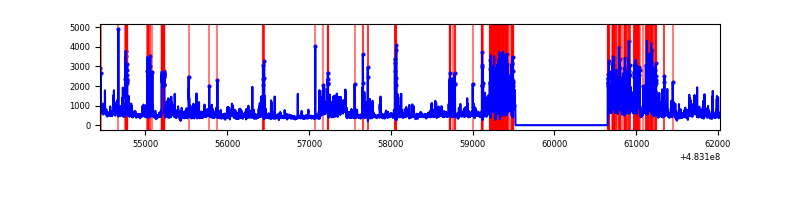 |
| B | 7580 | 6451 | 218 | 218 | 2.88% | 3.38% | 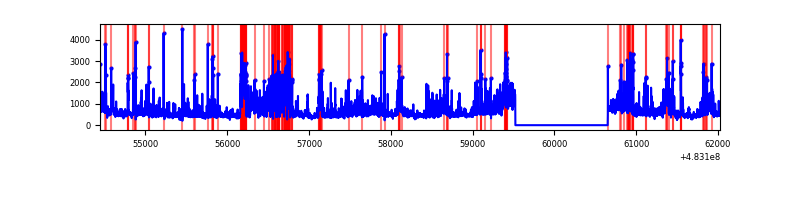 |
| C | 7580 | 6449 | 633 | 633 | 8.35% | 9.82% | 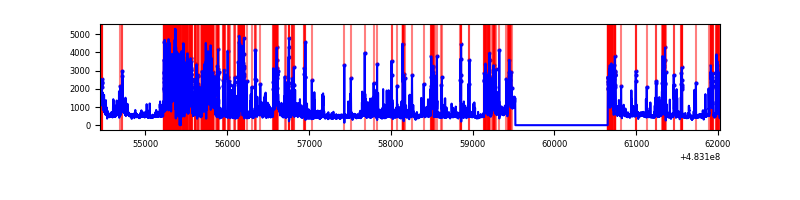 |
| D | 7579 | 6450 | 1996 | 1996 | 26.34% | 30.95% | 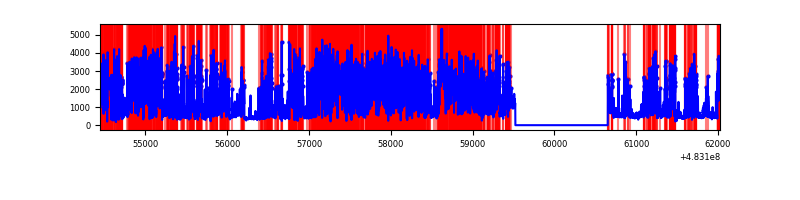 |
Top three noisy pixels from each quadrant. If the there are fewer than three noisy pixels in the level2.evt file, extra rows are filled as -1
| Pixel properties | Quadrant properties | ||||||
|---|---|---|---|---|---|---|---|
| Quadrant | DetID | PixID | Counts | Sigma | Mean | Median | Sigma |
| A | 11 | 3 | 598664 | 3475.39 | 696 | 681 | 172.1 |
| A | 2 | 143 | 464079 | 2693.21 | 696 | 681 | 172.1 |
| A | 13 | 248 | 273614 | 1586.25 | 696 | 681 | 172.1 |
| B | 4 | 206 | 1383859 | 9294.46 | 699 | 675 | 148.8 |
| B | 9 | 223 | 116988 | 781.58 | 699 | 675 | 148.8 |
| B | 1 | 239 | 102200 | 682.21 | 699 | 675 | 148.8 |
| C | 1 | 243 | 1173662 | 6431.64 | 669 | 666 | 182.4 |
| C | 15 | 232 | 626048 | 3429.03 | 669 | 666 | 182.4 |
| C | 15 | 218 | 491647 | 2692.09 | 669 | 666 | 182.4 |
| D | 11 | 129 | 6908439 | 44020.8 | 560 | 542 | 156.9 |
| D | 8 | 176 | 162904 | 1034.66 | 560 | 542 | 156.9 |
| D | 10 | 181 | 107519 | 681.71 | 560 | 542 | 156.9 |
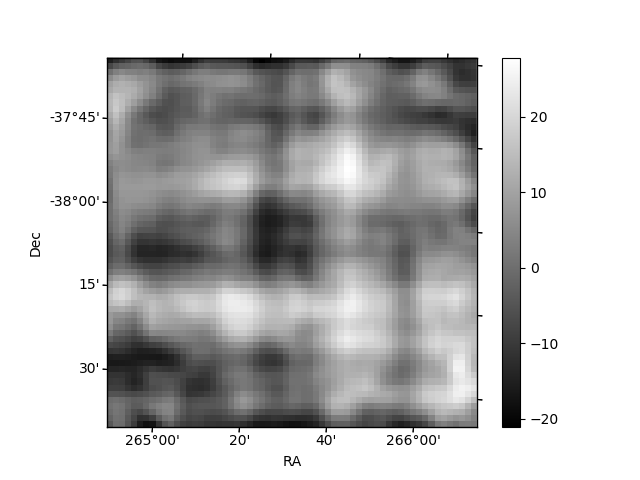
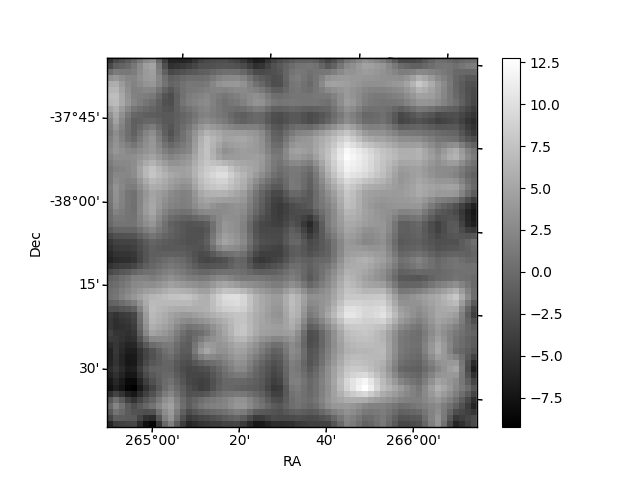
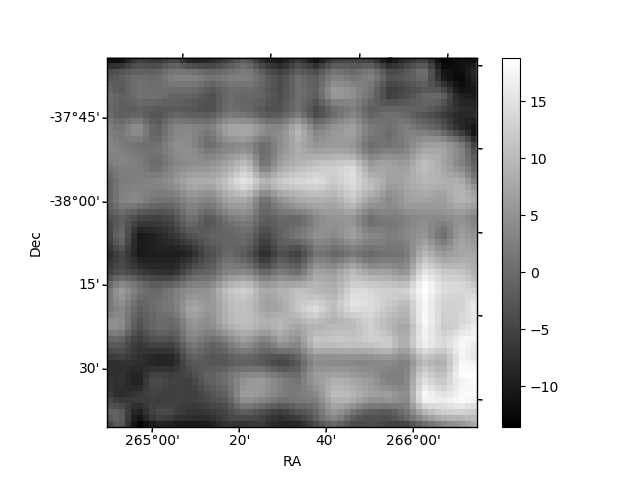
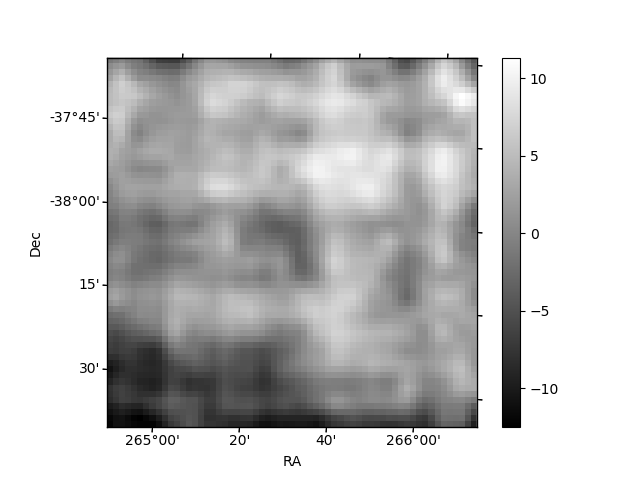
Histogram calculated using DETX and DETY for each event in the final _common_clean file
| Quadrant A | 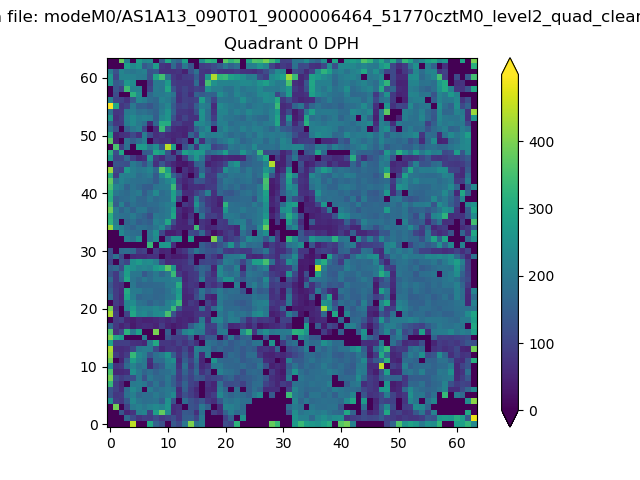 |
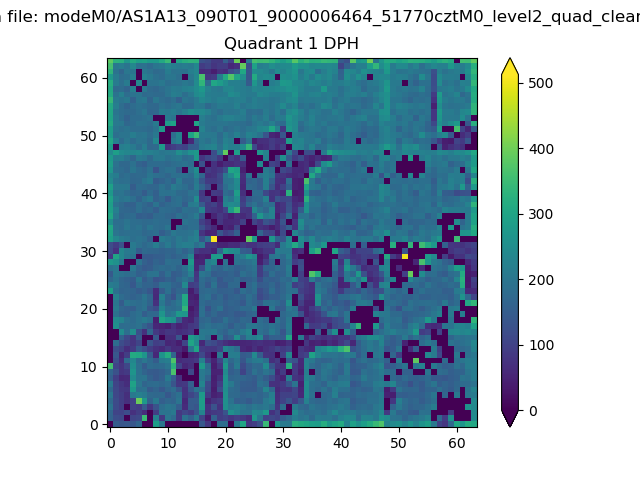 |
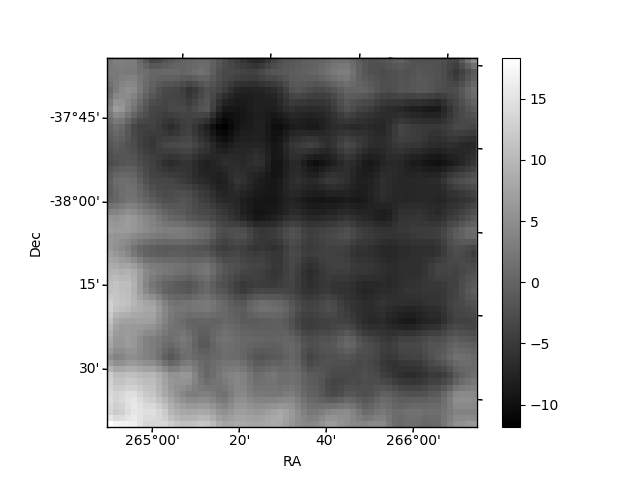
Quadrant B |
|---|---|---|---|
| Quadrant D | 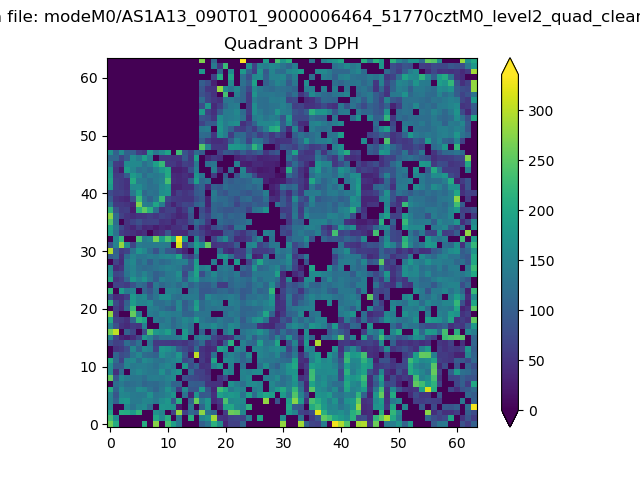 |
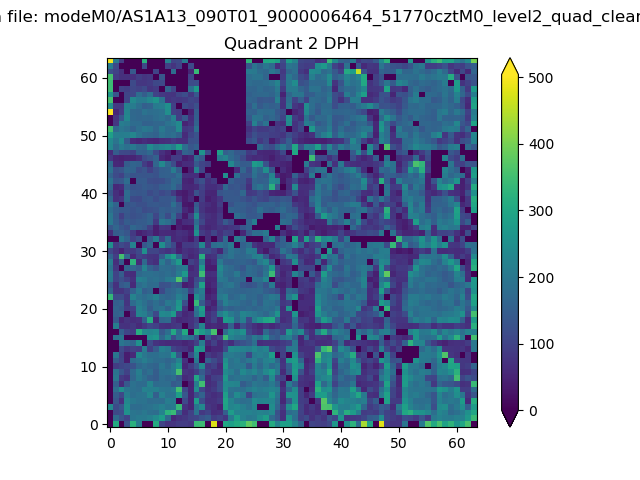 |
Quadrant C |
| Plot type | Count rate plots | Images |
|---|---|---|
| Comparison with Poisson distribution Blue bars denote a histogram of data divided into 1 sec bins. Red curve is a Poisson curve with rate = median count rate of data. |
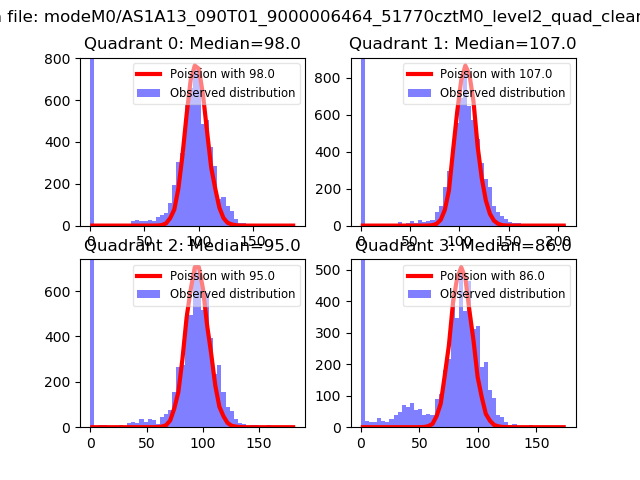 |
 |
| Quadrant-wise count rates Data is divided into 100 sec bins |
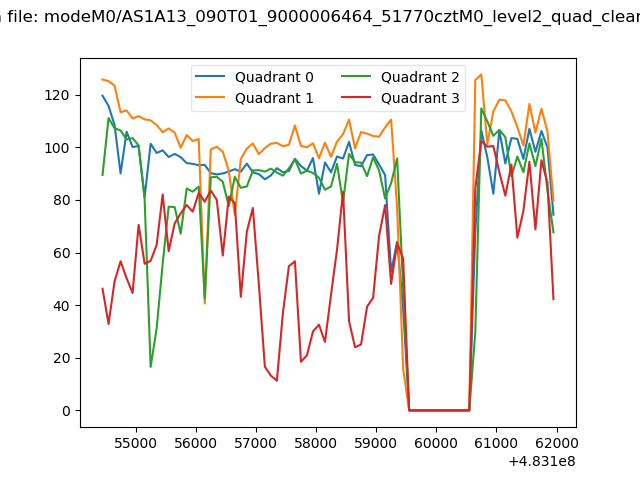 |
|
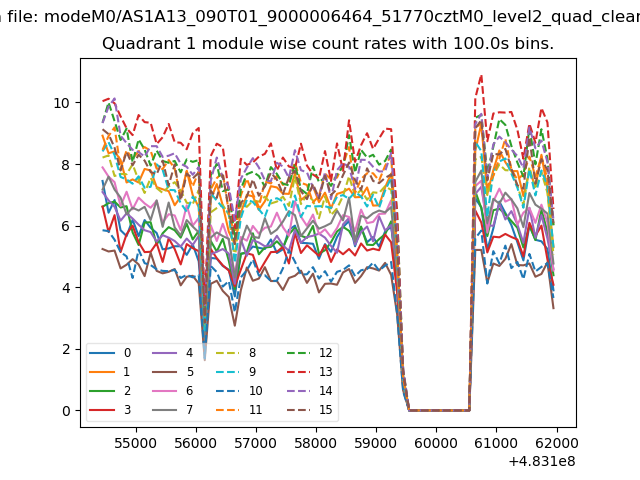
| Module-wise count rates for Quadrant A Data is divided into 100 sec bins |
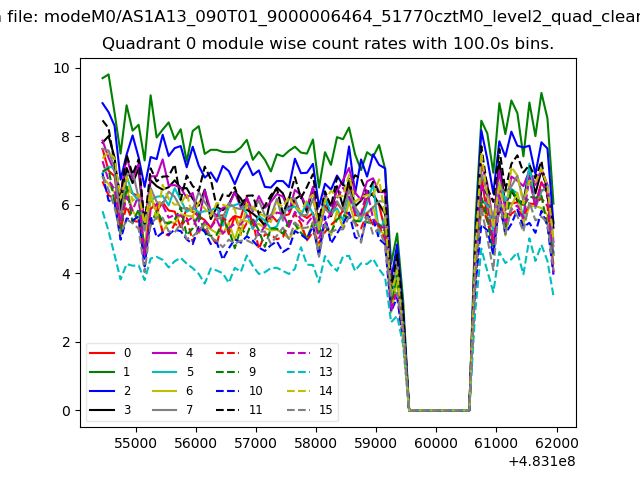 |
 |
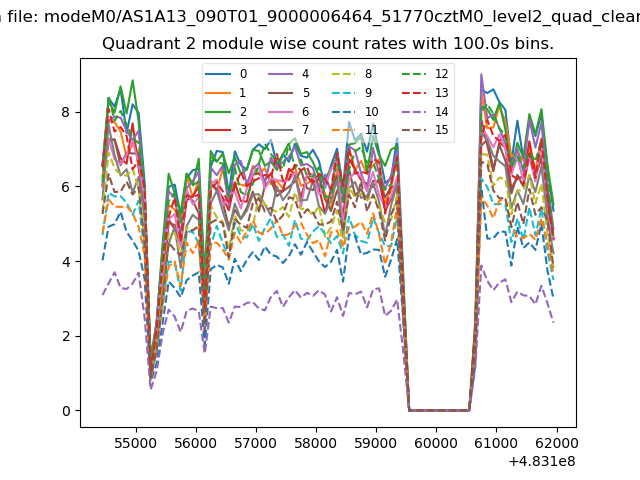
| Module-wise count rates for Quadrant B Data is divided into 100 sec bins |
 |
 |
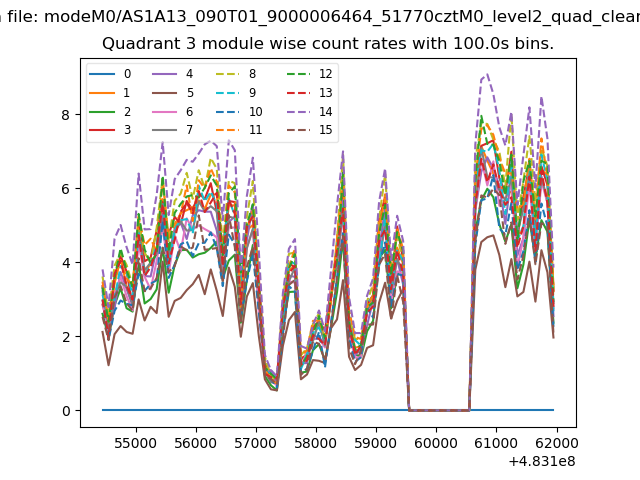
| Module-wise count rates for Quadrant C Data is divided into 100 sec bins |
 |
 |
| Module-wise count rates for Quadrant D Data is divided into 100 sec bins |
 |
 |
| Parameter | Plot |
|---|---|
| CZT HV Monitor | 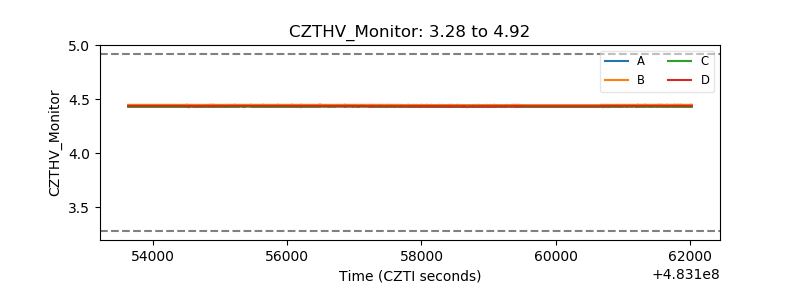 |
| D_VDD | 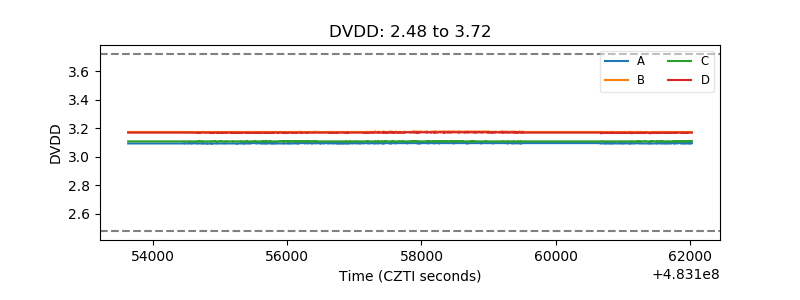 |
| Temperature 1 | 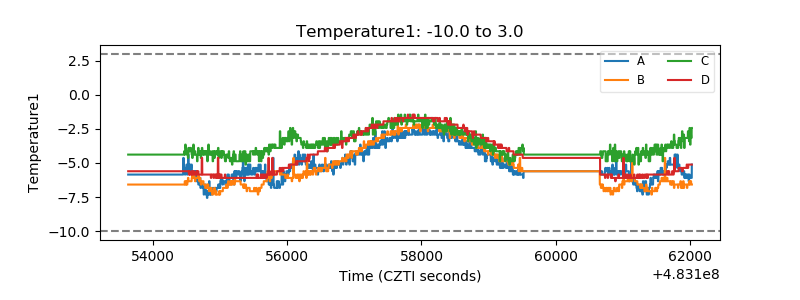 |
| Veto HV Monitor | 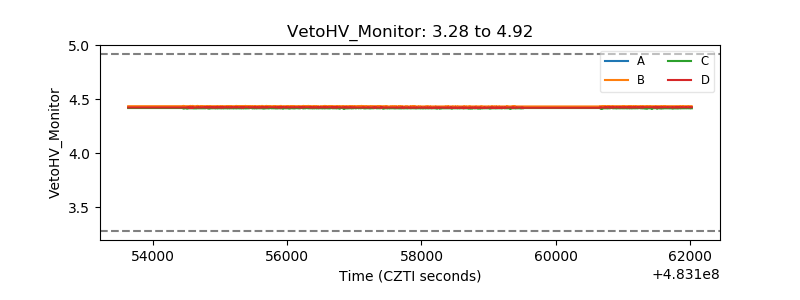 |
| Veto LLD | 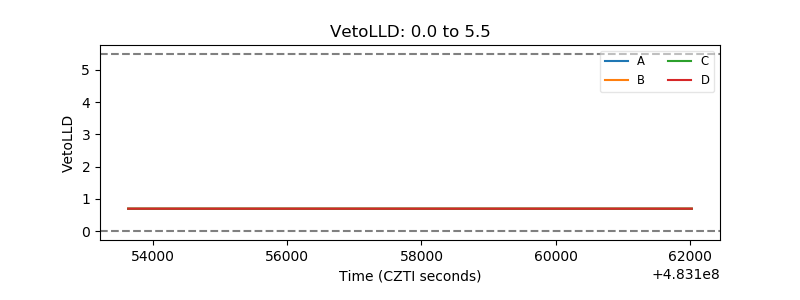 |
| Alpha Counter | 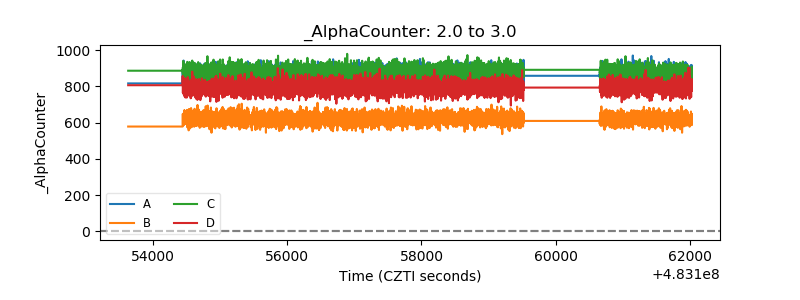 |
| _CPM_Rate | 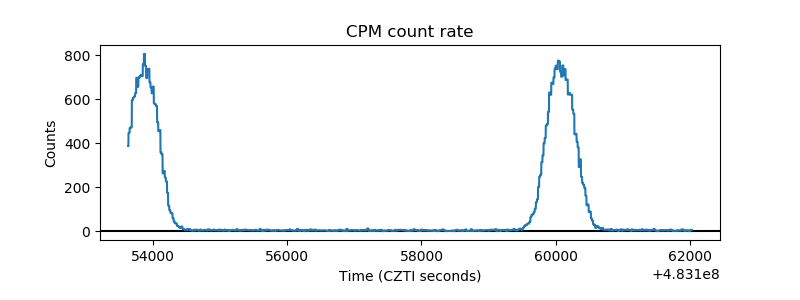 |
| CZT Counter | 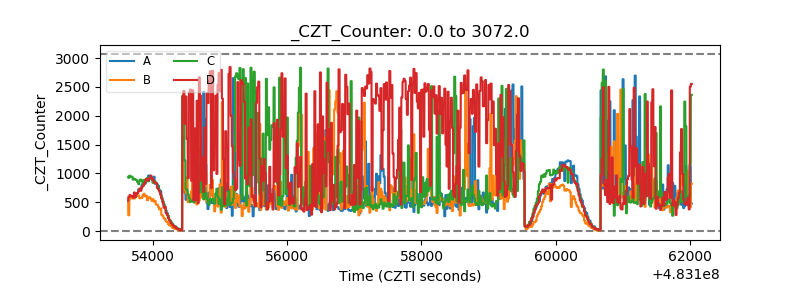 |
| +2.5 Volts monitor | 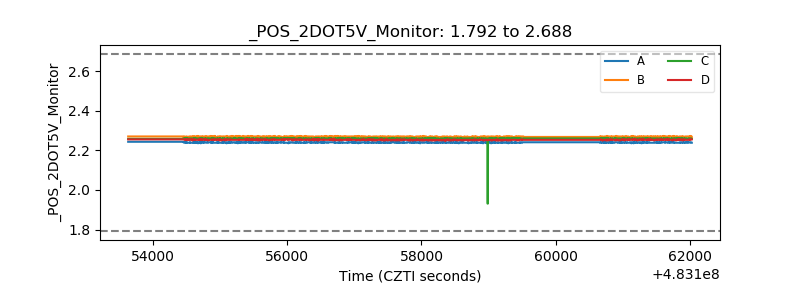 |
| +5 Volts monitor | 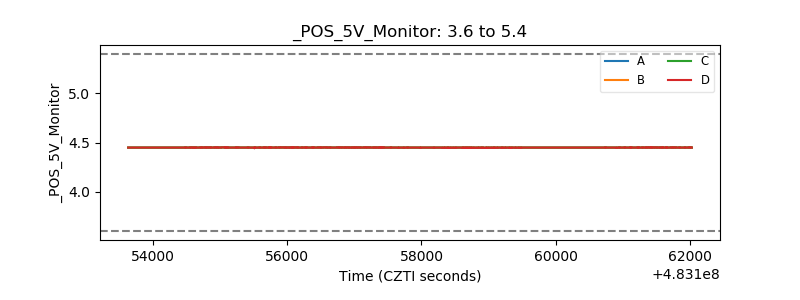 |
| _ROLL_ROT | 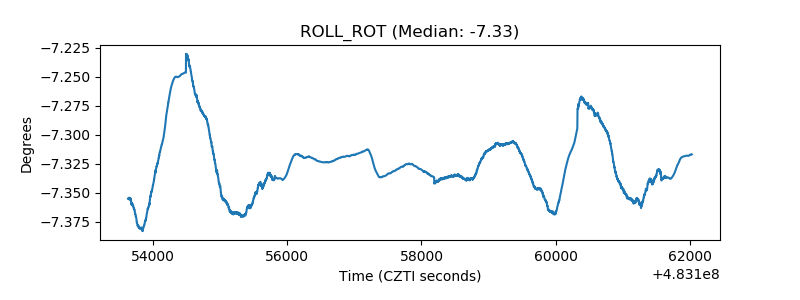 |
| _Roll_DEC | 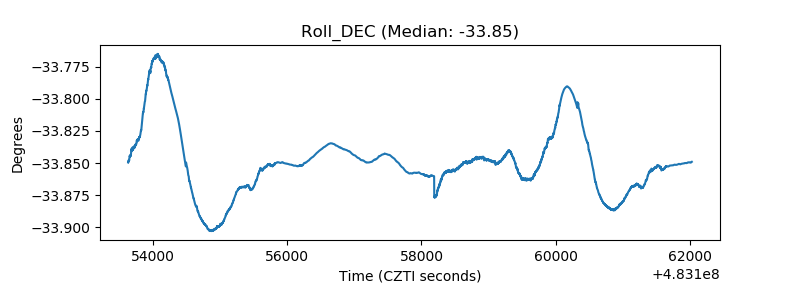 |
| _Roll_RA | 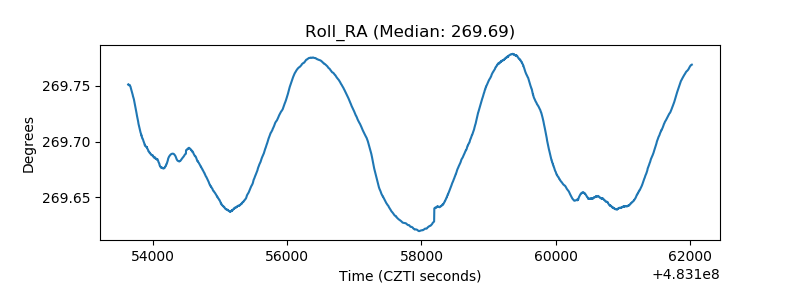 |
| Veto Counter | 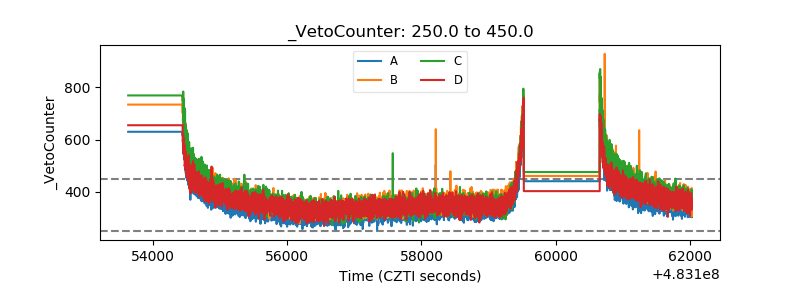 |