| Param | Original file | Final file |
|---|---|---|
| Filename | modeM0/AS1A13_090T01_9000006464_51771cztM0_level2.fits | modeM0/AS1A13_090T01_9000006464_51771cztM0_level2_quad_clean.evt |
| Size (bytes) | 591,710,400 | 89,164,800 |
| Size | 564.3 MB | 85.0 MB |
| Events in quadrant A | 4,145,847 | 608,279 |
| Events in quadrant B | 5,175,697 | 632,500 |
| Events in quadrant C | 4,652,130 | 584,414 |
| Events in quadrant D | 7,448,105 | 441,237 |
| Mode M9 | |||
|---|---|---|---|
| Quadrant | BADHDUFLAG | Total packets | Discarded packets |
| A | 0 | 12 | 0 |
| B | 0 | 12 | 0 |
| C | 0 | 12 | 0 |
| D | 0 | 12 | 0 |
| Mode SS | |||
|---|---|---|---|
| Quadrant | BADHDUFLAG | Total packets | Discarded packets |
| A | 0 | 126 | 0 |
| B | 0 | 126 | 0 |
| C | 0 | 126 | 0 |
| D | 0 | 126 | 0 |
| Mode M0 | |||
|---|---|---|---|
| Quadrant | BADHDUFLAG | Total packets | Discarded packets |
| A | 0 | 16340 | 1 |
| B | 0 | 19661 | 1 |
| C | 0 | 17827 | 1 |
| D | 0 | 26342 | 1 |
| Quadrant | Total seconds | Saturated seconds | Saturation percentage |
|---|---|---|---|
| A | 6209 | 211 | 3.398293% |
| B | 6209 | 549 | 8.842004% |
| C | 6210 | 309 | 4.975845% |
| D | 6210 | 1511 | 24.331723% |
Noise dominated data is calculated using 1-second bins in cleaned event files. If a bin has >2000 counts, and if more than 50% of those come from <1% of pixels, then it is considered to be noise-dominated and hence unusable.
| Quadrant | # 1 sec bins | Bins with >0 counts | Bins with >2000 counts | High rate bins dominated by noise | Noise dominated (total time) | Noise dominated (detector-on time) | Marked lightcurve |
|---|---|---|---|---|---|---|---|
| A | 7364 | 6210 | 139 | 139 | 1.89% | 2.24% | 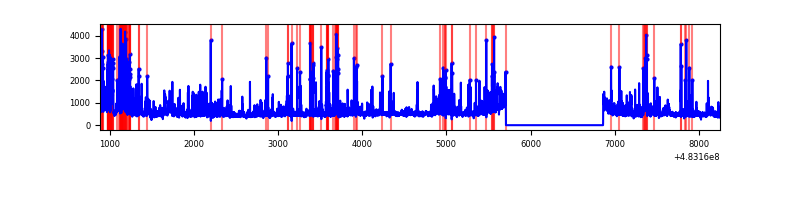 |
| B | 7364 | 6210 | 304 | 304 | 4.13% | 4.90% | 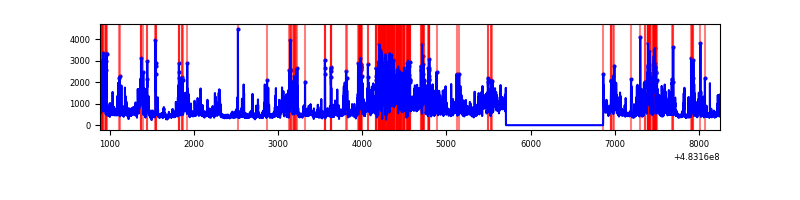 |
| C | 7365 | 6211 | 268 | 268 | 3.64% | 4.31% | 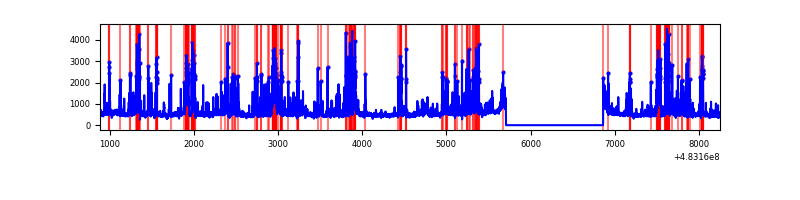 |
| D | 7365 | 6211 | 1302 | 1302 | 17.68% | 20.96% | 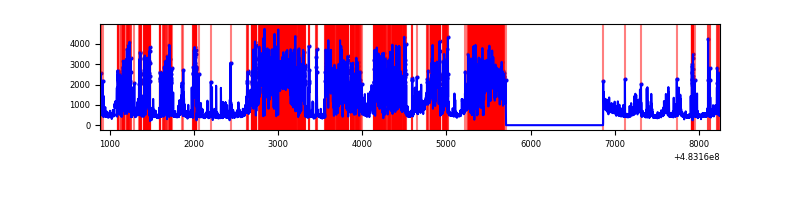 |
Top three noisy pixels from each quadrant. If the there are fewer than three noisy pixels in the level2.evt file, extra rows are filled as -1
| Pixel properties | Quadrant properties | ||||||
|---|---|---|---|---|---|---|---|
| Quadrant | DetID | PixID | Counts | Sigma | Mean | Median | Sigma |
| A | 11 | 3 | 397279 | 2403.55 | 683 | 671 | 165.0 |
| A | 2 | 143 | 263377 | 1592.07 | 683 | 671 | 165.0 |
| A | 8 | 249 | 130351 | 785.9 | 683 | 671 | 165.0 |
| B | 4 | 206 | 1770413 | 12543.32 | 665 | 642 | 141.1 |
| B | 4 | 174 | 277645 | 1963.27 | 665 | 642 | 141.1 |
| B | 1 | 239 | 89439 | 629.35 | 665 | 642 | 141.1 |
| C | 1 | 243 | 524842 | 2865.22 | 670 | 663 | 182.9 |
| C | 15 | 232 | 400798 | 2187.18 | 670 | 663 | 182.9 |
| C | 15 | 218 | 264414 | 1441.69 | 670 | 663 | 182.9 |
| D | 11 | 129 | 4020295 | 24034.48 | 601 | 580 | 167.2 |
| D | 7 | 222 | 617908 | 3691.1 | 601 | 580 | 167.2 |
| D | 3 | 12 | 138089 | 822.19 | 601 | 580 | 167.2 |
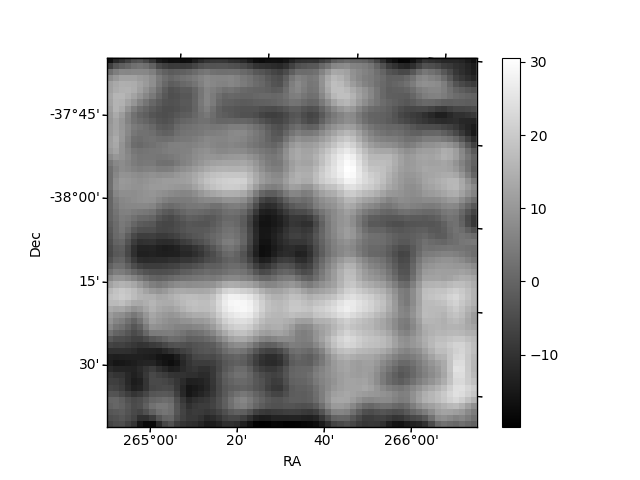
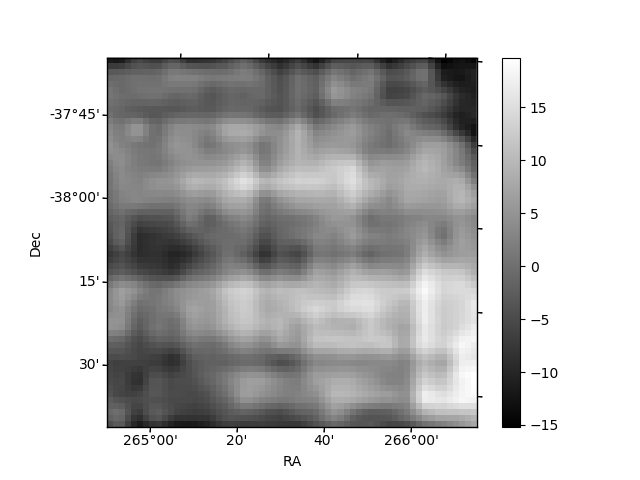
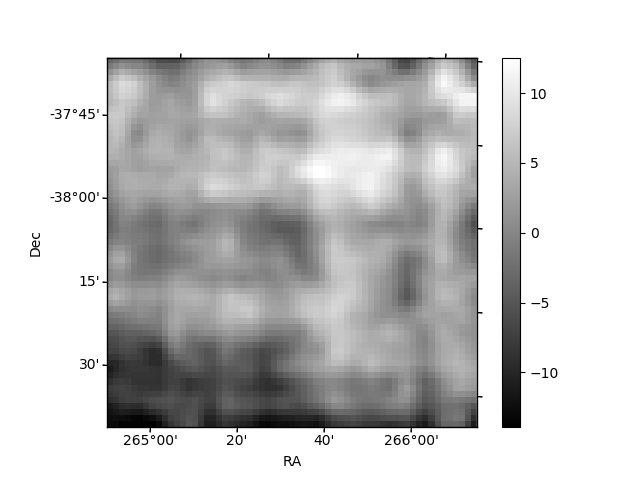
Histogram calculated using DETX and DETY for each event in the final _common_clean file
| Quadrant A | 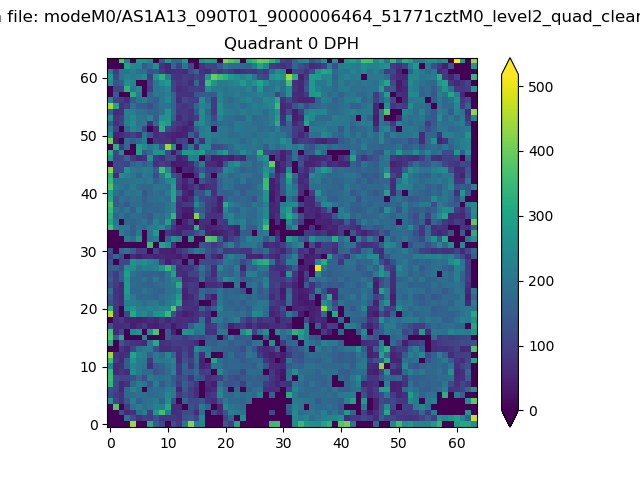 |
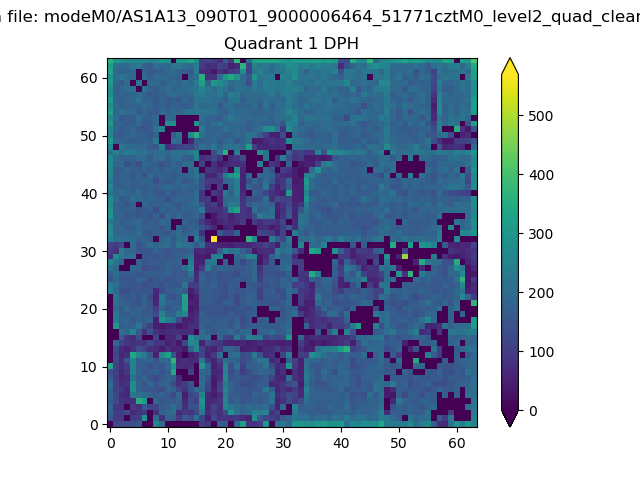 |
Quadrant B |
|---|---|---|---|
| Quadrant D | 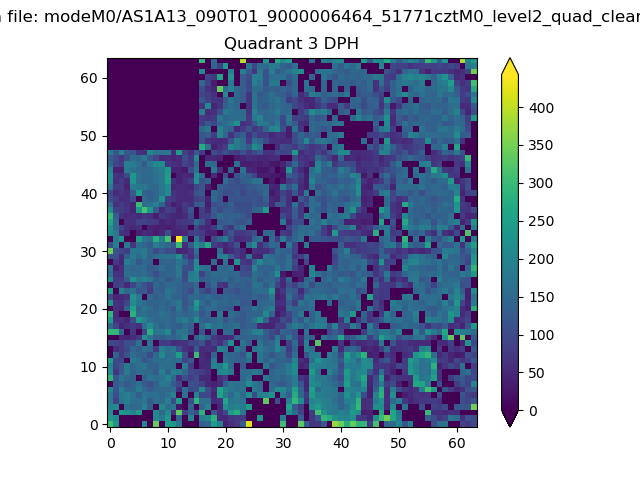 |
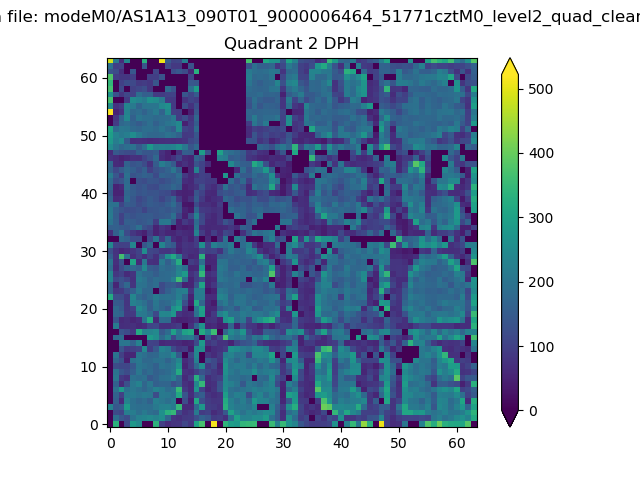 |
Quadrant C |
| Plot type | Count rate plots | Images |
|---|---|---|
| Comparison with Poisson distribution Blue bars denote a histogram of data divided into 1 sec bins. Red curve is a Poisson curve with rate = median count rate of data. |
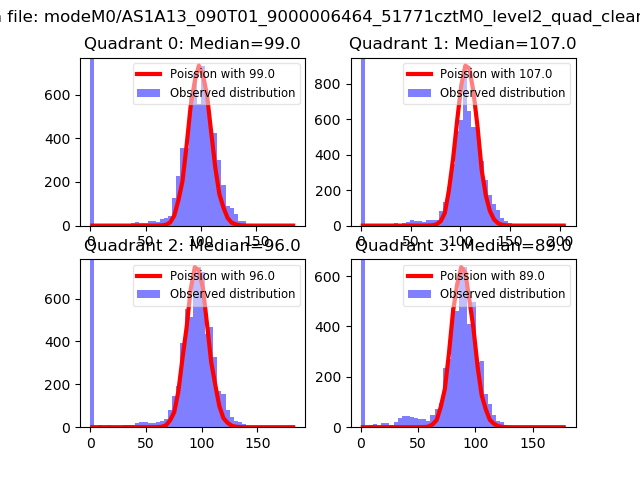 |
 |
| Quadrant-wise count rates Data is divided into 100 sec bins |
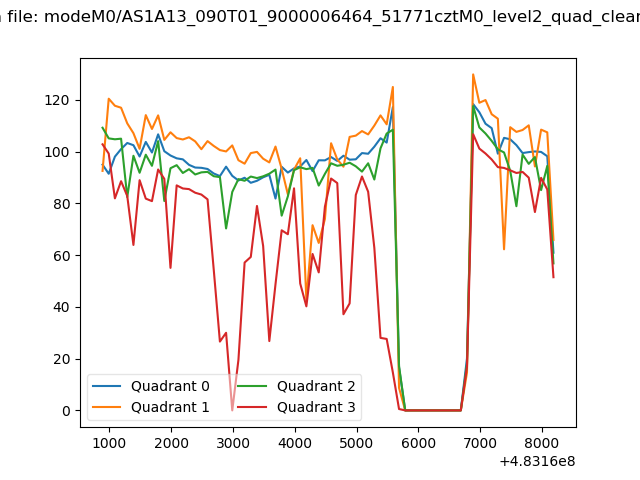 |
|
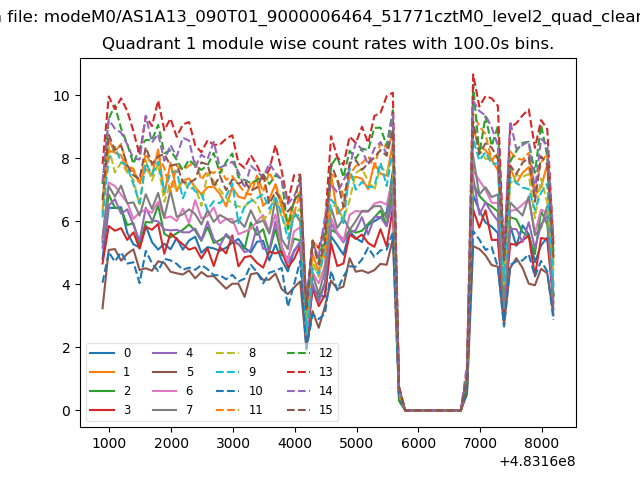
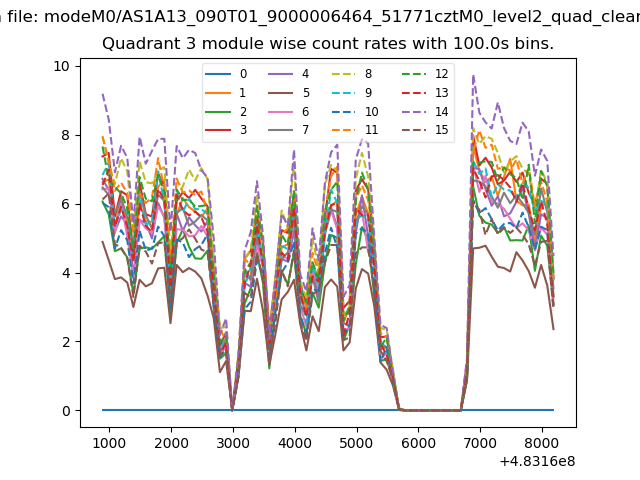
| Module-wise count rates for Quadrant A Data is divided into 100 sec bins |
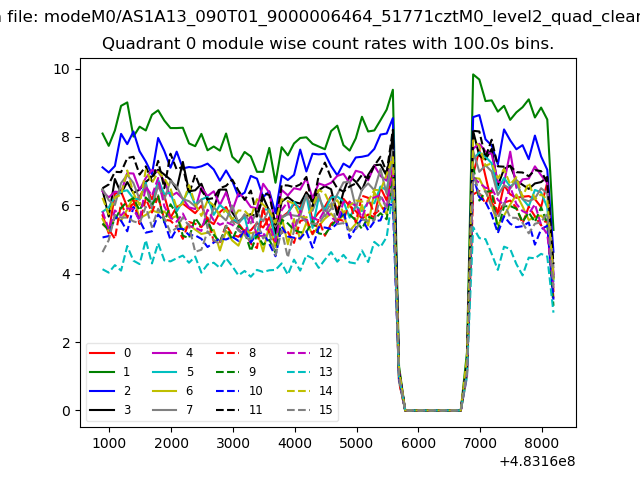 |
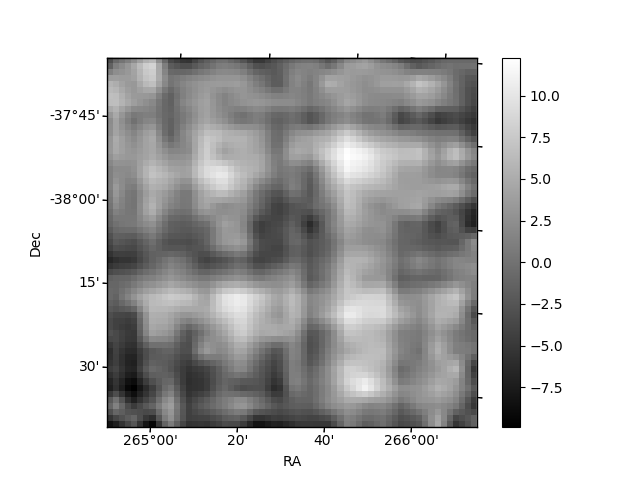 |
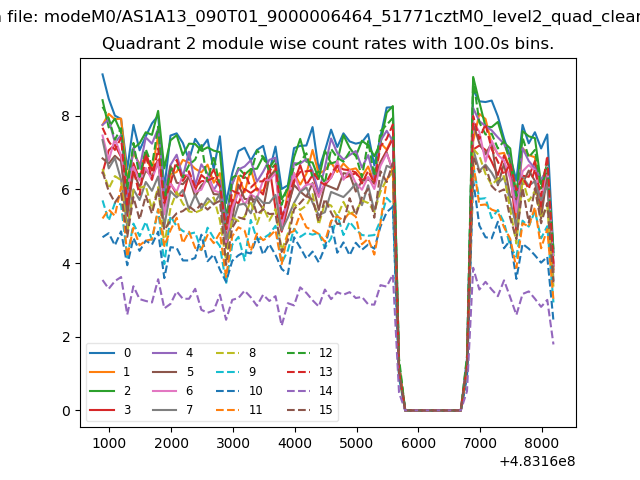
| Module-wise count rates for Quadrant B Data is divided into 100 sec bins |
 |
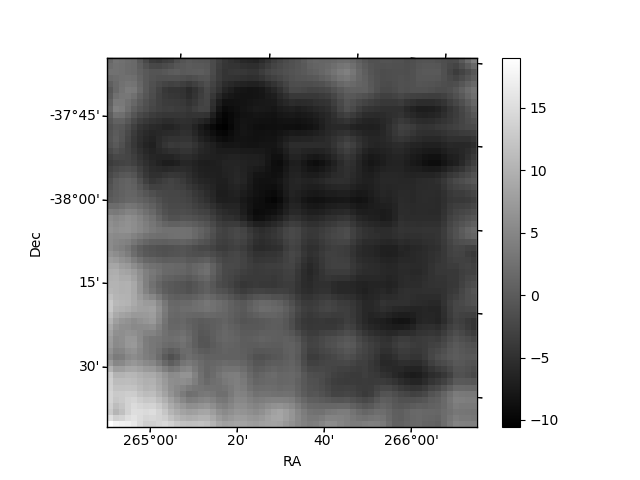 |
| Module-wise count rates for Quadrant C Data is divided into 100 sec bins |
 |
 |
| Module-wise count rates for Quadrant D Data is divided into 100 sec bins |
 |
 |
| Parameter | Plot |
|---|---|
| CZT HV Monitor | 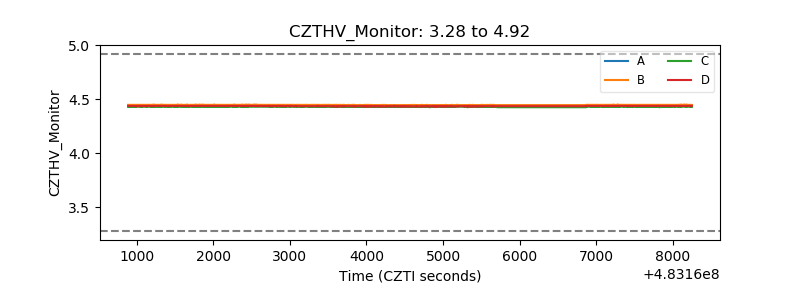 |
| D_VDD | 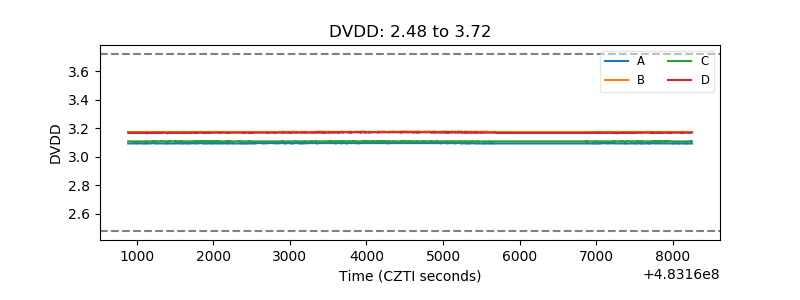 |
| Temperature 1 | 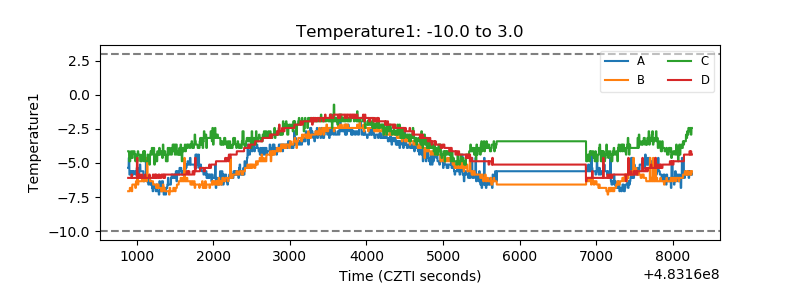 |
| Veto HV Monitor | 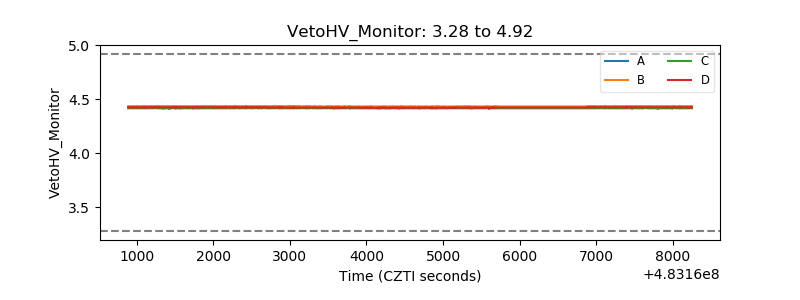 |
| Veto LLD | 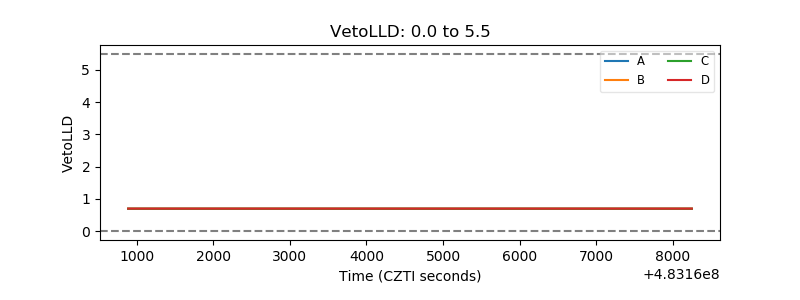 |
| Alpha Counter | 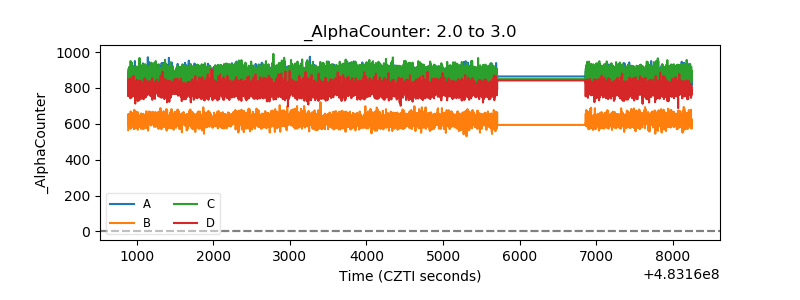 |
| _CPM_Rate | 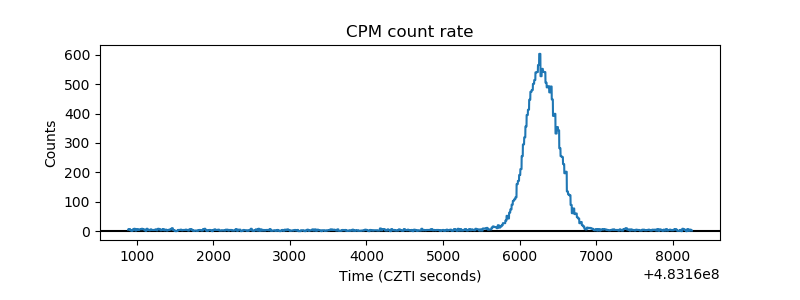 |
| CZT Counter | 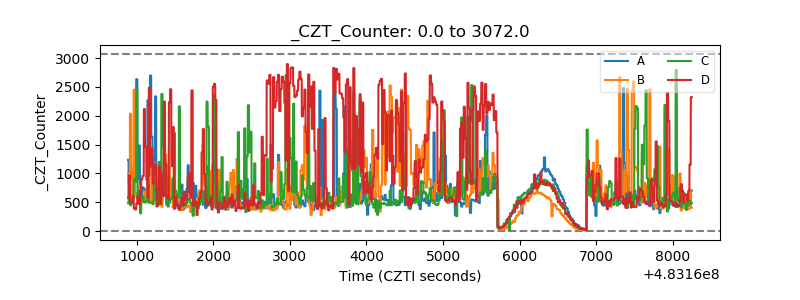 |
| +2.5 Volts monitor | 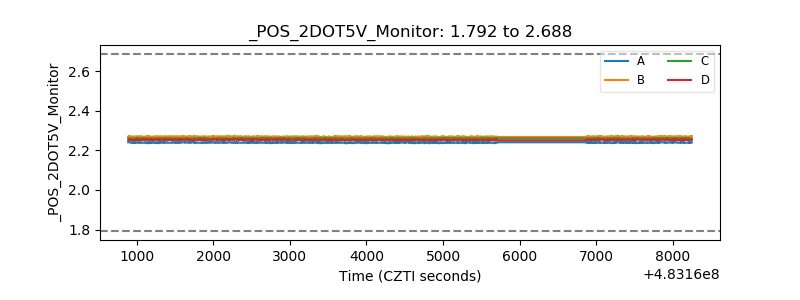 |
| +5 Volts monitor | 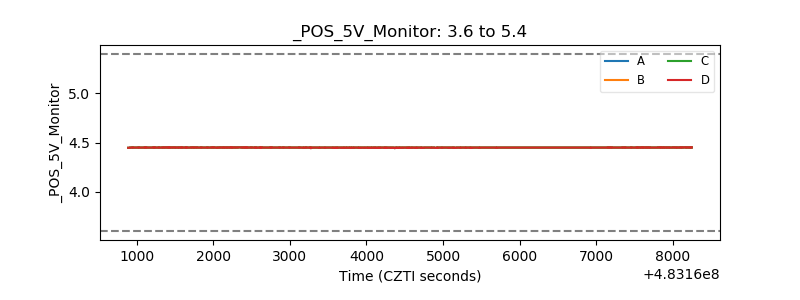 |
| _ROLL_ROT | 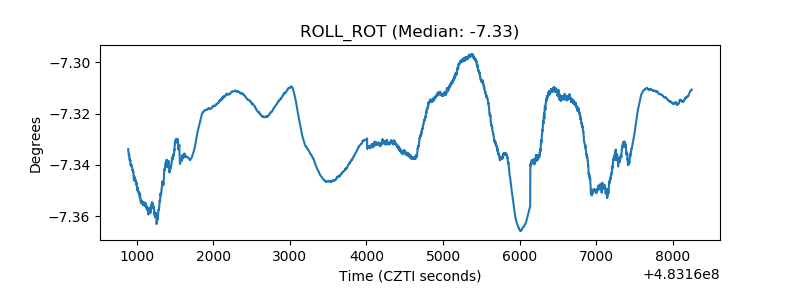 |
| _Roll_DEC | 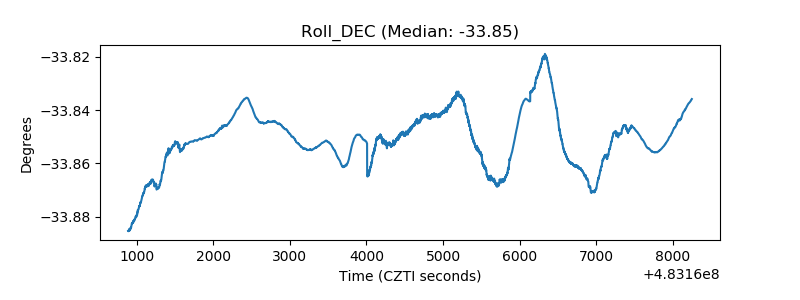 |
| _Roll_RA | 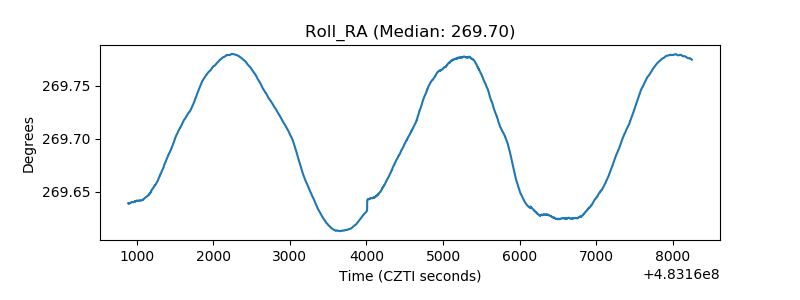 |
| Veto Counter | 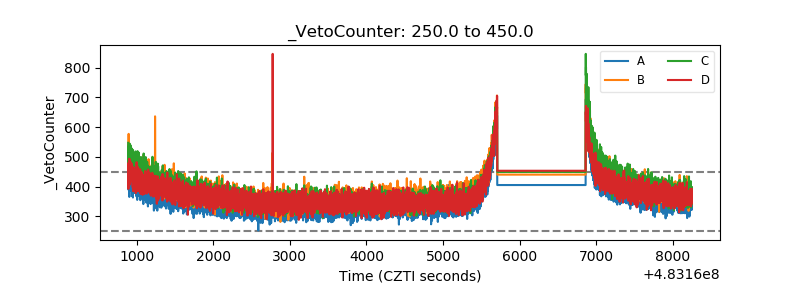 |