| Param | Original file | Final file |
|---|---|---|
| Filename | modeM0/AS1A13_090T01_9000006464_51772cztM0_level2.fits | modeM0/AS1A13_090T01_9000006464_51772cztM0_level2_quad_clean.evt |
| Size (bytes) | 659,733,120 | 87,690,240 |
| Size | 629.2 MB | 83.6 MB |
| Events in quadrant A | 4,266,449 | 611,730 |
| Events in quadrant B | 5,510,470 | 634,484 |
| Events in quadrant C | 4,607,496 | 598,272 |
| Events in quadrant D | 9,542,463 | 365,718 |
| Mode M9 | |||
|---|---|---|---|
| Quadrant | BADHDUFLAG | Total packets | Discarded packets |
| A | 0 | 11 | 0 |
| B | 0 | 11 | 0 |
| C | 0 | 11 | 0 |
| D | 0 | 11 | 0 |
| Mode SS | |||
|---|---|---|---|
| Quadrant | BADHDUFLAG | Total packets | Discarded packets |
| A | 0 | 128 | 0 |
| B | 0 | 128 | 0 |
| C | 0 | 128 | 0 |
| D | 0 | 128 | 0 |
| Mode M0 | |||
|---|---|---|---|
| Quadrant | BADHDUFLAG | Total packets | Discarded packets |
| A | 0 | 17007 | 1 |
| B | 0 | 20752 | 1 |
| C | 0 | 17893 | 1 |
| D | 0 | 32643 | 1 |
| Quadrant | Total seconds | Saturated seconds | Saturation percentage |
|---|---|---|---|
| A | 6379 | 277 | 4.342373% |
| B | 6379 | 634 | 9.938862% |
| C | 6379 | 258 | 4.044521% |
| D | 6380 | 2564 | 40.188088% |
Noise dominated data is calculated using 1-second bins in cleaned event files. If a bin has >2000 counts, and if more than 50% of those come from <1% of pixels, then it is considered to be noise-dominated and hence unusable.
| Quadrant | # 1 sec bins | Bins with >0 counts | Bins with >2000 counts | High rate bins dominated by noise | Noise dominated (total time) | Noise dominated (detector-on time) | Marked lightcurve |
|---|---|---|---|---|---|---|---|
| A | 7449 | 6380 | 131 | 131 | 1.76% | 2.05% | 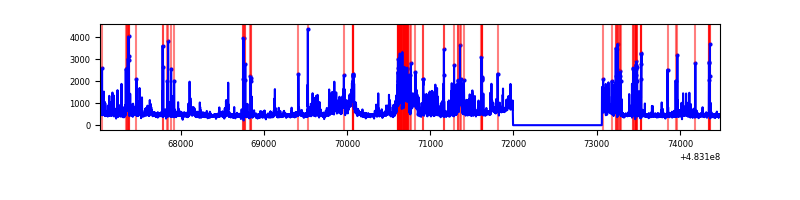 |
| B | 7449 | 6379 | 375 | 375 | 5.03% | 5.88% | 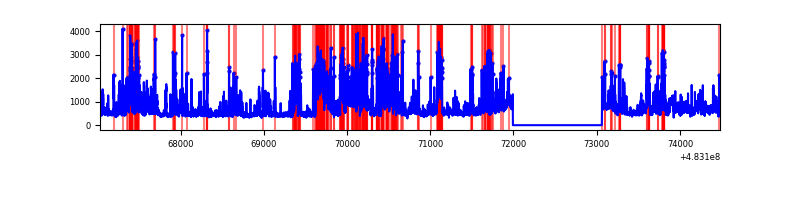 |
| C | 7449 | 6380 | 198 | 198 | 2.66% | 3.10% | 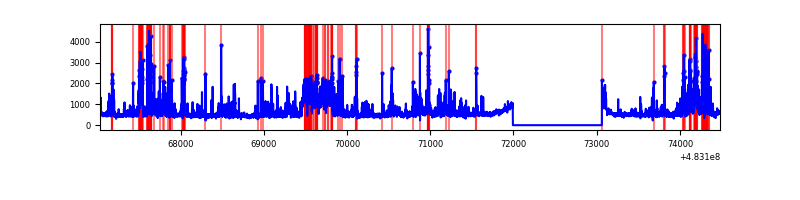 |
| D | 7450 | 6380 | 2236 | 2236 | 30.01% | 35.05% | 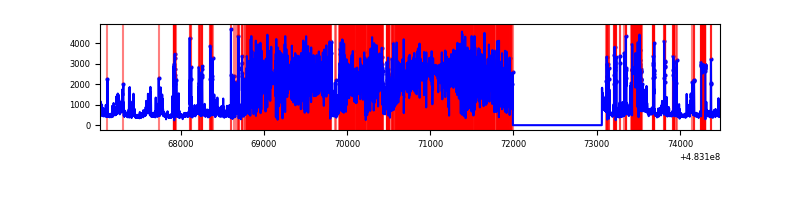 |
Top three noisy pixels from each quadrant. If the there are fewer than three noisy pixels in the level2.evt file, extra rows are filled as -1
| Pixel properties | Quadrant properties | ||||||
|---|---|---|---|---|---|---|---|
| Quadrant | DetID | PixID | Counts | Sigma | Mean | Median | Sigma |
| A | 2 | 143 | 373997 | 2178.41 | 704 | 687 | 171.4 |
| A | 7 | 206 | 290286 | 1689.92 | 704 | 687 | 171.4 |
| A | 12 | 3 | 140715 | 817.12 | 704 | 687 | 171.4 |
| B | 4 | 206 | 1601490 | 10926.76 | 683 | 658 | 146.5 |
| B | 4 | 174 | 408300 | 2782.43 | 683 | 658 | 146.5 |
| B | 10 | 44 | 195933 | 1332.88 | 683 | 658 | 146.5 |
| C | 15 | 218 | 388752 | 2035.42 | 692 | 687 | 190.7 |
| C | 12 | 2 | 379403 | 1986.39 | 692 | 687 | 190.7 |
| C | 1 | 243 | 220263 | 1151.69 | 692 | 687 | 190.7 |
| D | 11 | 129 | 6902112 | 44943.18 | 555 | 536 | 153.6 |
| D | 0 | 18 | 84487 | 546.69 | 555 | 536 | 153.6 |
| D | 7 | 159 | 79907 | 516.87 | 555 | 536 | 153.6 |
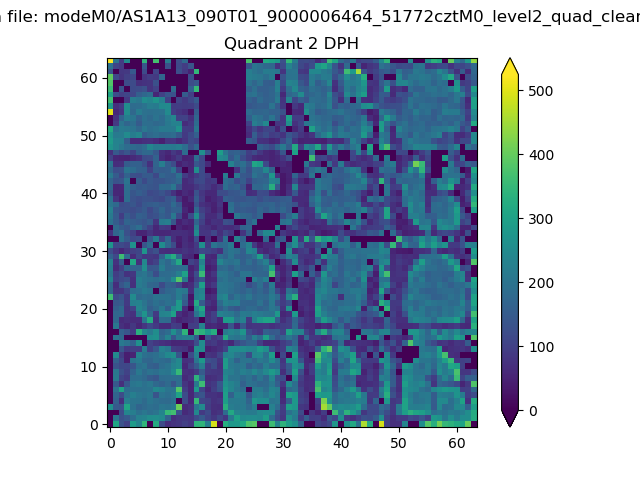
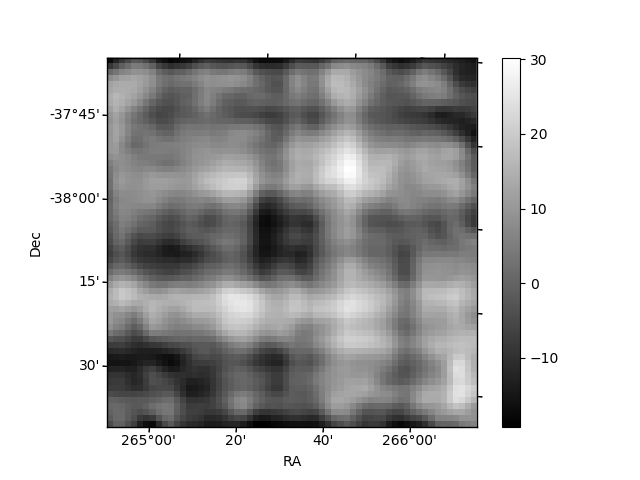
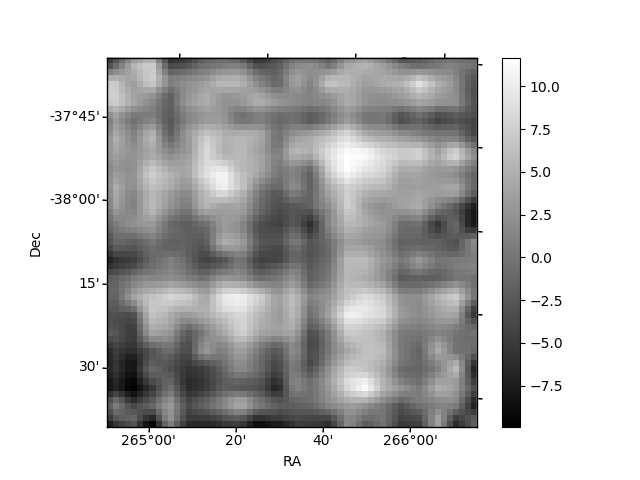
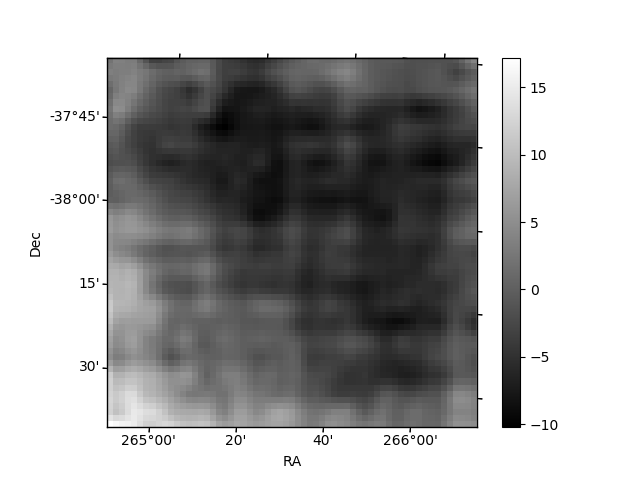
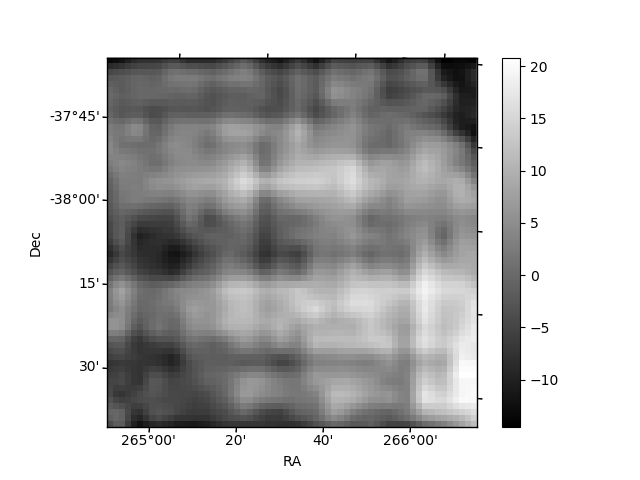
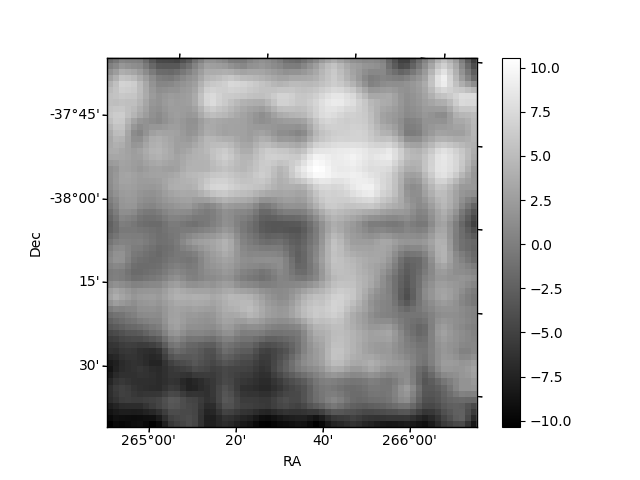
Histogram calculated using DETX and DETY for each event in the final _common_clean file
| Quadrant A | 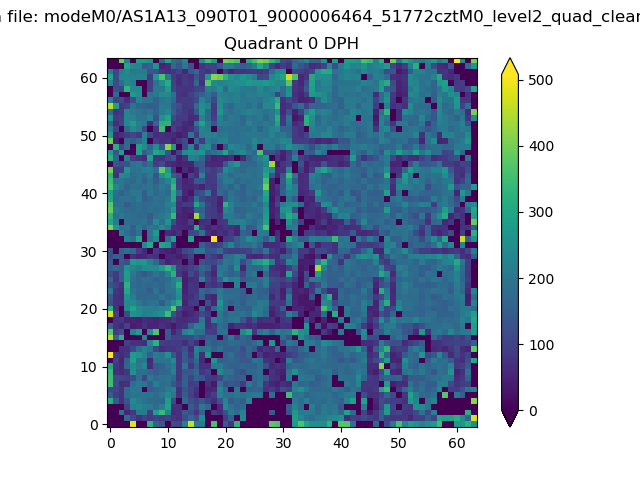 |
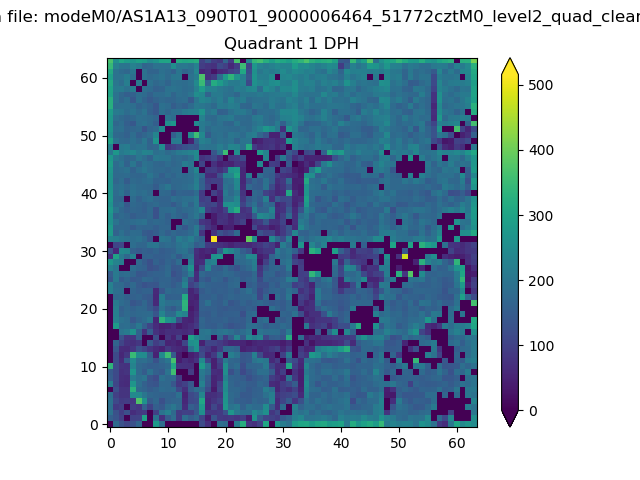 |
Quadrant B |
|---|---|---|---|
| Quadrant D | 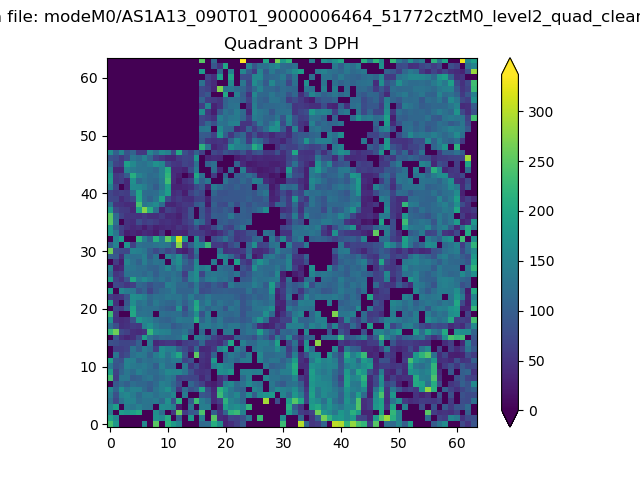 |
 |
Quadrant C |
| Plot type | Count rate plots | Images |
|---|---|---|
| Comparison with Poisson distribution Blue bars denote a histogram of data divided into 1 sec bins. Red curve is a Poisson curve with rate = median count rate of data. |
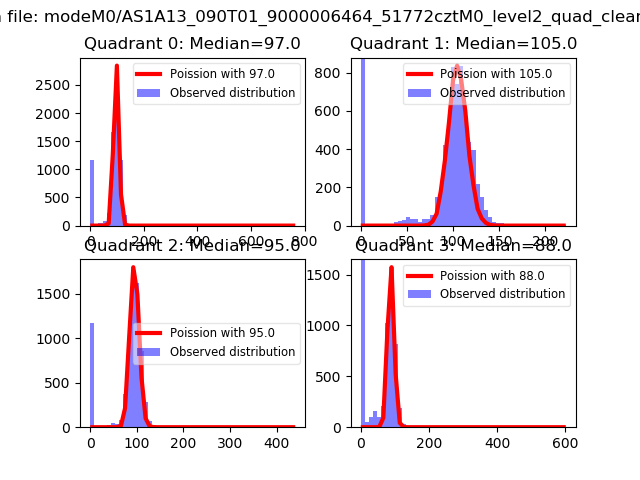 |
 |
| Quadrant-wise count rates Data is divided into 100 sec bins |
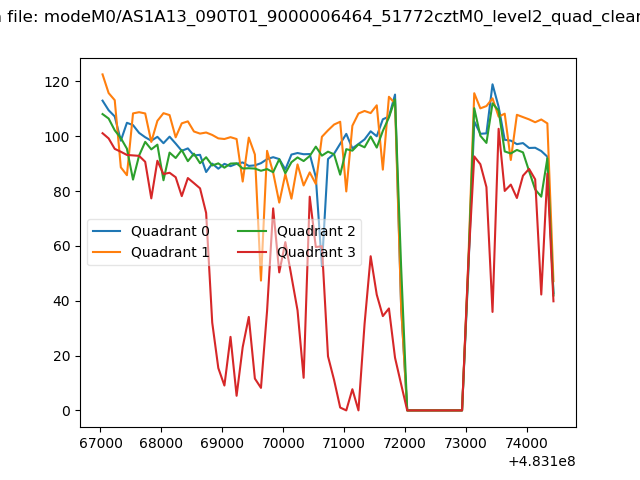 |
|
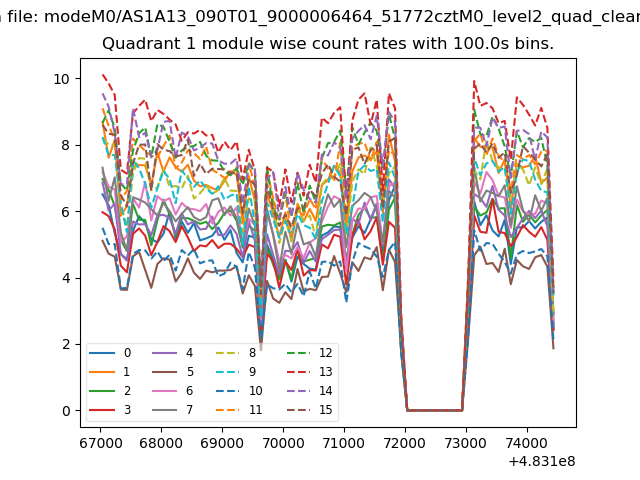
| Module-wise count rates for Quadrant A Data is divided into 100 sec bins |
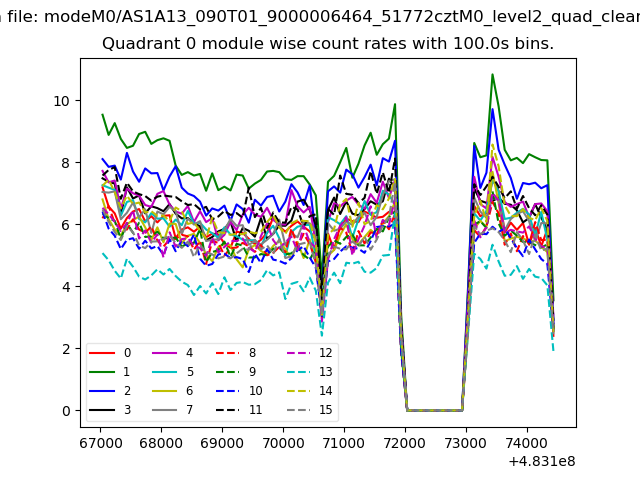 |
 |
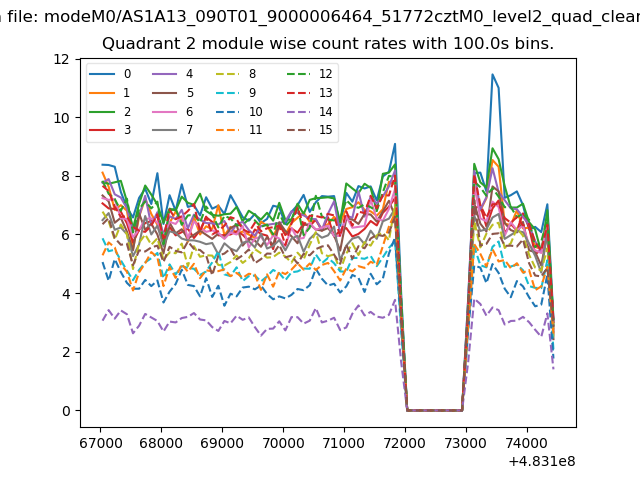
| Module-wise count rates for Quadrant B Data is divided into 100 sec bins |
 |
 |
| Module-wise count rates for Quadrant C Data is divided into 100 sec bins |
 |
 |
| Module-wise count rates for Quadrant D Data is divided into 100 sec bins |
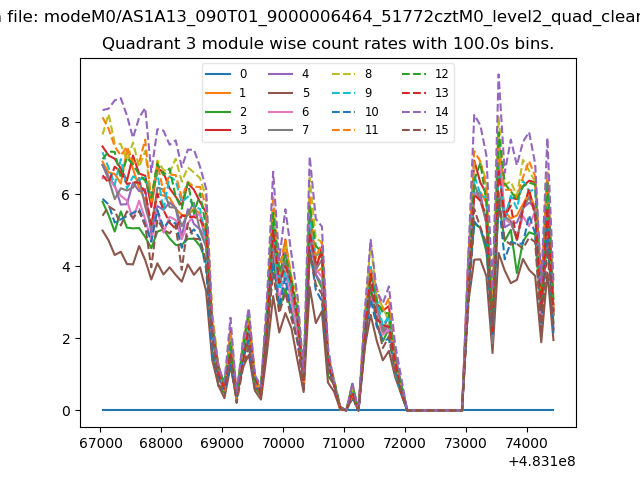 |
 |
| Parameter | Plot |
|---|---|
| CZT HV Monitor | 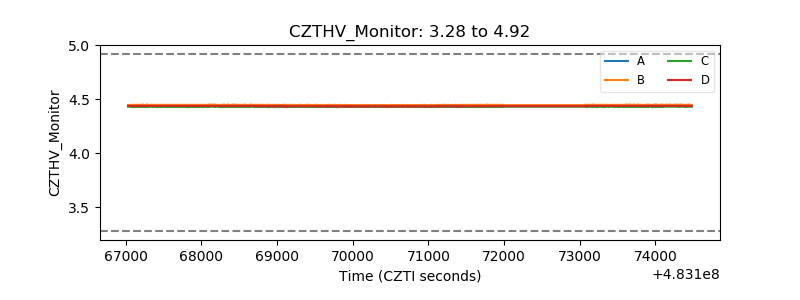 |
| D_VDD | 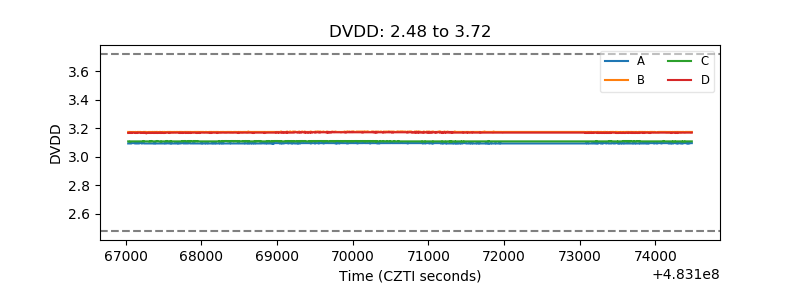 |
| Temperature 1 | 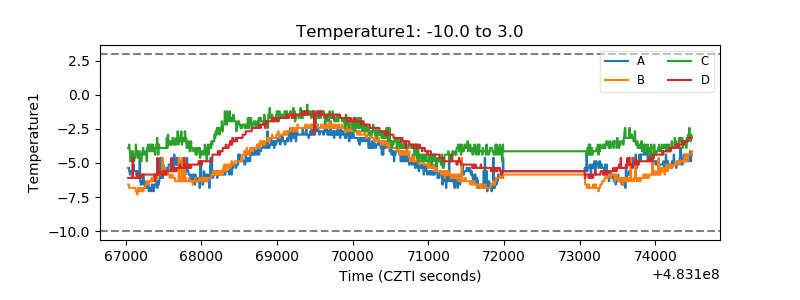 |
| Veto HV Monitor | 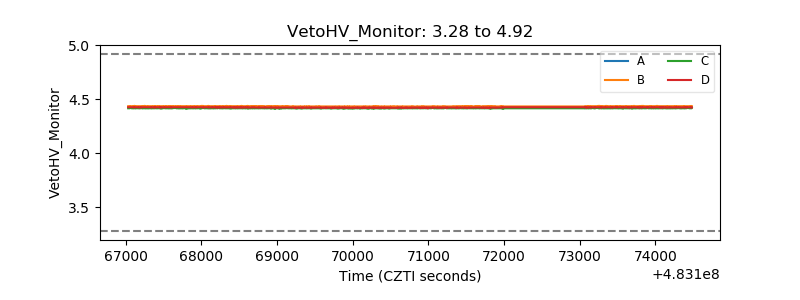 |
| Veto LLD | 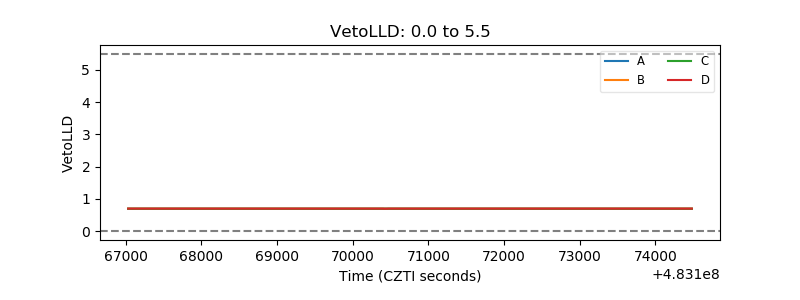 |
| Alpha Counter | 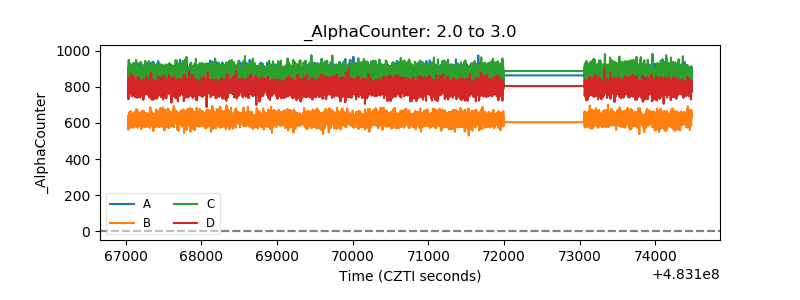 |
| _CPM_Rate | 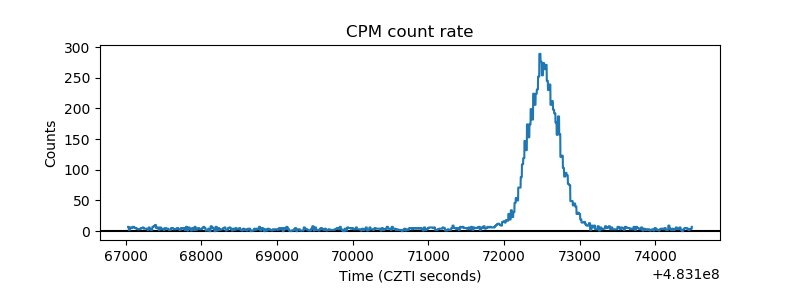 |
| CZT Counter | 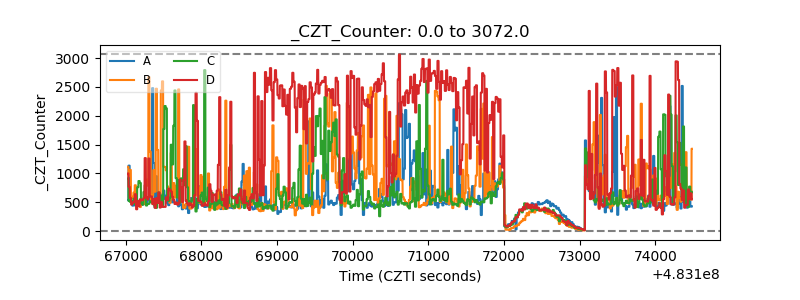 |
| +2.5 Volts monitor | 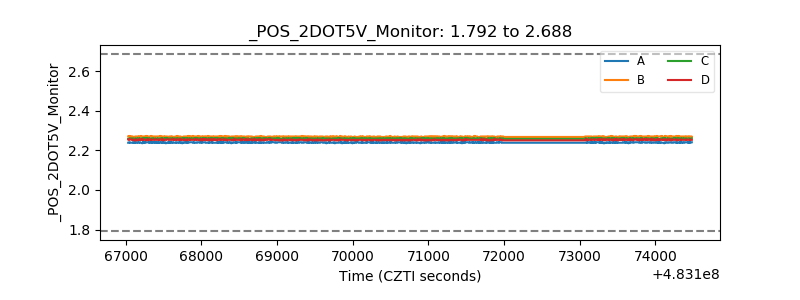 |
| +5 Volts monitor | 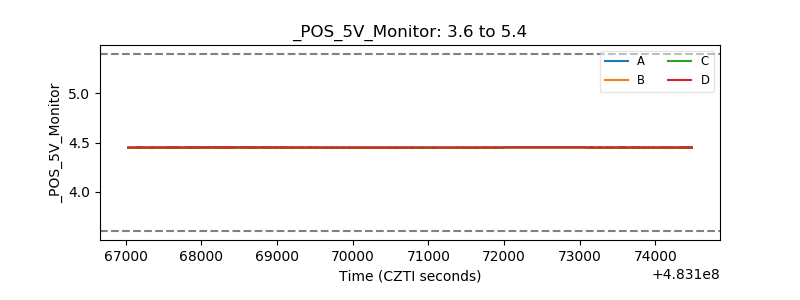 |
| _ROLL_ROT | 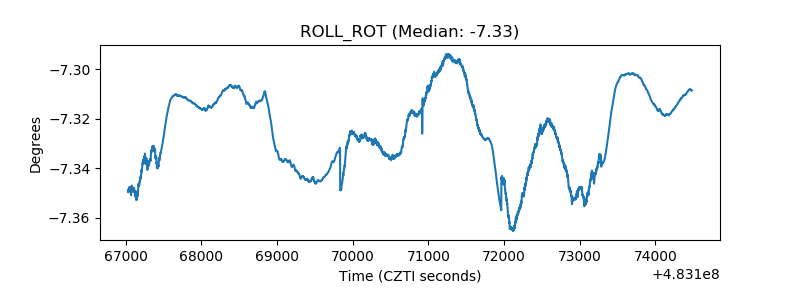 |
| _Roll_DEC | 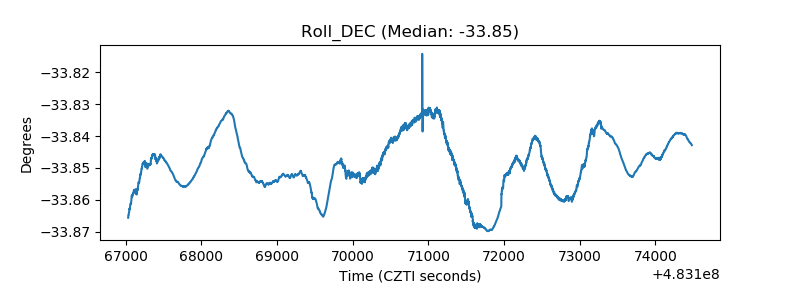 |
| _Roll_RA | 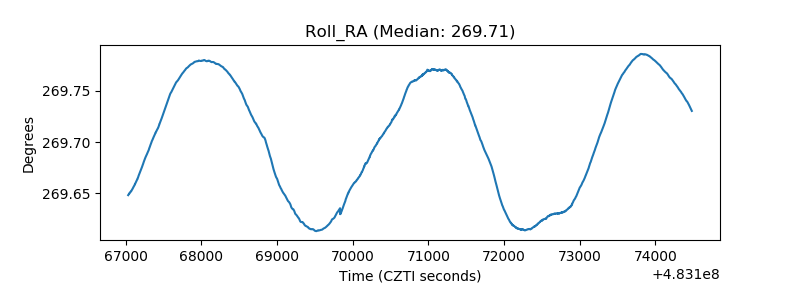 |
| Veto Counter | 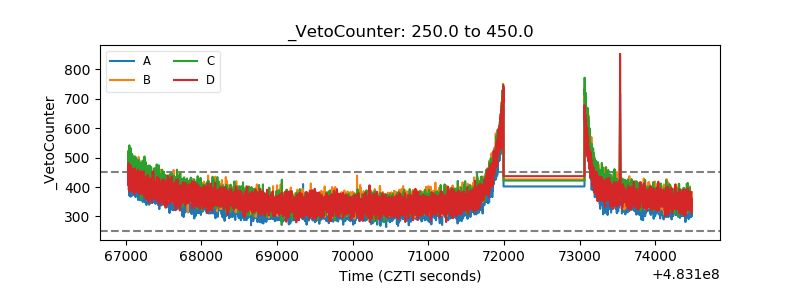 |