| Param | Original file | Final file |
|---|---|---|
| Filename | modeM0/AS1A13_090T01_9000006464_51773cztM0_level2.fits | modeM0/AS1A13_090T01_9000006464_51773cztM0_level2_quad_clean.evt |
| Size (bytes) | 683,838,720 | 87,739,200 |
| Size | 652.2 MB | 83.7 MB |
| Events in quadrant A | 4,673,725 | 599,992 |
| Events in quadrant B | 5,430,650 | 659,188 |
| Events in quadrant C | 3,998,293 | 614,257 |
| Events in quadrant D | 10,691,978 | 317,472 |
| Mode M9 | |||
|---|---|---|---|
| Quadrant | BADHDUFLAG | Total packets | Discarded packets |
| A | 0 | 9 | 0 |
| B | 0 | 9 | 0 |
| C | 0 | 9 | 0 |
| D | 0 | 9 | 0 |
| Mode SS | |||
|---|---|---|---|
| Quadrant | BADHDUFLAG | Total packets | Discarded packets |
| A | 0 | 134 | 0 |
| B | 0 | 134 | 0 |
| C | 0 | 134 | 0 |
| D | 0 | 134 | 0 |
| Mode M0 | |||
|---|---|---|---|
| Quadrant | BADHDUFLAG | Total packets | Discarded packets |
| A | 0 | 18412 | 1 |
| B | 0 | 20732 | 1 |
| C | 0 | 16302 | 1 |
| D | 0 | 36353 | 7 |
| Quadrant | Total seconds | Saturated seconds | Saturation percentage |
|---|---|---|---|
| A | 6684 | 530 | 7.929384% |
| B | 6684 | 512 | 7.660084% |
| C | 6684 | 189 | 2.827648% |
| D | 6683 | 3348 | 50.097262% |
Noise dominated data is calculated using 1-second bins in cleaned event files. If a bin has >2000 counts, and if more than 50% of those come from <1% of pixels, then it is considered to be noise-dominated and hence unusable.
| Quadrant | # 1 sec bins | Bins with >0 counts | Bins with >2000 counts | High rate bins dominated by noise | Noise dominated (total time) | Noise dominated (detector-on time) | Marked lightcurve |
|---|---|---|---|---|---|---|---|
| A | 7529 | 6684 | 253 | 253 | 3.36% | 3.79% | 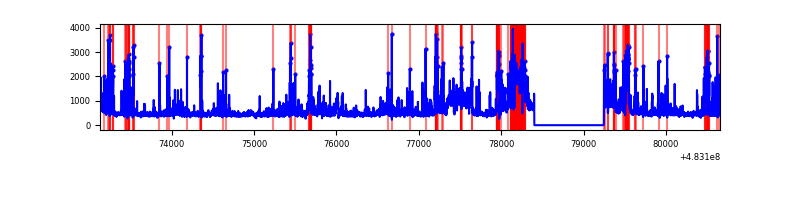 |
| B | 7529 | 6685 | 261 | 261 | 3.47% | 3.90% | 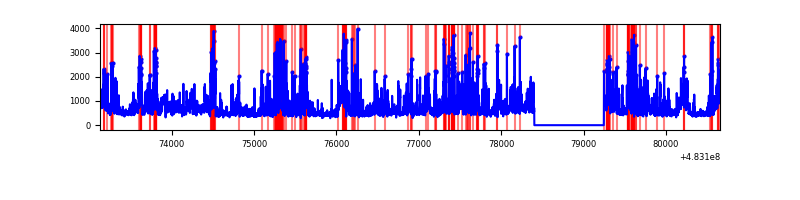 |
| C | 7529 | 6685 | 93 | 93 | 1.24% | 1.39% | 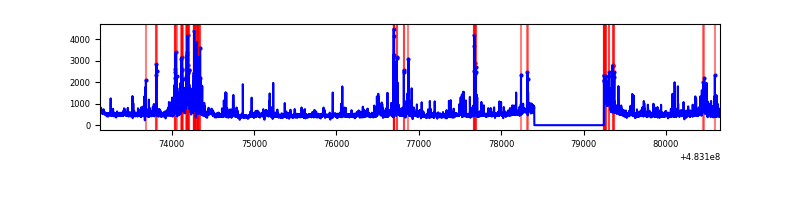 |
| D | 7528 | 6683 | 2601 | 2601 | 34.55% | 38.92% | 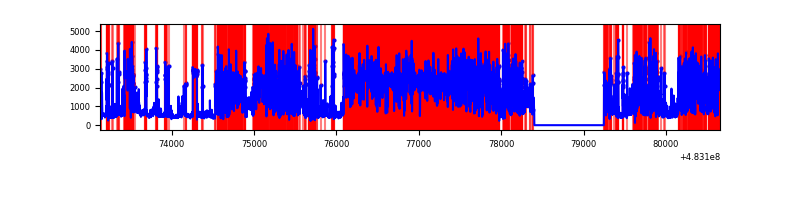 |
Top three noisy pixels from each quadrant. If the there are fewer than three noisy pixels in the level2.evt file, extra rows are filled as -1
| Pixel properties | Quadrant properties | ||||||
|---|---|---|---|---|---|---|---|
| Quadrant | DetID | PixID | Counts | Sigma | Mean | Median | Sigma |
| A | 15 | 174 | 658638 | 3791.37 | 713 | 697 | 173.5 |
| A | 2 | 143 | 345671 | 1987.9 | 713 | 697 | 173.5 |
| A | 12 | 3 | 206136 | 1183.84 | 713 | 697 | 173.5 |
| B | 4 | 206 | 1852616 | 12024.47 | 714 | 687 | 154.0 |
| B | 1 | 239 | 240767 | 1558.83 | 714 | 687 | 154.0 |
| B | 9 | 223 | 105703 | 681.86 | 714 | 687 | 154.0 |
| C | 15 | 218 | 452842 | 2309.38 | 720 | 715 | 195.8 |
| C | 9 | 38 | 215956 | 1099.41 | 720 | 715 | 195.8 |
| C | 15 | 224 | 114417 | 580.77 | 720 | 715 | 195.8 |
| D | 11 | 129 | 8270983 | 58807.75 | 506 | 489 | 140.6 |
| D | 7 | 222 | 120599 | 854.05 | 506 | 489 | 140.6 |
| D | 0 | 18 | 74291 | 524.77 | 506 | 489 | 140.6 |
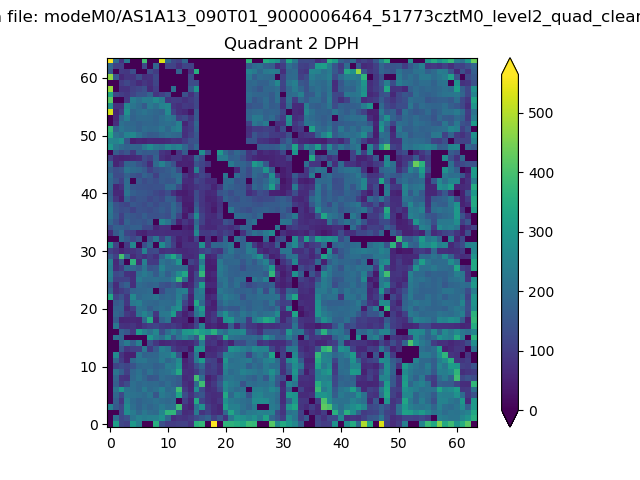
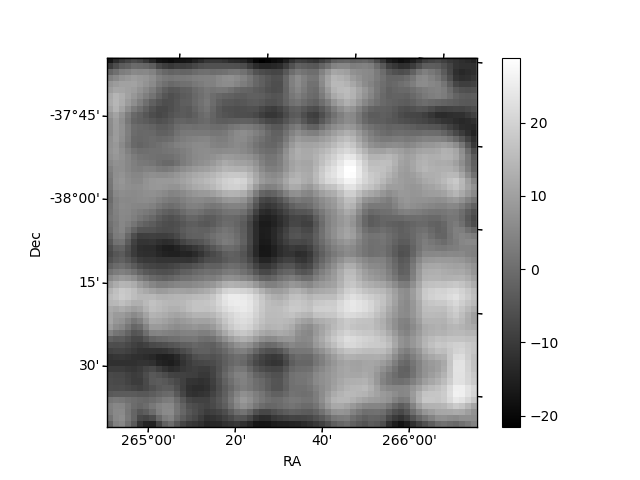
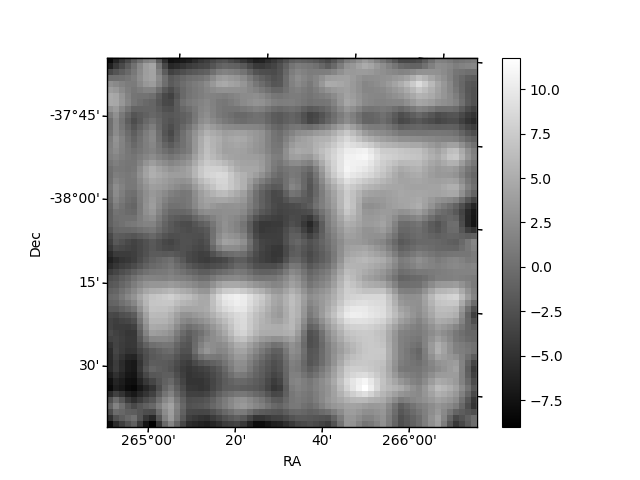
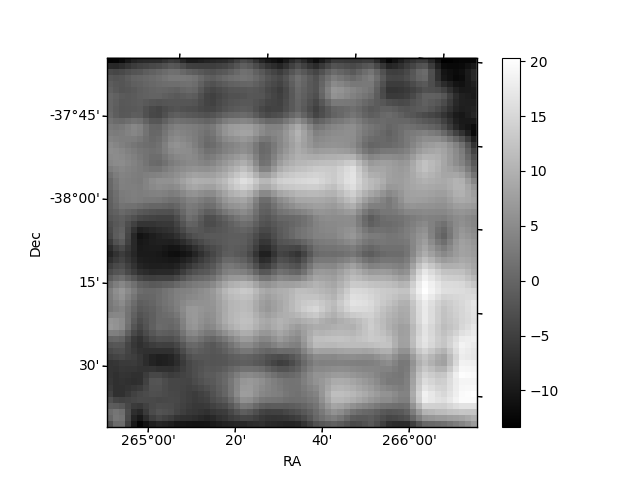
Histogram calculated using DETX and DETY for each event in the final _common_clean file
| Quadrant A | 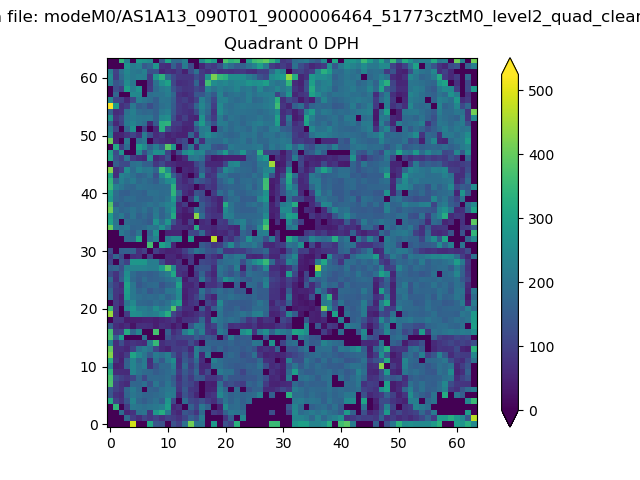 |
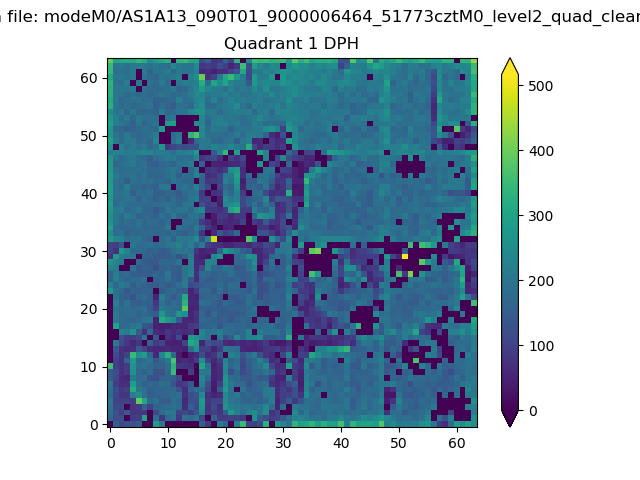 |
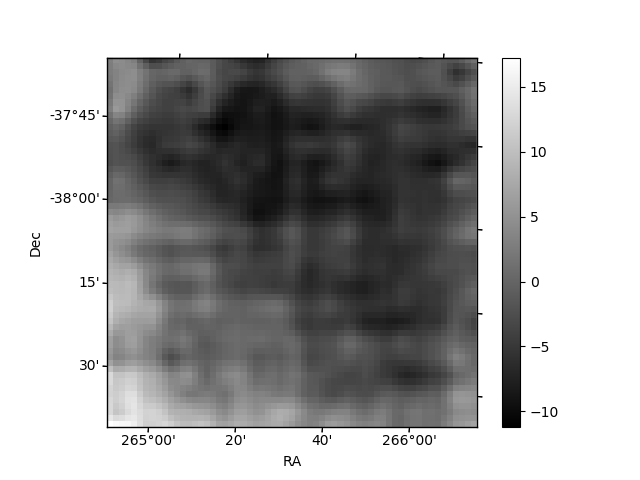
Quadrant B |
|---|---|---|---|
| Quadrant D | 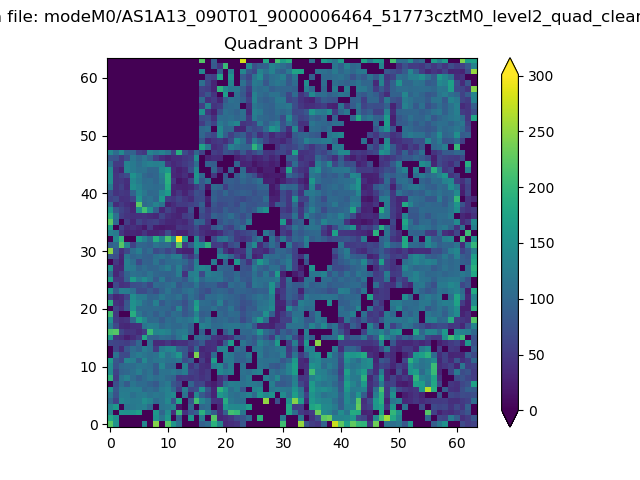 |
 |
Quadrant C |
| Plot type | Count rate plots | Images |
|---|---|---|
| Comparison with Poisson distribution Blue bars denote a histogram of data divided into 1 sec bins. Red curve is a Poisson curve with rate = median count rate of data. |
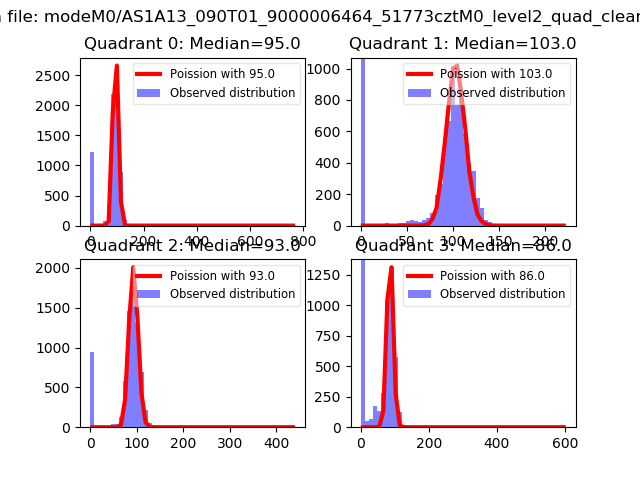 |
 |
| Quadrant-wise count rates Data is divided into 100 sec bins |
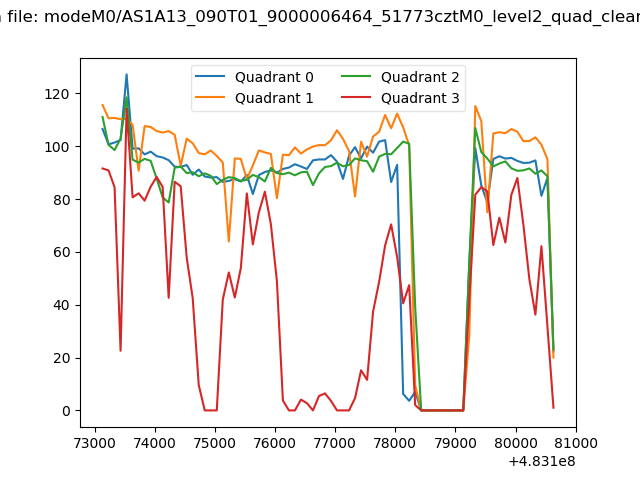 |
|
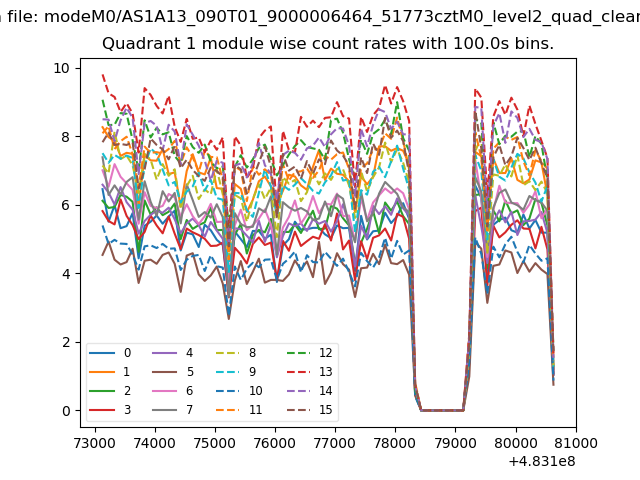
| Module-wise count rates for Quadrant A Data is divided into 100 sec bins |
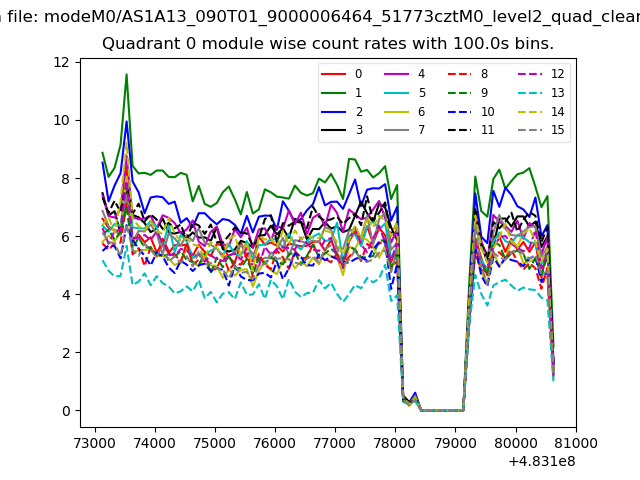 |
 |
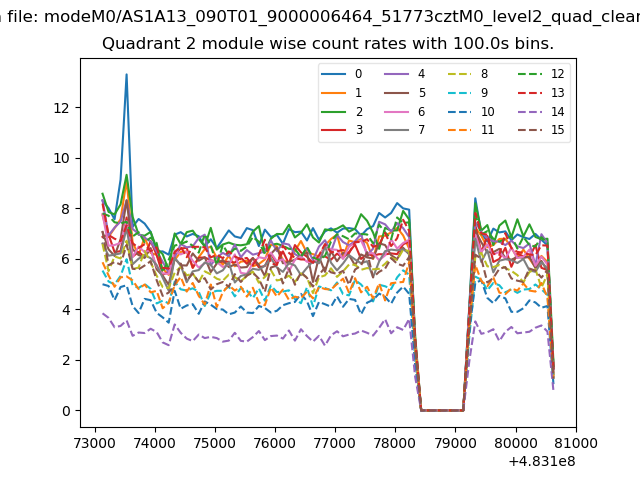
| Module-wise count rates for Quadrant B Data is divided into 100 sec bins |
 |
 |
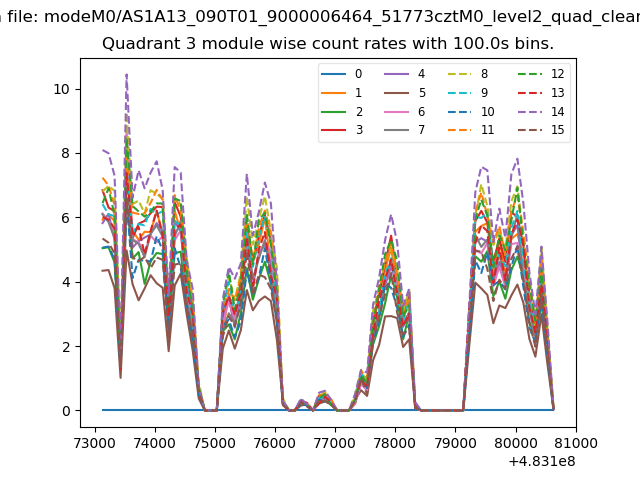
| Module-wise count rates for Quadrant C Data is divided into 100 sec bins |
 |
 |
| Module-wise count rates for Quadrant D Data is divided into 100 sec bins |
 |
 |
| Parameter | Plot |
|---|---|
| CZT HV Monitor | 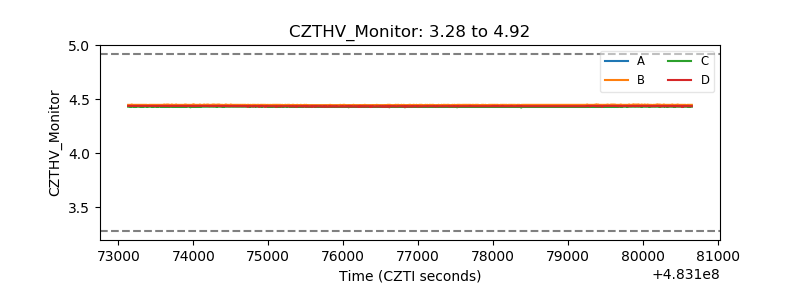 |
| D_VDD | 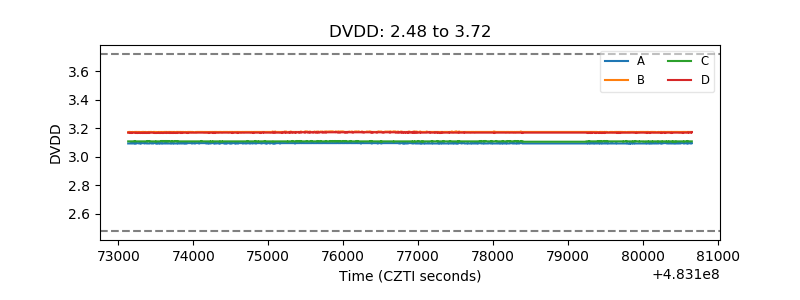 |
| Temperature 1 | 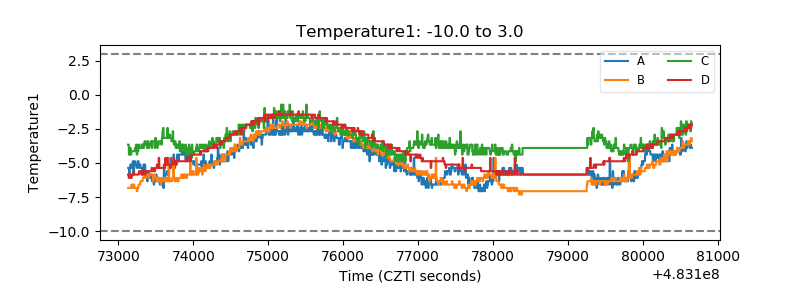 |
| Veto HV Monitor | 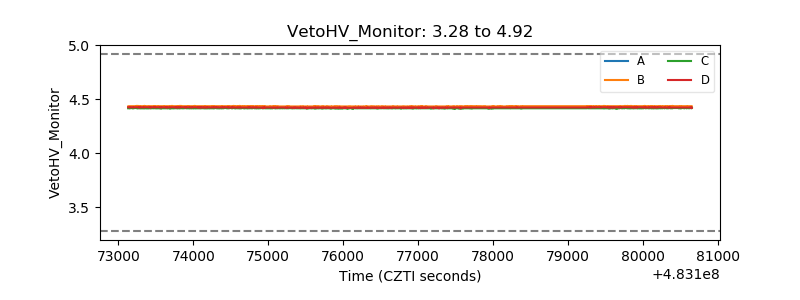 |
| Veto LLD | 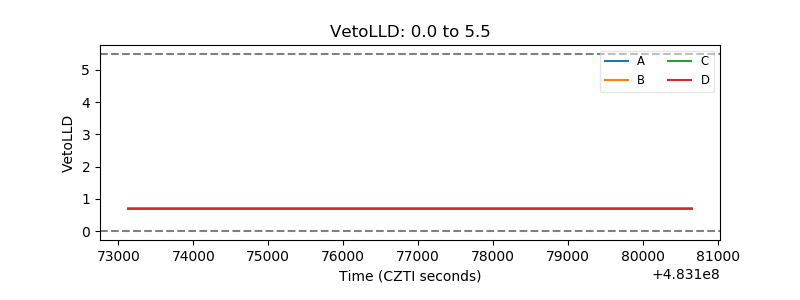 |
| Alpha Counter | 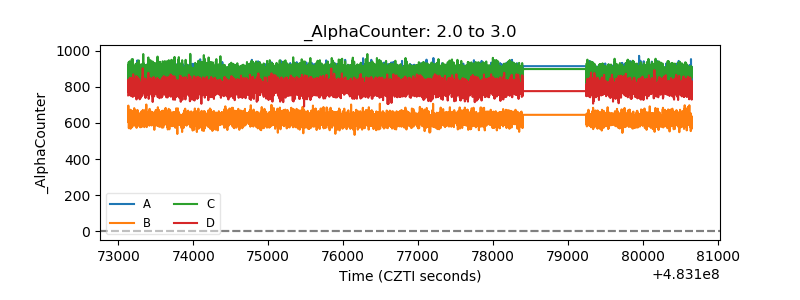 |
| _CPM_Rate | 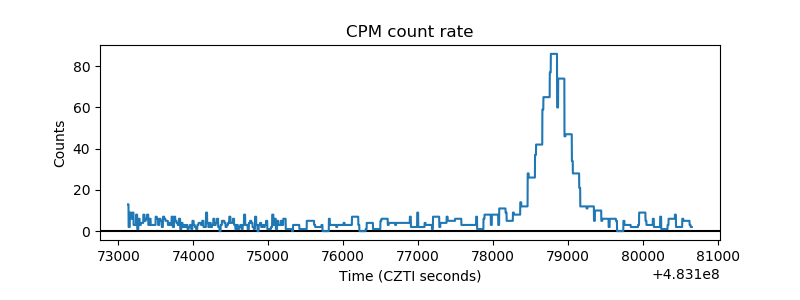 |
| CZT Counter | 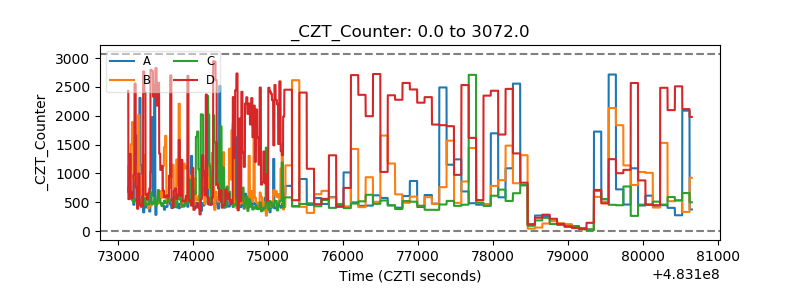 |
| +2.5 Volts monitor | 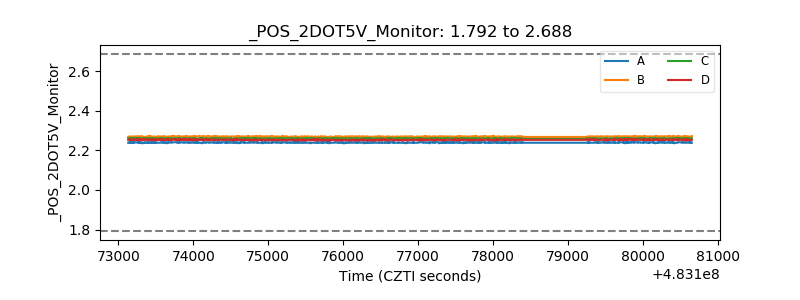 |
| +5 Volts monitor | 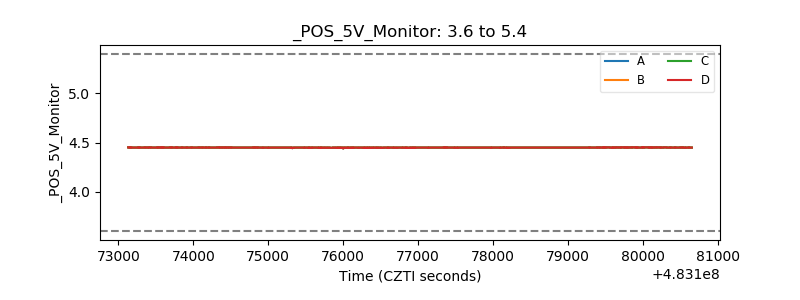 |
| _ROLL_ROT | 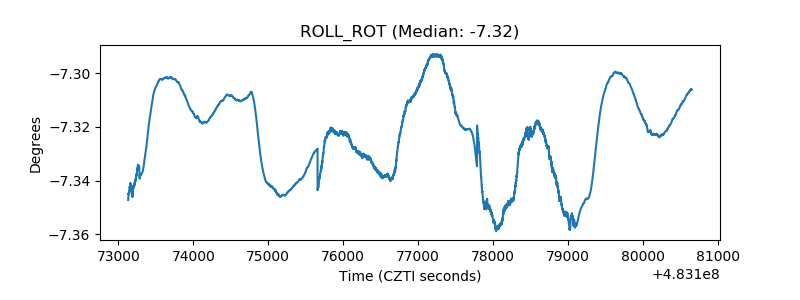 |
| _Roll_DEC | 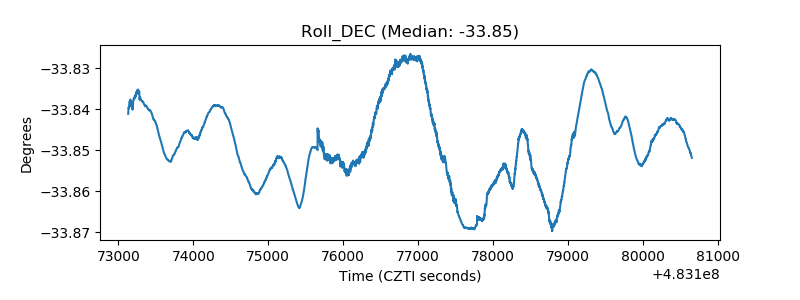 |
| _Roll_RA | 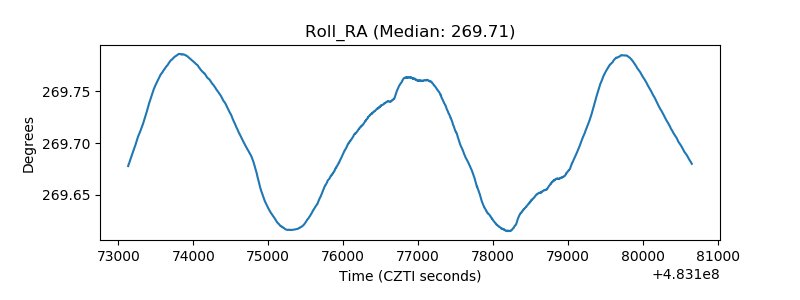 |
| Veto Counter | 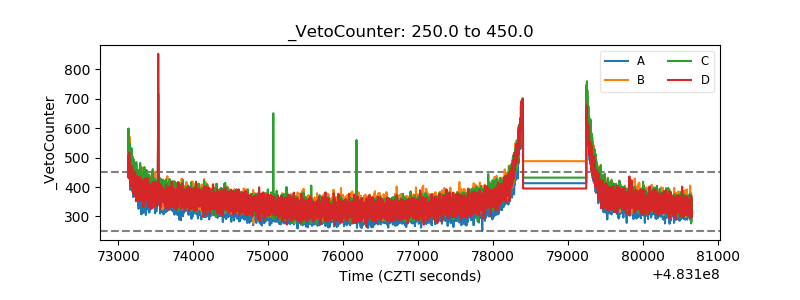 |