| Param | Original file | Final file |
|---|---|---|
| Filename | modeM0/AS1A13_090T01_9000006464_51774cztM0_level2.fits | modeM0/AS1A13_090T01_9000006464_51774cztM0_level2_quad_clean.evt |
| Size (bytes) | 770,650,560 | 100,863,360 |
| Size | 734.9 MB | 96.2 MB |
| Events in quadrant A | 5,737,595 | 673,457 |
| Events in quadrant B | 5,595,120 | 735,665 |
| Events in quadrant C | 4,723,581 | 679,607 |
| Events in quadrant D | 11,873,443 | 429,540 |
| Mode M9 | |||
|---|---|---|---|
| Quadrant | BADHDUFLAG | Total packets | Discarded packets |
| A | 0 | 4 | 0 |
| B | 0 | 4 | 0 |
| C | 0 | 4 | 0 |
| D | 0 | 4 | 0 |
| Mode SS | |||
|---|---|---|---|
| Quadrant | BADHDUFLAG | Total packets | Discarded packets |
| A | 0 | 154 | 0 |
| B | 0 | 154 | 0 |
| C | 0 | 154 | 0 |
| D | 0 | 154 | 0 |
| Mode M0 | |||
|---|---|---|---|
| Quadrant | BADHDUFLAG | Total packets | Discarded packets |
| A | 0 | 22311 | 2 |
| B | 0 | 21921 | 2 |
| C | 0 | 19121 | 2 |
| D | 0 | 40606 | 2 |
| Quadrant | Total seconds | Saturated seconds | Saturation percentage |
|---|---|---|---|
| A | 7706 | 658 | 8.538801% |
| B | 7707 | 658 | 8.537693% |
| C | 7706 | 392 | 5.086945% |
| D | 7706 | 3070 | 39.839086% |
Noise dominated data is calculated using 1-second bins in cleaned event files. If a bin has >2000 counts, and if more than 50% of those come from <1% of pixels, then it is considered to be noise-dominated and hence unusable.
| Quadrant | # 1 sec bins | Bins with >0 counts | Bins with >2000 counts | High rate bins dominated by noise | Noise dominated (total time) | Noise dominated (detector-on time) | Marked lightcurve |
|---|---|---|---|---|---|---|---|
| A | 8056 | 7706 | 269 | 269 | 3.34% | 3.49% | 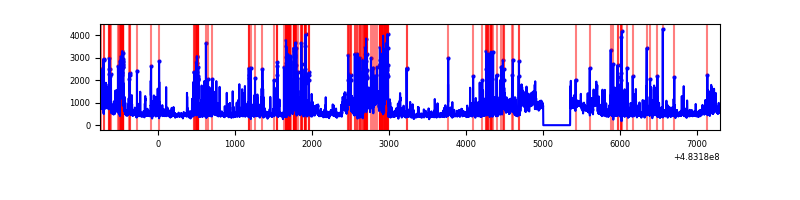 |
| B | 8057 | 7708 | 245 | 245 | 3.04% | 3.18% | 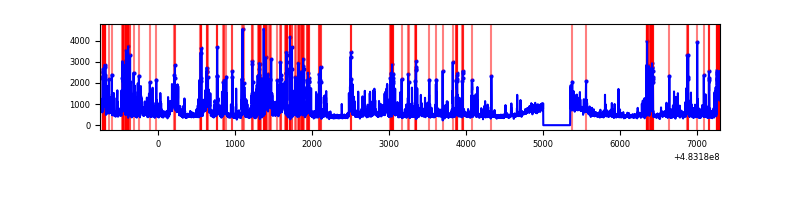 |
| C | 8056 | 7707 | 162 | 162 | 2.01% | 2.10% | 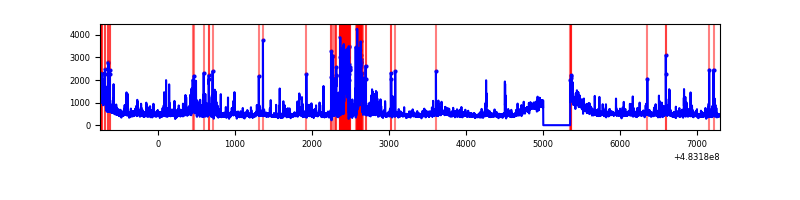 |
| D | 8056 | 7707 | 2412 | 2412 | 29.94% | 31.30% | 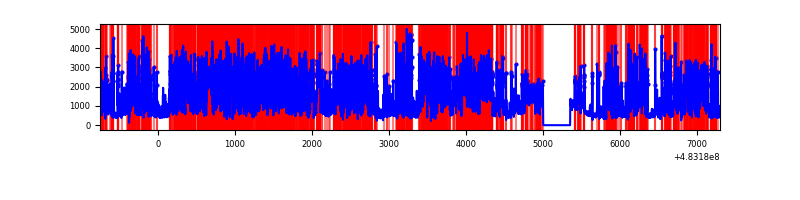 |
Top three noisy pixels from each quadrant. If the there are fewer than three noisy pixels in the level2.evt file, extra rows are filled as -1
| Pixel properties | Quadrant properties | ||||||
|---|---|---|---|---|---|---|---|
| Quadrant | DetID | PixID | Counts | Sigma | Mean | Median | Sigma |
| A | 2 | 143 | 583692 | 2840.15 | 852 | 833 | 205.2 |
| A | 12 | 3 | 452786 | 2202.28 | 852 | 833 | 205.2 |
| A | 15 | 174 | 313350 | 1522.83 | 852 | 833 | 205.2 |
| B | 4 | 206 | 1277329 | 7025.56 | 843 | 811 | 181.7 |
| B | 1 | 239 | 178419 | 977.5 | 843 | 811 | 181.7 |
| B | 4 | 174 | 163744 | 896.73 | 843 | 811 | 181.7 |
| C | 15 | 218 | 476626 | 2103.97 | 838 | 835 | 226.1 |
| C | 9 | 38 | 246043 | 1084.32 | 838 | 835 | 226.1 |
| C | 12 | 254 | 188047 | 827.86 | 838 | 835 | 226.1 |
| D | 11 | 129 | 7812077 | 40212.68 | 698 | 675 | 194.3 |
| D | 8 | 48 | 702906 | 3615.05 | 698 | 675 | 194.3 |
| D | 0 | 18 | 168296 | 862.9 | 698 | 675 | 194.3 |
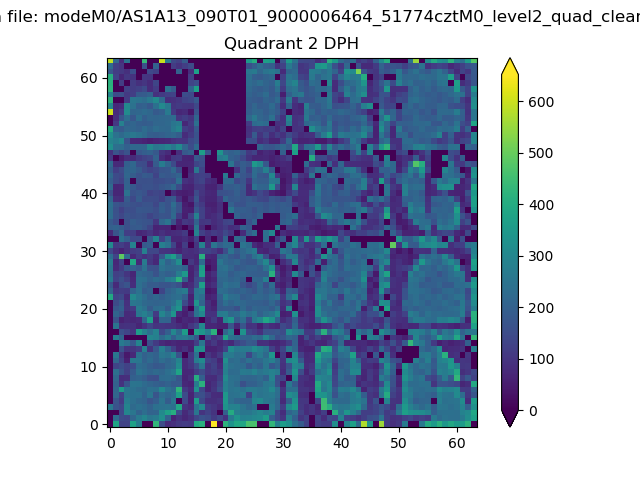
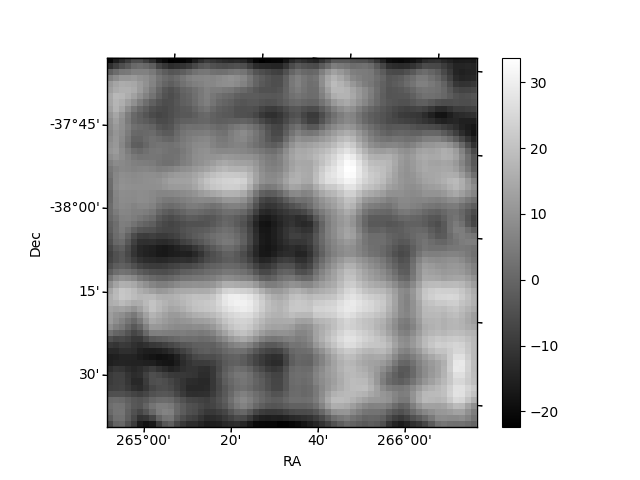
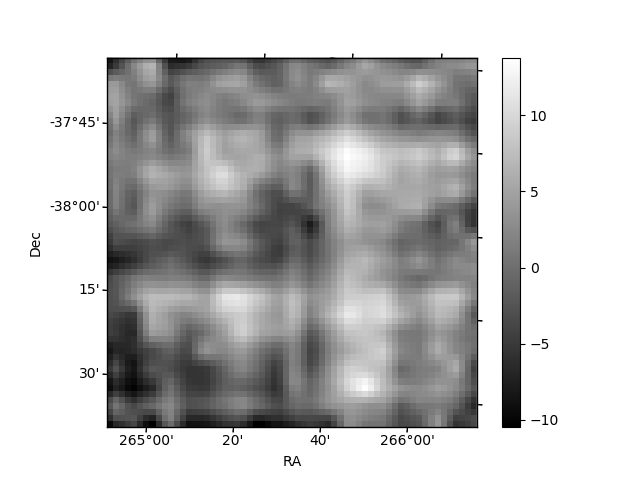
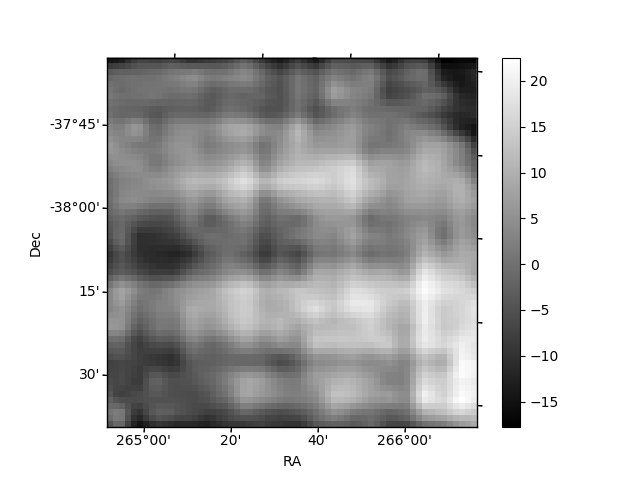
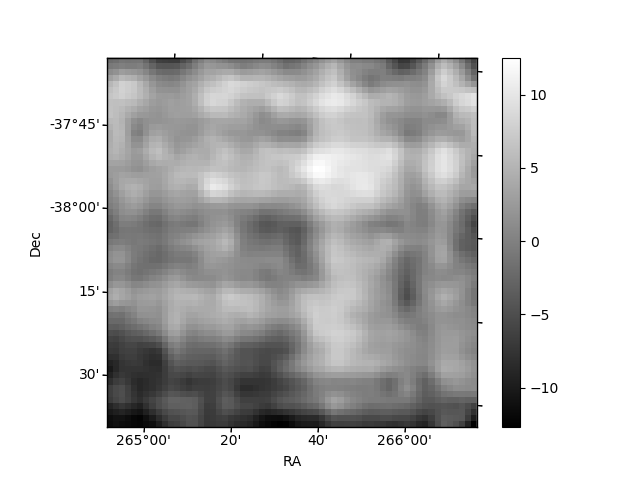
Histogram calculated using DETX and DETY for each event in the final _common_clean file
| Quadrant A | 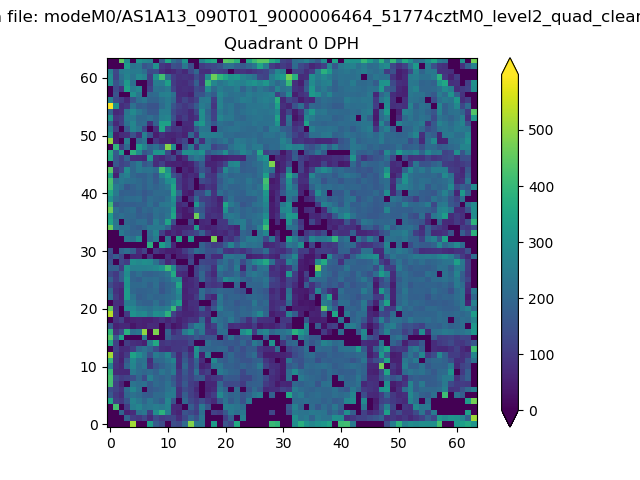 |
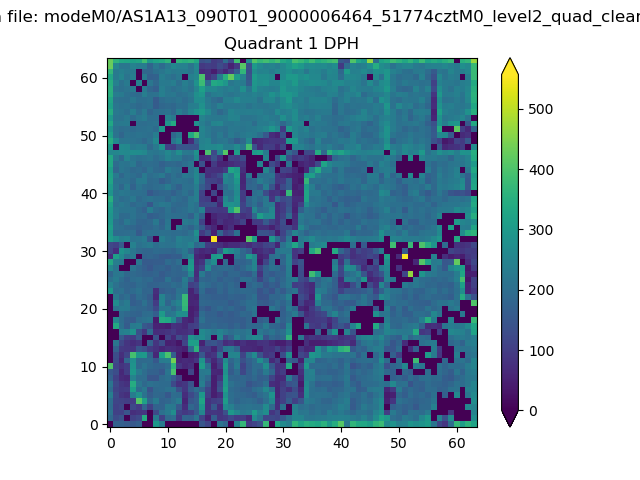 |
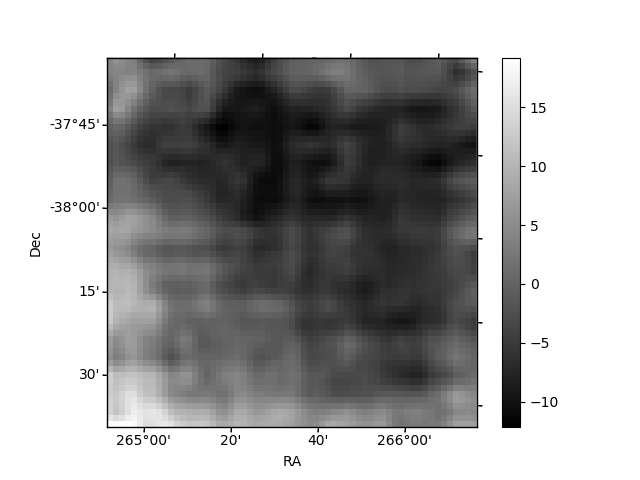
Quadrant B |
|---|---|---|---|
| Quadrant D | 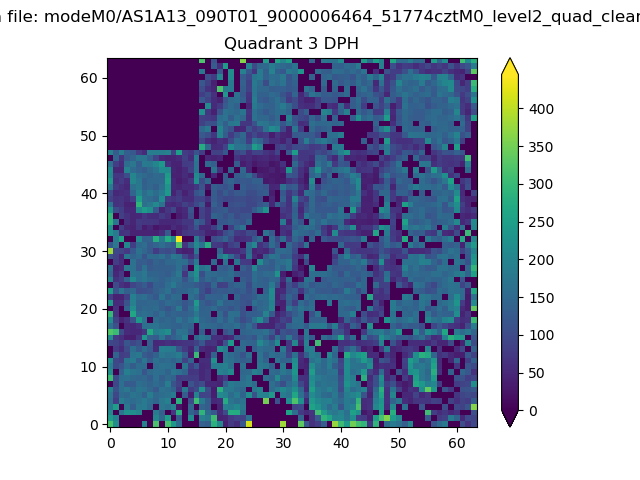 |
 |
Quadrant C |
| Plot type | Count rate plots | Images |
|---|---|---|
| Comparison with Poisson distribution Blue bars denote a histogram of data divided into 1 sec bins. Red curve is a Poisson curve with rate = median count rate of data. |
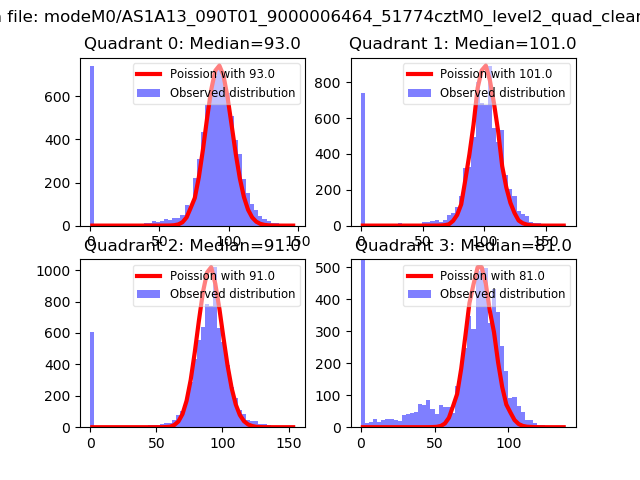 |
 |
| Quadrant-wise count rates Data is divided into 100 sec bins |
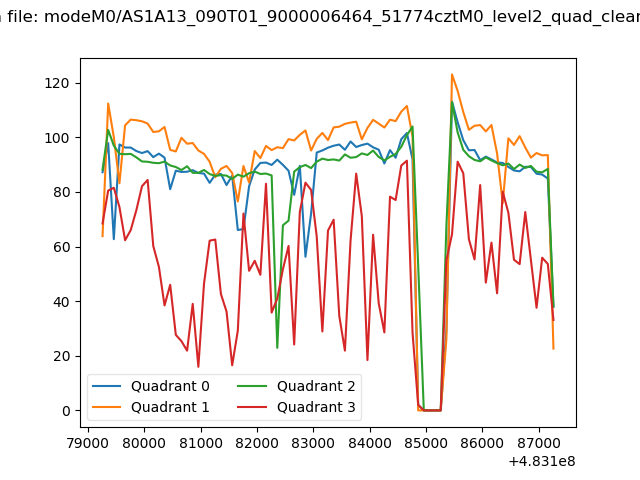 |
|
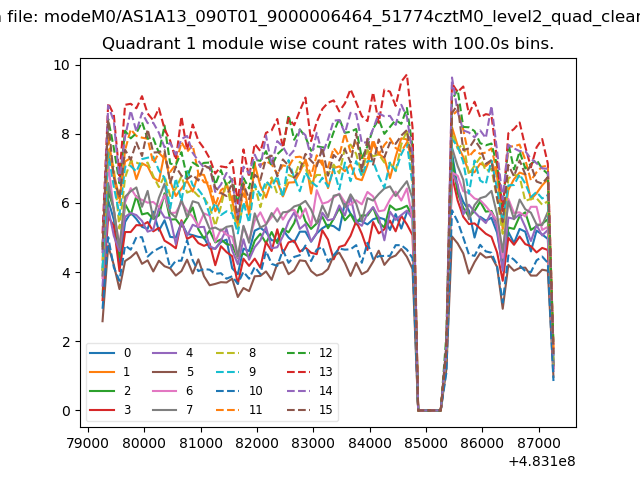
| Module-wise count rates for Quadrant A Data is divided into 100 sec bins |
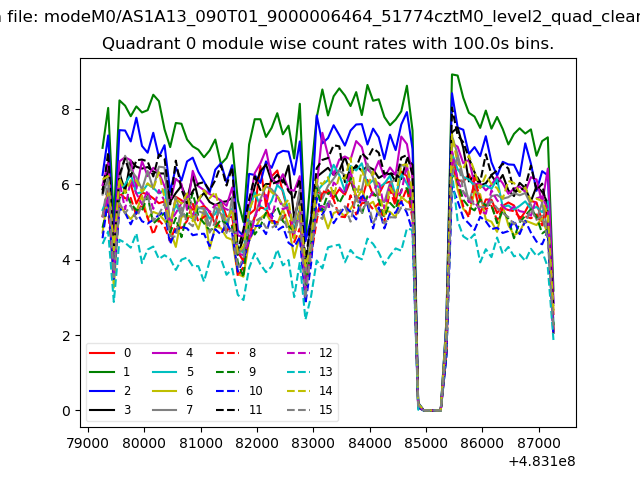 |
 |
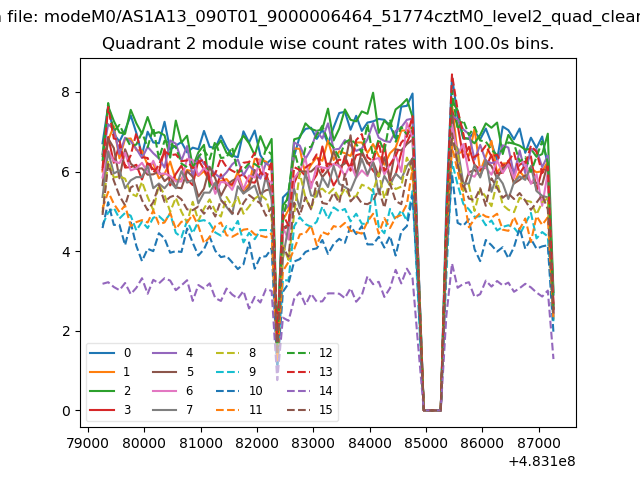
| Module-wise count rates for Quadrant B Data is divided into 100 sec bins |
 |
 |
| Module-wise count rates for Quadrant C Data is divided into 100 sec bins |
 |
 |
| Module-wise count rates for Quadrant D Data is divided into 100 sec bins |
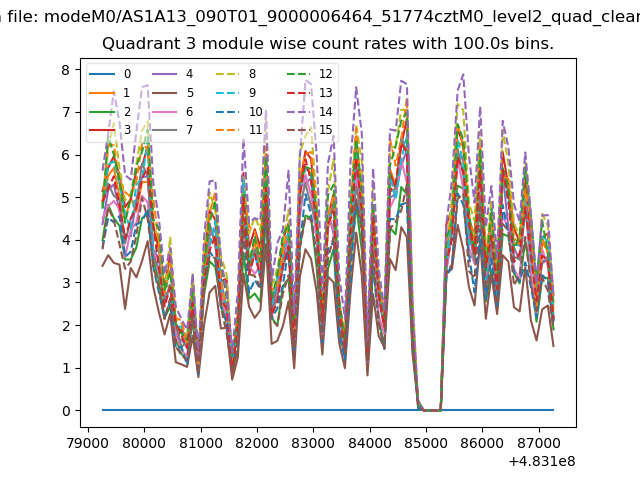 |
 |
| Parameter | Plot |
|---|---|
| CZT HV Monitor | 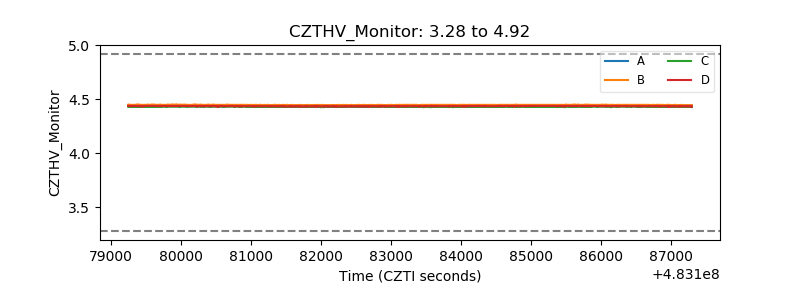 |
| D_VDD | 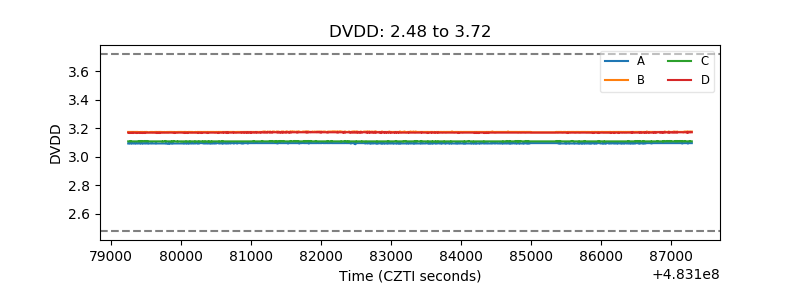 |
| Temperature 1 | 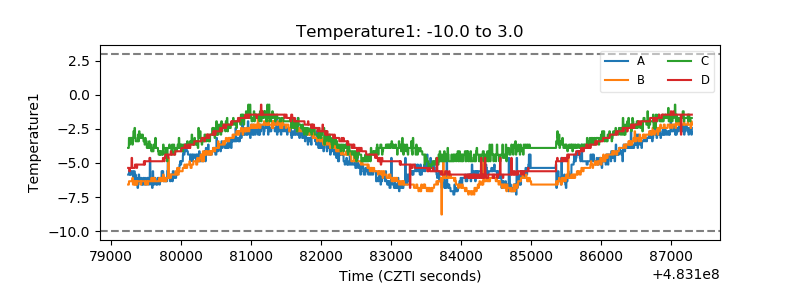 |
| Veto HV Monitor | 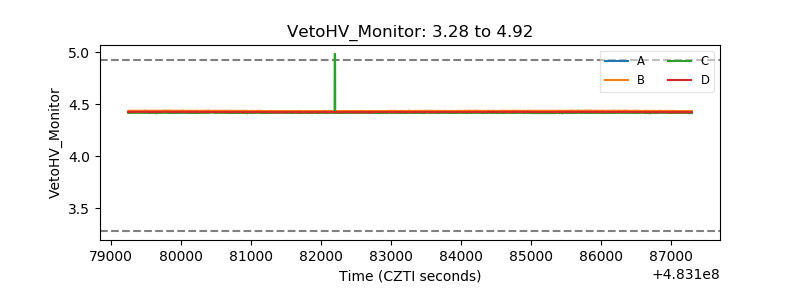 |
| Veto LLD | 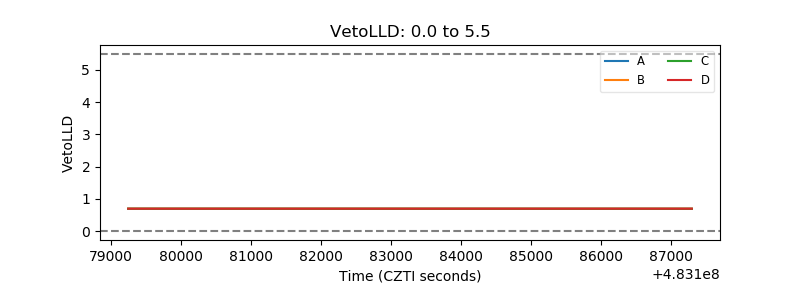 |
| Alpha Counter | 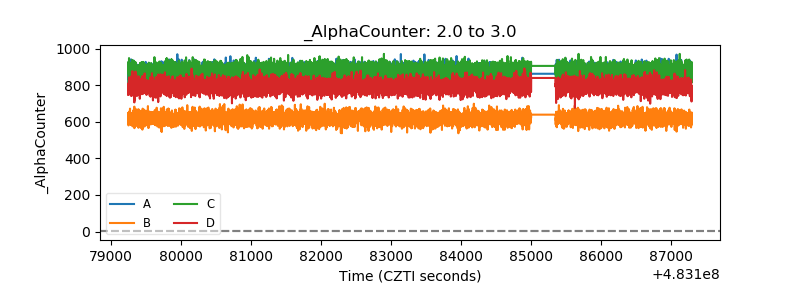 |
| _CPM_Rate | 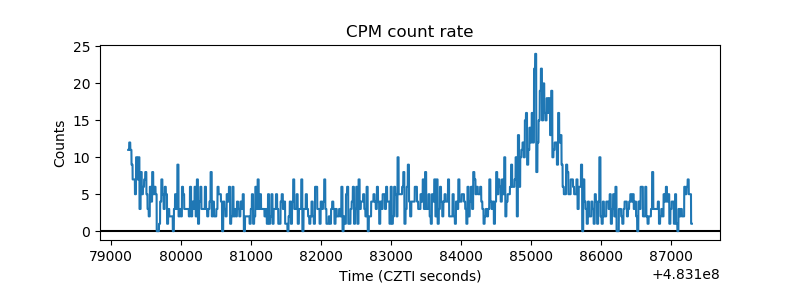 |
| CZT Counter | 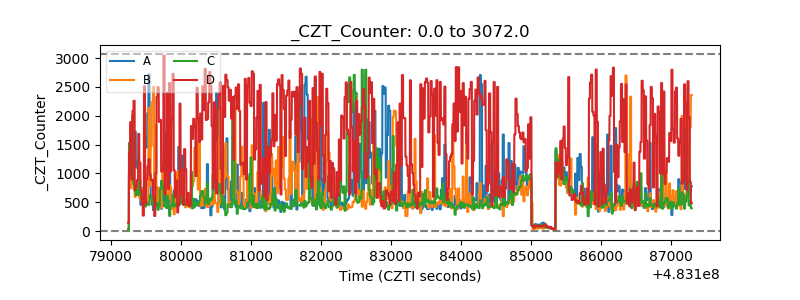 |
| +2.5 Volts monitor | 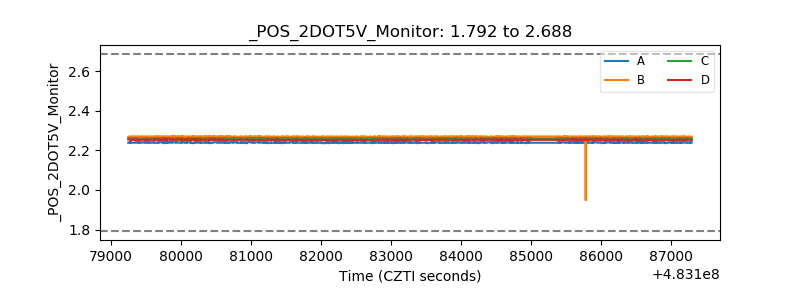 |
| +5 Volts monitor | 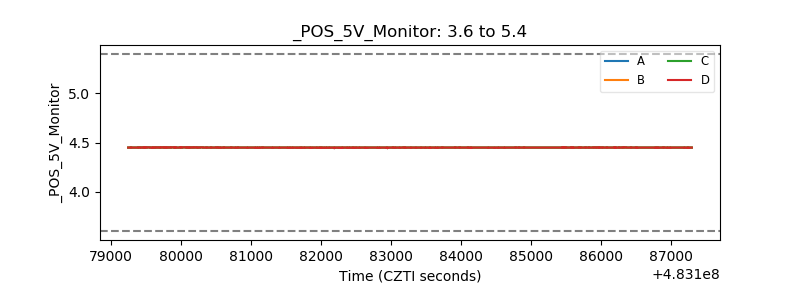 |
| _ROLL_ROT | 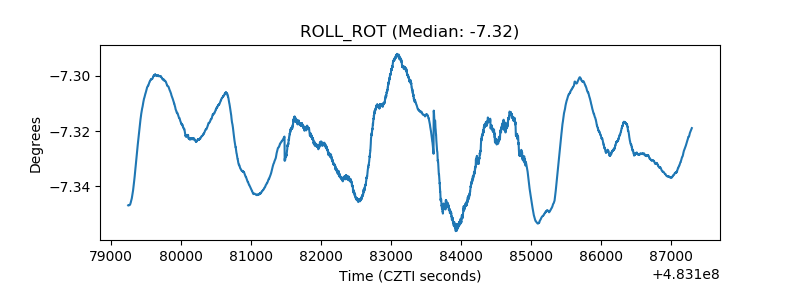 |
| _Roll_DEC | 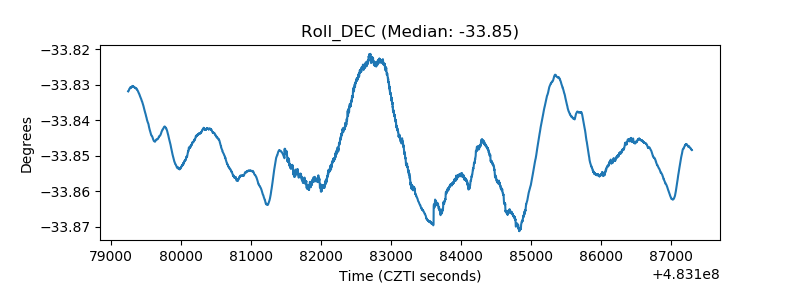 |
| _Roll_RA | 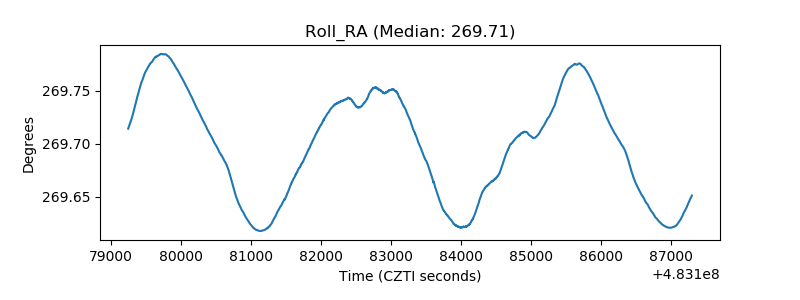 |
| Veto Counter | 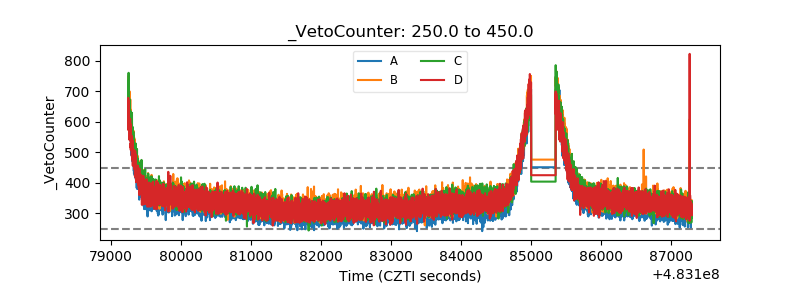 |