| Param | Original file | Final file |
|---|---|---|
| Filename | modeM0/AS1A13_090T01_9000006464_51775cztM0_level2.fits | modeM0/AS1A13_090T01_9000006464_51775cztM0_level2_quad_clean.evt |
| Size (bytes) | 763,905,600 | 99,204,480 |
| Size | 728.5 MB | 94.6 MB |
| Events in quadrant A | 5,740,892 | 696,320 |
| Events in quadrant B | 4,581,327 | 759,121 |
| Events in quadrant C | 5,275,075 | 653,955 |
| Events in quadrant D | 12,090,783 | 365,181 |
| Mode SS | |||
|---|---|---|---|
| Quadrant | BADHDUFLAG | Total packets | Discarded packets |
| A | 0 | 152 | 0 |
| B | 0 | 152 | 0 |
| C | 0 | 152 | 0 |
| D | 0 | 152 | 0 |
| Mode M0 | |||
|---|---|---|---|
| Quadrant | BADHDUFLAG | Total packets | Discarded packets |
| A | 0 | 22209 | 0 |
| B | 0 | 18829 | 1 |
| C | 0 | 20739 | 0 |
| D | 0 | 41149 | 0 |
| Quadrant | Total seconds | Saturated seconds | Saturation percentage |
|---|---|---|---|
| A | 7604 | 246 | 3.235139% |
| B | 7603 | 224 | 2.946205% |
| C | 7604 | 471 | 6.194108% |
| D | 7604 | 3566 | 46.896370% |
Noise dominated data is calculated using 1-second bins in cleaned event files. If a bin has >2000 counts, and if more than 50% of those come from <1% of pixels, then it is considered to be noise-dominated and hence unusable.
| Quadrant | # 1 sec bins | Bins with >0 counts | Bins with >2000 counts | High rate bins dominated by noise | Noise dominated (total time) | Noise dominated (detector-on time) | Marked lightcurve |
|---|---|---|---|---|---|---|---|
| A | 7604 | 7604 | 154 | 154 | 2.03% | 2.03% | 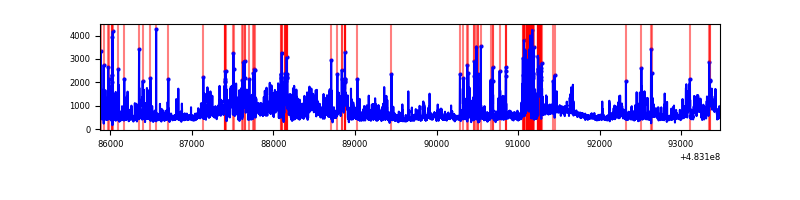 |
| B | 7603 | 7603 | 151 | 151 | 1.99% | 1.99% | 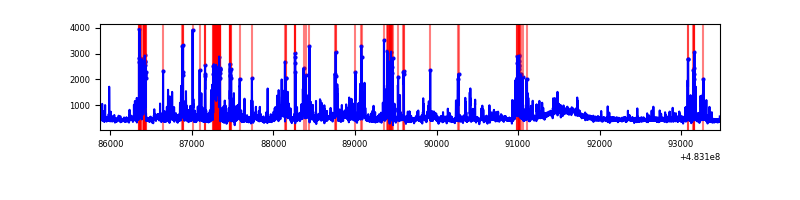 |
| C | 7604 | 7604 | 344 | 344 | 4.52% | 4.52% | 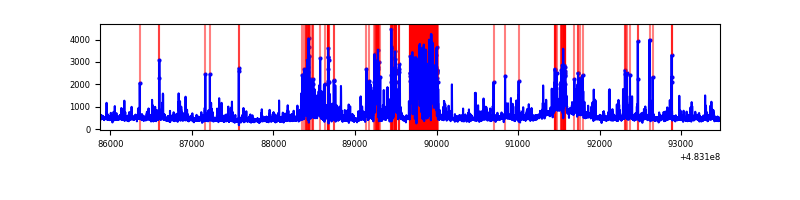 |
| D | 7604 | 7604 | 2756 | 2756 | 36.24% | 36.24% | 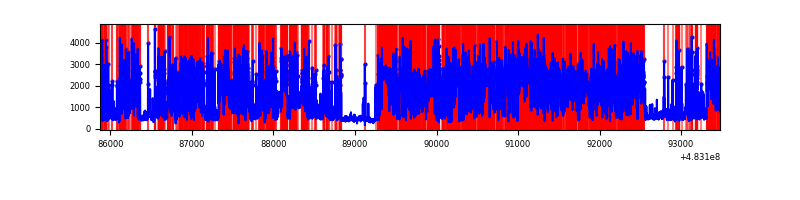 |
Top three noisy pixels from each quadrant. If the there are fewer than three noisy pixels in the level2.evt file, extra rows are filled as -1
| Pixel properties | Quadrant properties | ||||||
|---|---|---|---|---|---|---|---|
| Quadrant | DetID | PixID | Counts | Sigma | Mean | Median | Sigma |
| A | 12 | 3 | 734024 | 3652.67 | 826 | 805 | 200.7 |
| A | 15 | 174 | 353482 | 1756.93 | 826 | 805 | 200.7 |
| A | 2 | 143 | 340753 | 1693.52 | 826 | 805 | 200.7 |
| B | 4 | 206 | 523852 | 2931.22 | 823 | 793 | 178.4 |
| B | 5 | 173 | 217191 | 1212.69 | 823 | 793 | 178.4 |
| B | 6 | 51 | 107742 | 599.34 | 823 | 793 | 178.4 |
| C | 15 | 218 | 1014023 | 4718.01 | 787 | 782 | 214.8 |
| C | 9 | 38 | 306507 | 1423.57 | 787 | 782 | 214.8 |
| C | 12 | 254 | 190854 | 885.04 | 787 | 782 | 214.8 |
| D | 11 | 129 | 9240241 | 57259.1 | 578 | 559 | 161.4 |
| D | 10 | 181 | 235267 | 1454.51 | 578 | 559 | 161.4 |
| D | 8 | 48 | 53716 | 329.42 | 578 | 559 | 161.4 |
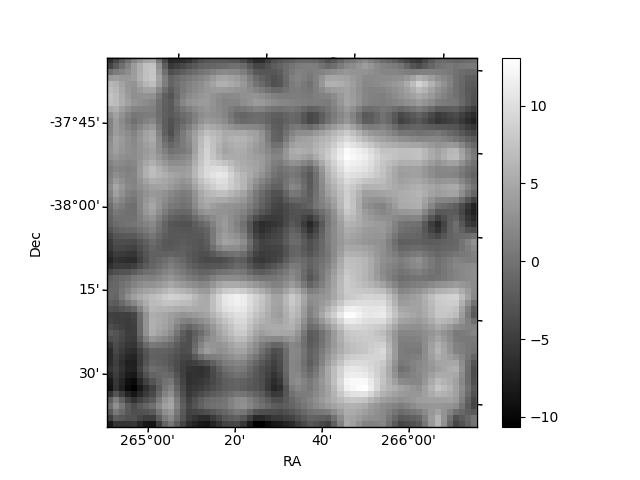
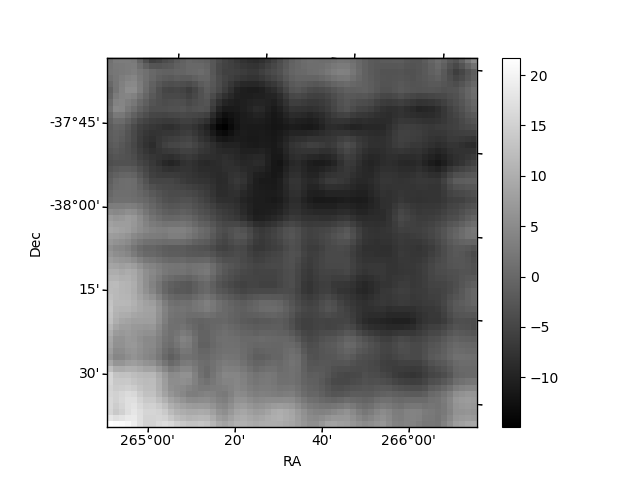
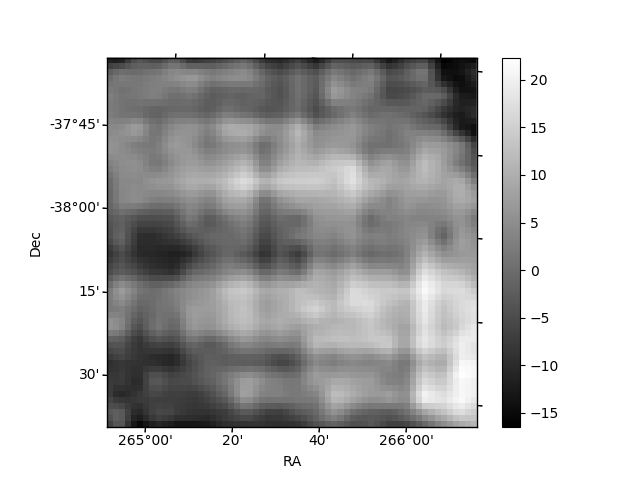
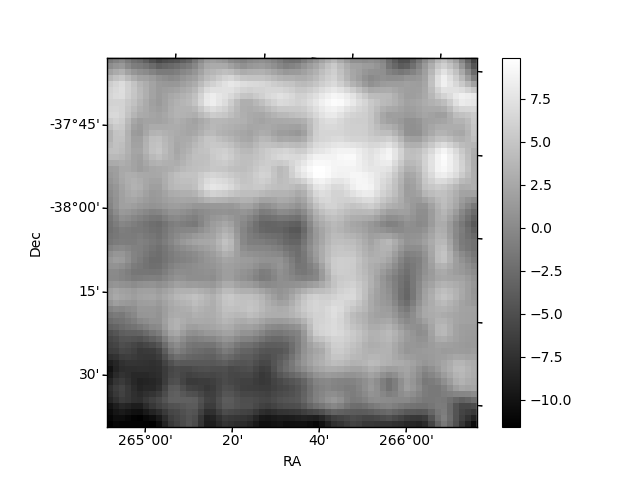
Histogram calculated using DETX and DETY for each event in the final _common_clean file
| Quadrant A | 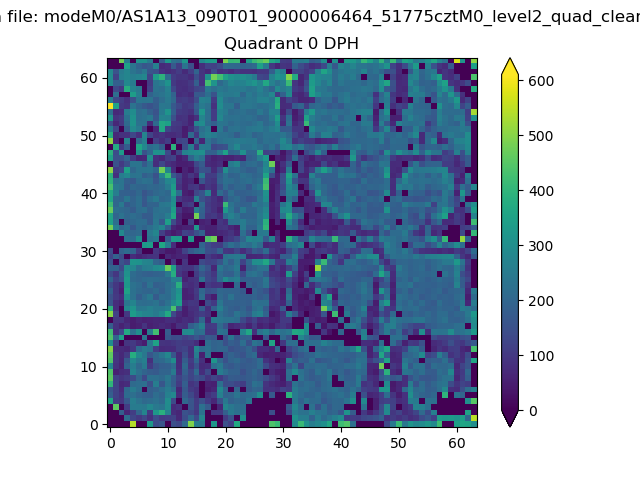 |
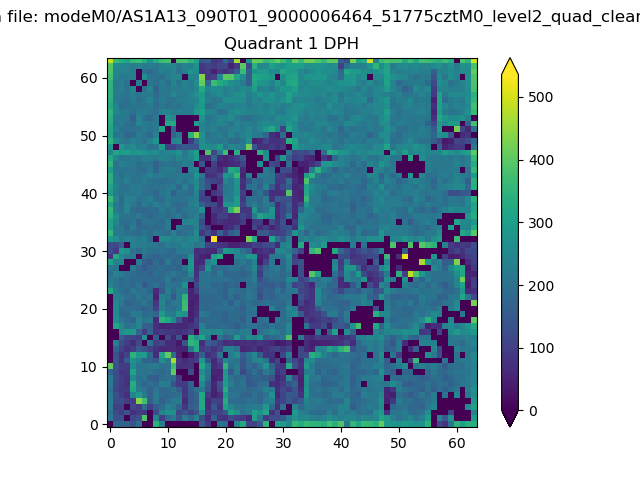 |
Quadrant B |
|---|---|---|---|
| Quadrant D | 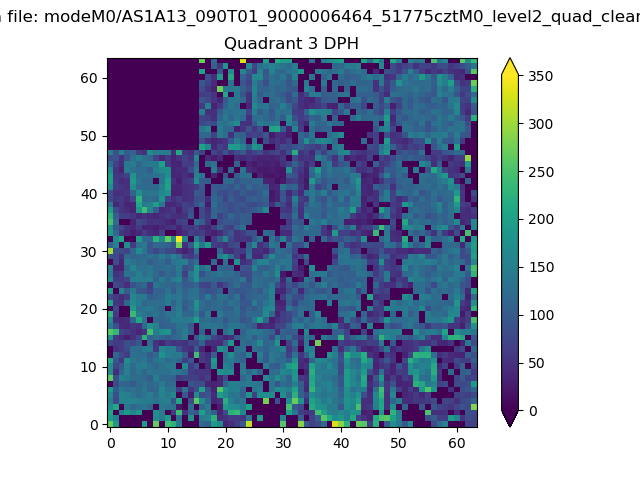 |
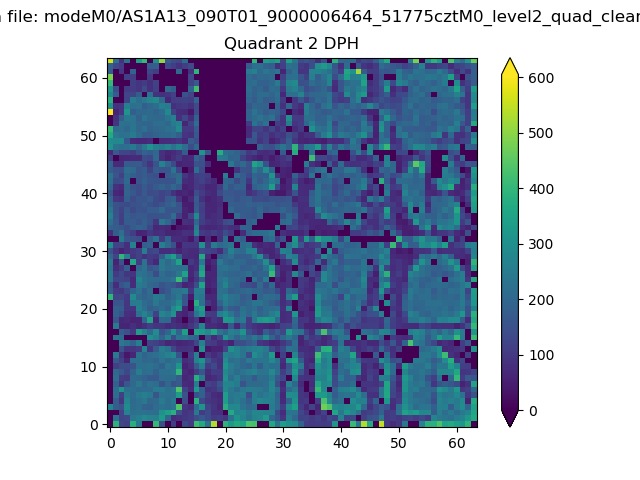 |
Quadrant C |
| Plot type | Count rate plots | Images |
|---|---|---|
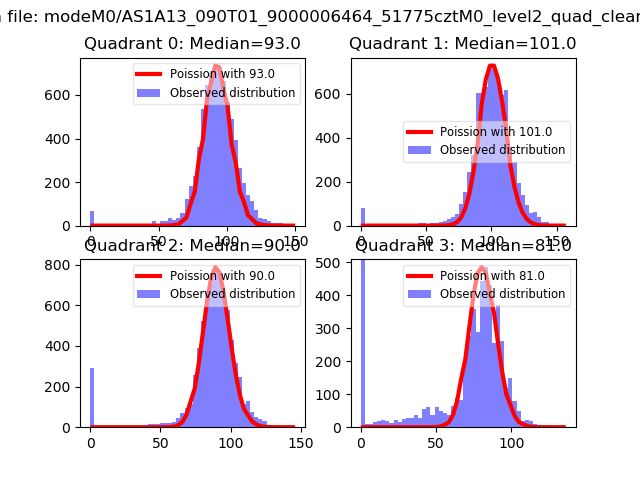
| Comparison with Poisson distribution Blue bars denote a histogram of data divided into 1 sec bins. Red curve is a Poisson curve with rate = median count rate of data. |
 |
 |
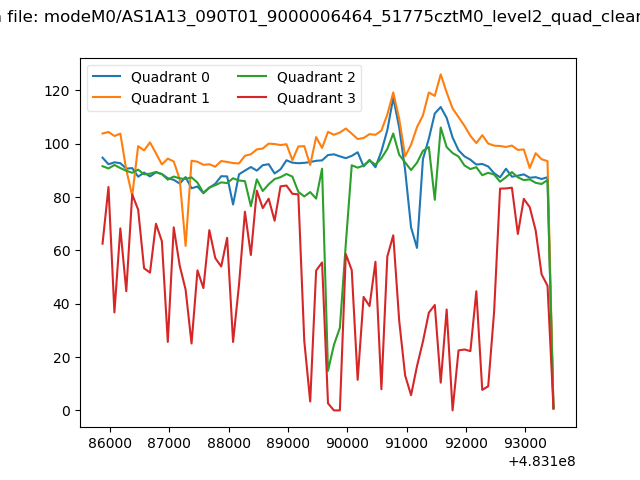
| Quadrant-wise count rates Data is divided into 100 sec bins |
 |
|
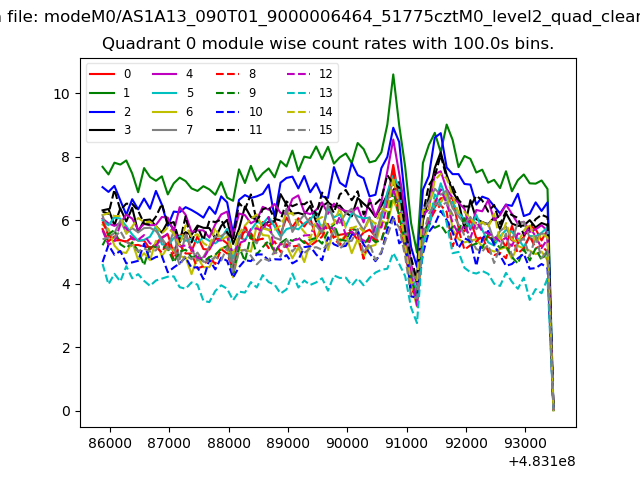
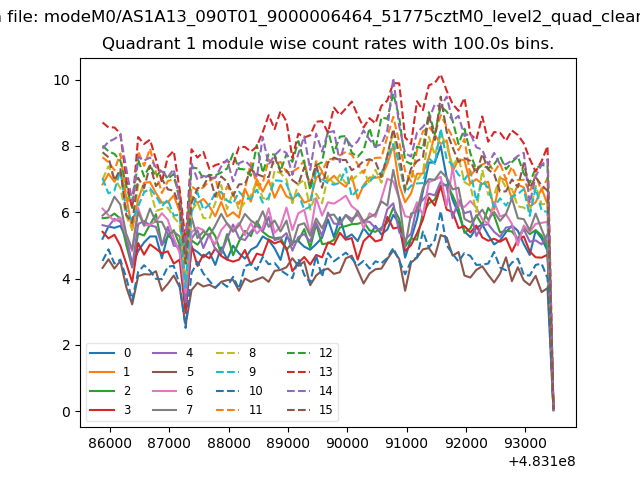
| Module-wise count rates for Quadrant A Data is divided into 100 sec bins |
 |
 |
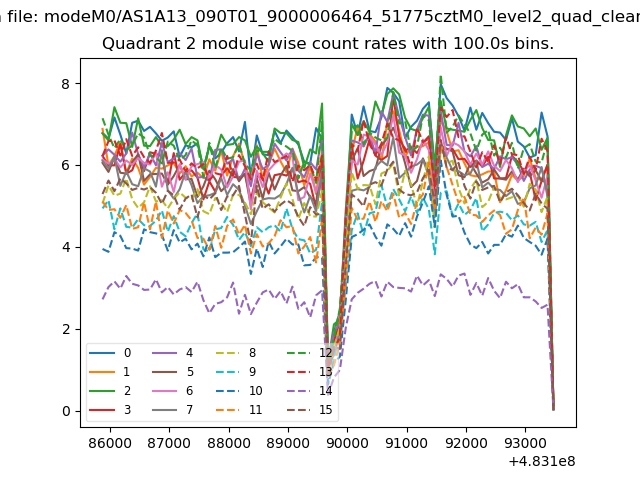
| Module-wise count rates for Quadrant B Data is divided into 100 sec bins |
 |
 |
| Module-wise count rates for Quadrant C Data is divided into 100 sec bins |
 |
 |
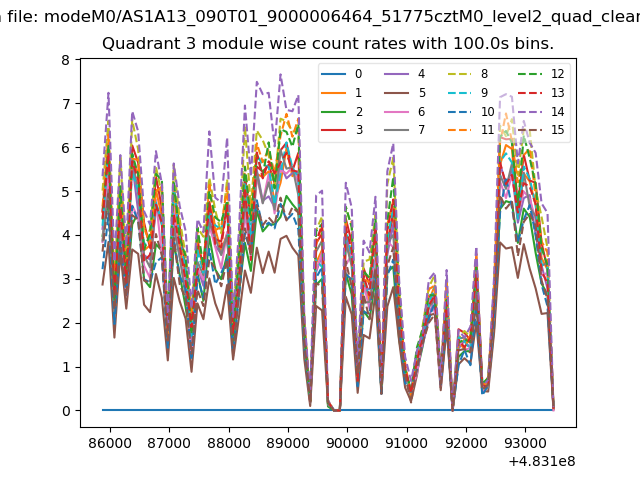
| Module-wise count rates for Quadrant D Data is divided into 100 sec bins |
 |
 |
| Parameter | Plot |
|---|---|
| CZT HV Monitor | 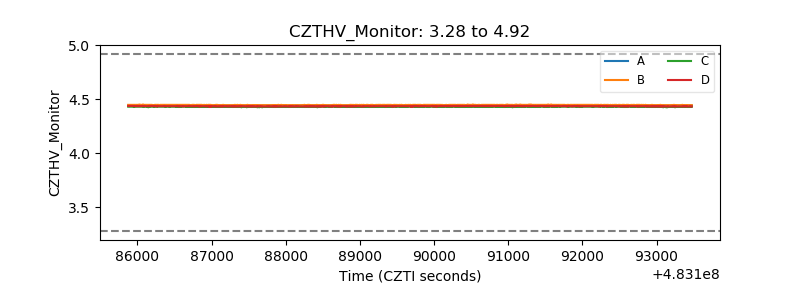 |
| D_VDD | 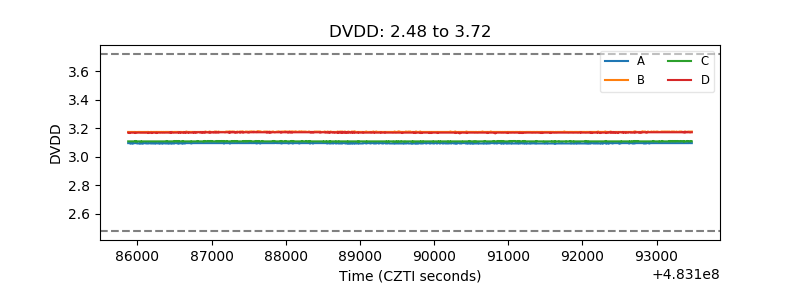 |
| Temperature 1 | 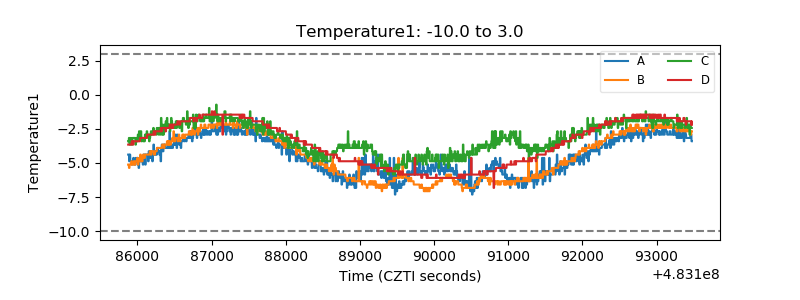 |
| Veto HV Monitor | 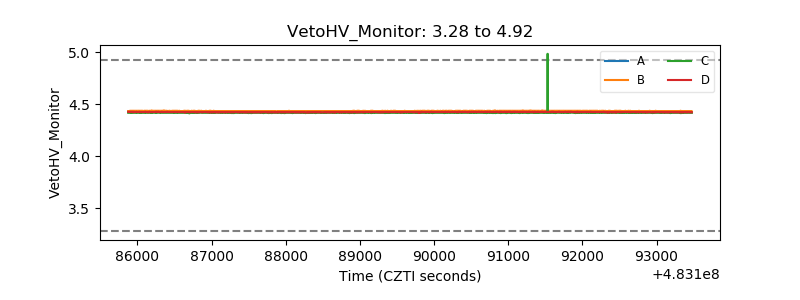 |
| Veto LLD | 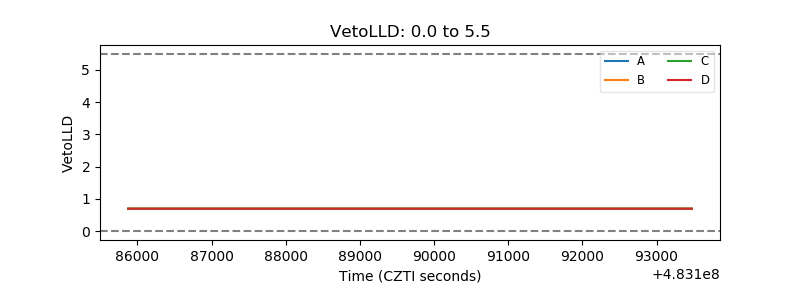 |
| Alpha Counter | 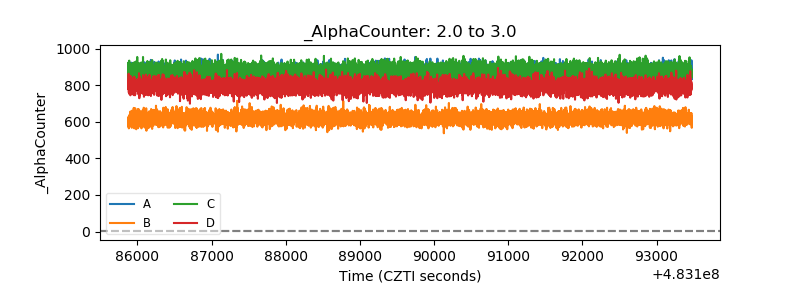 |
| _CPM_Rate | 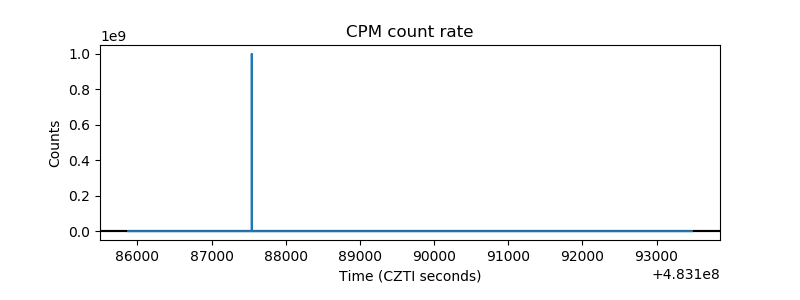 |
| CZT Counter | 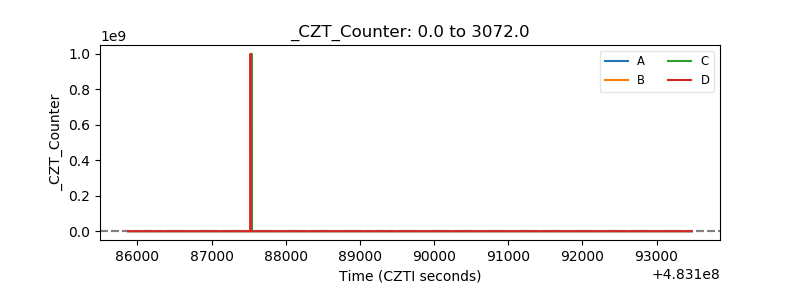 |
| +2.5 Volts monitor | 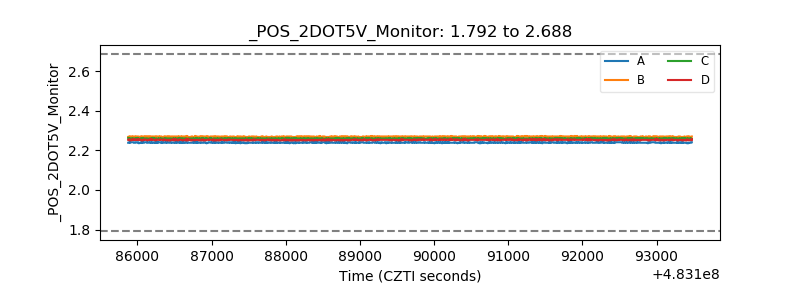 |
| +5 Volts monitor | 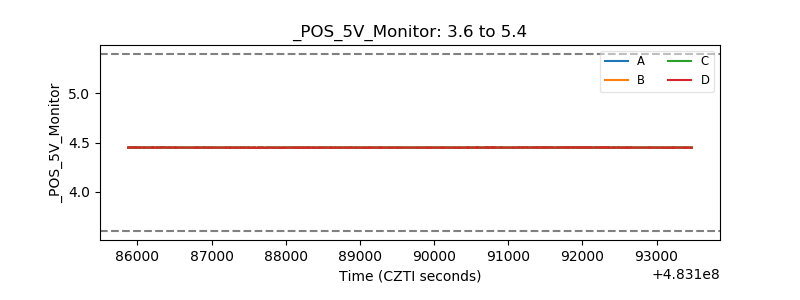 |
| _ROLL_ROT | 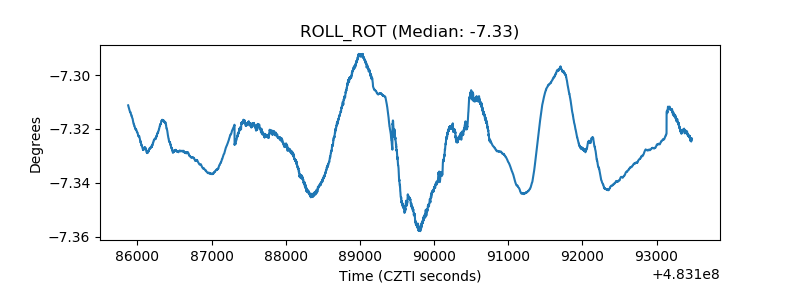 |
| _Roll_DEC | 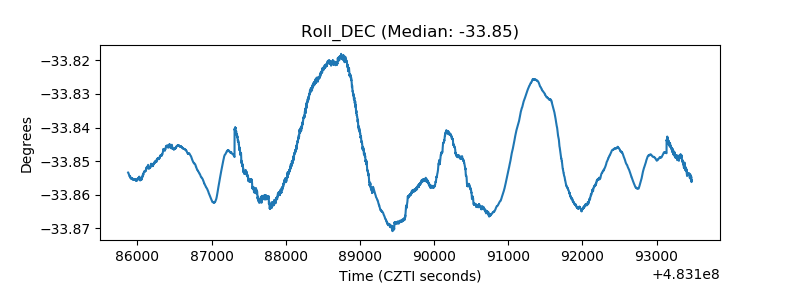 |
| _Roll_RA | 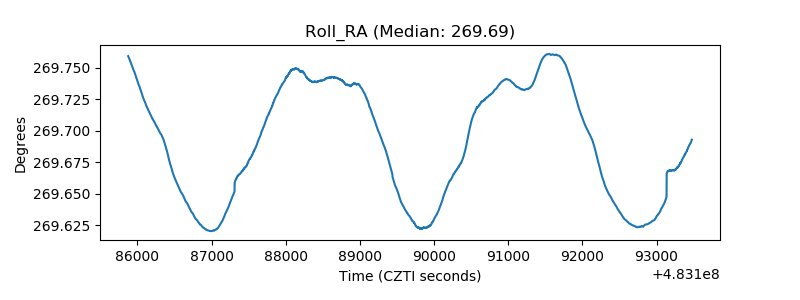 |
| Veto Counter | 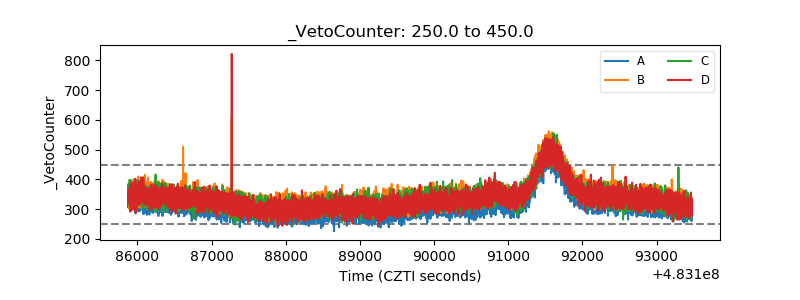 |