| Param | Original file | Final file |
|---|---|---|
| Filename | modeM0/AS1A13_090T01_9000006464_51776cztM0_level2.fits | modeM0/AS1A13_090T01_9000006464_51776cztM0_level2_quad_clean.evt |
| Size (bytes) | 751,406,400 | 109,350,720 |
| Size | 716.6 MB | 104.3 MB |
| Events in quadrant A | 5,507,165 | 746,386 |
| Events in quadrant B | 4,689,331 | 812,481 |
| Events in quadrant C | 5,633,952 | 717,994 |
| Events in quadrant D | 11,361,168 | 474,568 |
| Mode SS | |||
|---|---|---|---|
| Quadrant | BADHDUFLAG | Total packets | Discarded packets |
| A | 0 | 162 | 0 |
| B | 0 | 162 | 0 |
| C | 0 | 162 | 0 |
| D | 0 | 162 | 0 |
| Mode M0 | |||
|---|---|---|---|
| Quadrant | BADHDUFLAG | Total packets | Discarded packets |
| A | 0 | 21852 | 0 |
| B | 0 | 19534 | 0 |
| C | 0 | 22117 | 0 |
| D | 0 | 39282 | 0 |
| Quadrant | Total seconds | Saturated seconds | Saturation percentage |
|---|---|---|---|
| A | 8043 | 169 | 2.101206% |
| B | 8043 | 139 | 1.728211% |
| C | 8043 | 294 | 3.655352% |
| D | 8044 | 2781 | 34.572352% |
Noise dominated data is calculated using 1-second bins in cleaned event files. If a bin has >2000 counts, and if more than 50% of those come from <1% of pixels, then it is considered to be noise-dominated and hence unusable.
| Quadrant | # 1 sec bins | Bins with >0 counts | Bins with >2000 counts | High rate bins dominated by noise | Noise dominated (total time) | Noise dominated (detector-on time) | Marked lightcurve |
|---|---|---|---|---|---|---|---|
| A | 8043 | 8043 | 91 | 91 | 1.13% | 1.13% | 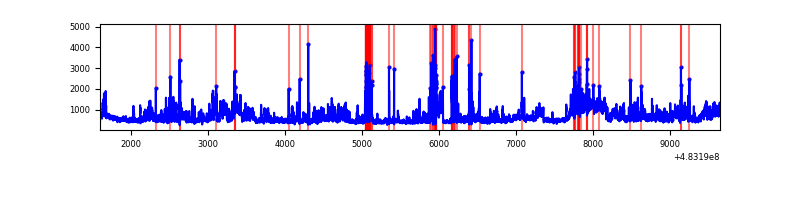 |
| B | 8043 | 8043 | 68 | 68 | 0.85% | 0.85% | 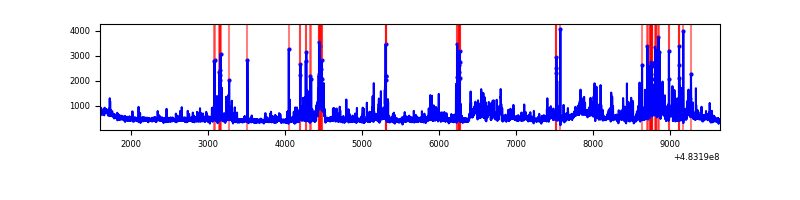 |
| C | 8043 | 8043 | 213 | 213 | 2.65% | 2.65% | 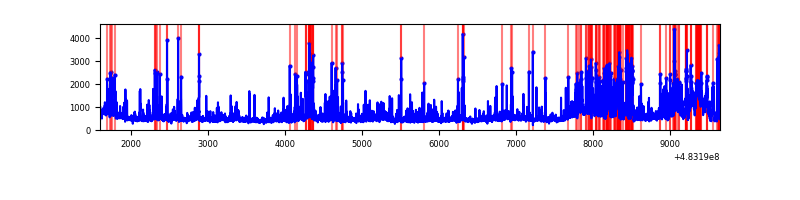 |
| D | 8044 | 8044 | 2417 | 2417 | 30.05% | 30.05% | 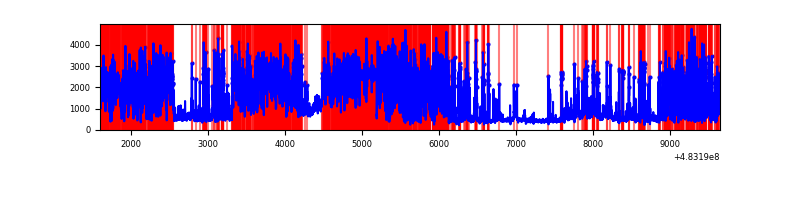 |
Top three noisy pixels from each quadrant. If the there are fewer than three noisy pixels in the level2.evt file, extra rows are filled as -1
| Pixel properties | Quadrant properties | ||||||
|---|---|---|---|---|---|---|---|
| Quadrant | DetID | PixID | Counts | Sigma | Mean | Median | Sigma |
| A | 12 | 3 | 620045 | 2890.19 | 877 | 855 | 214.2 |
| A | 2 | 143 | 272828 | 1269.49 | 877 | 855 | 214.2 |
| A | 4 | 3 | 154819 | 718.66 | 877 | 855 | 214.2 |
| B | 4 | 206 | 339814 | 1799.08 | 872 | 842 | 188.4 |
| B | 10 | 44 | 188650 | 996.78 | 872 | 842 | 188.4 |
| B | 4 | 174 | 148805 | 785.31 | 872 | 842 | 188.4 |
| C | 3 | 242 | 538571 | 2339.06 | 848 | 845 | 229.9 |
| C | 0 | 209 | 427712 | 1856.84 | 848 | 845 | 229.9 |
| C | 9 | 38 | 346792 | 1504.84 | 848 | 845 | 229.9 |
| D | 11 | 129 | 7789546 | 39463.71 | 709 | 683 | 197.4 |
| D | 10 | 181 | 273433 | 1381.94 | 709 | 683 | 197.4 |
| D | 7 | 159 | 147886 | 745.83 | 709 | 683 | 197.4 |
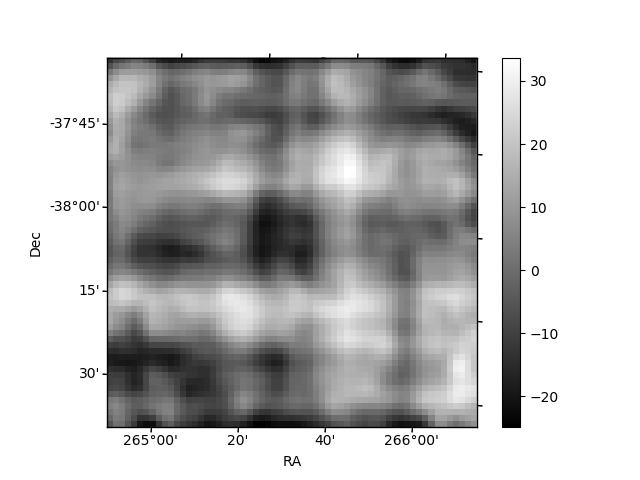
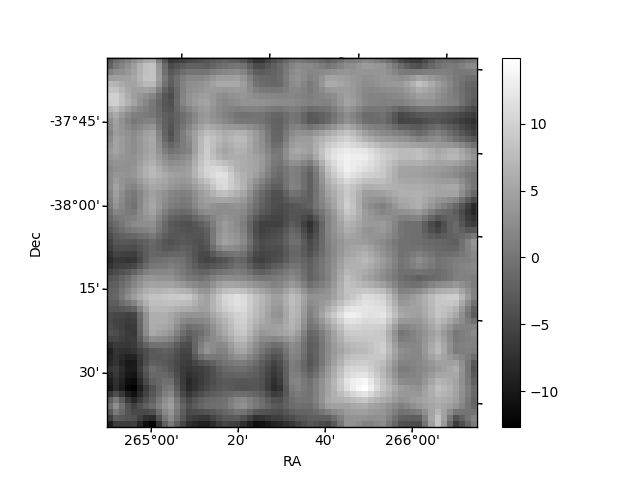
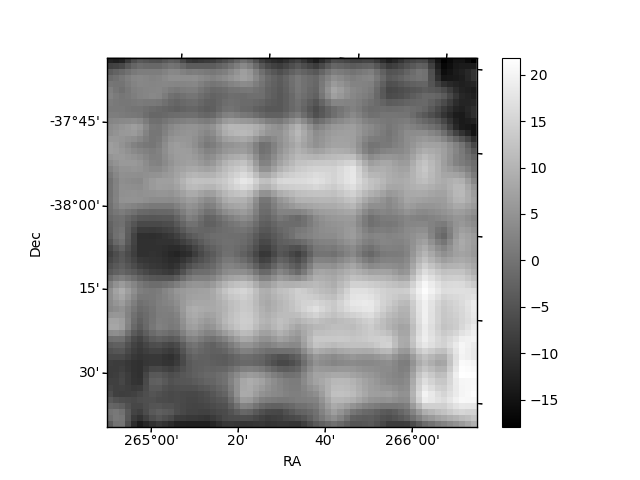
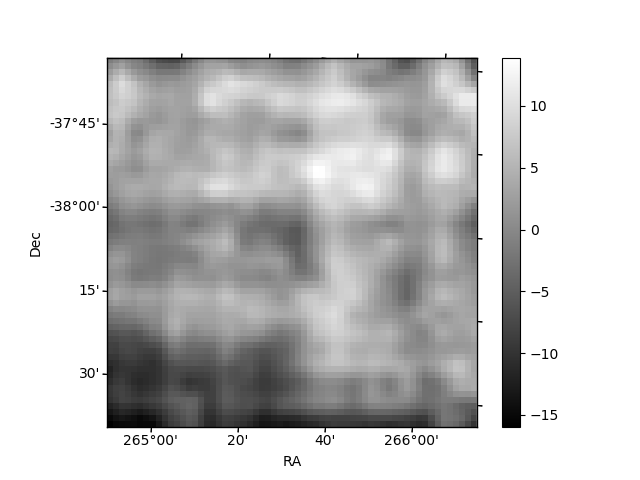
Histogram calculated using DETX and DETY for each event in the final _common_clean file
| Quadrant A | 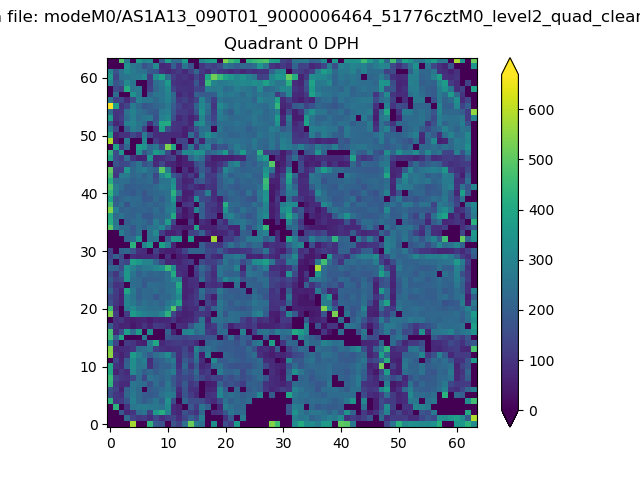 |
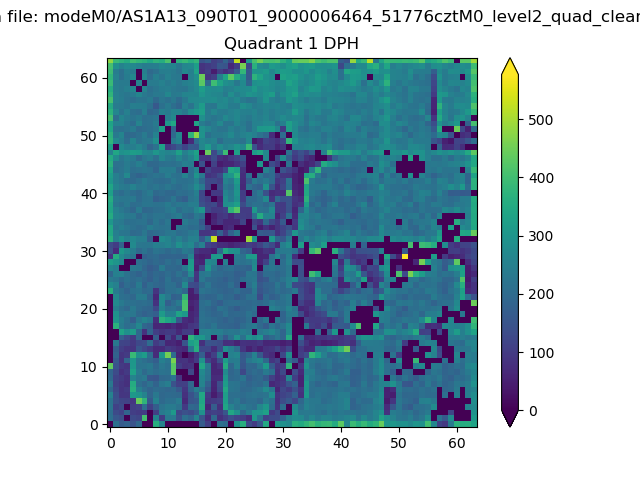 |
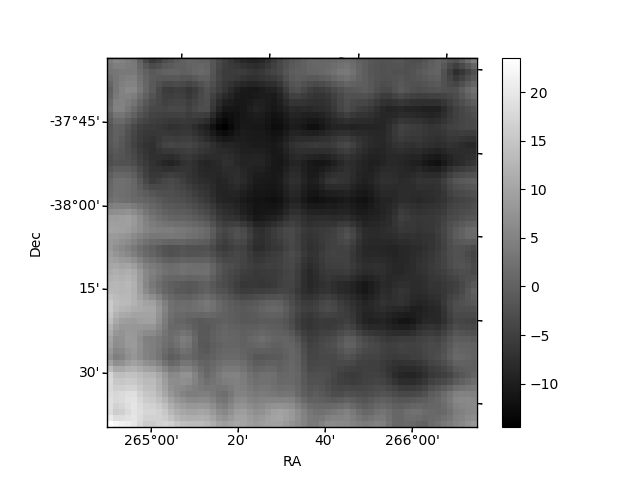
Quadrant B |
|---|---|---|---|
| Quadrant D | 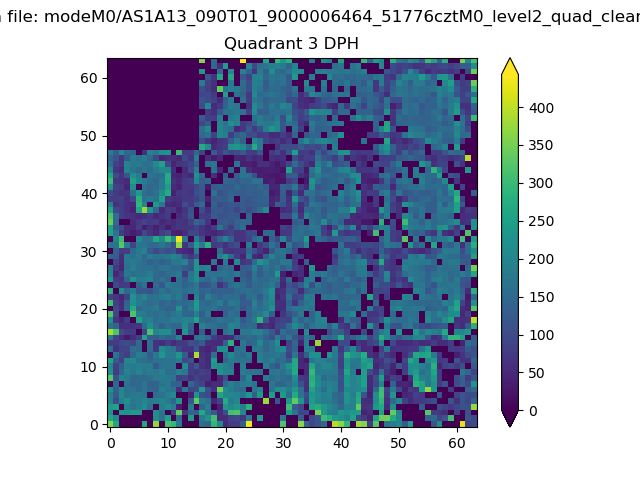 |
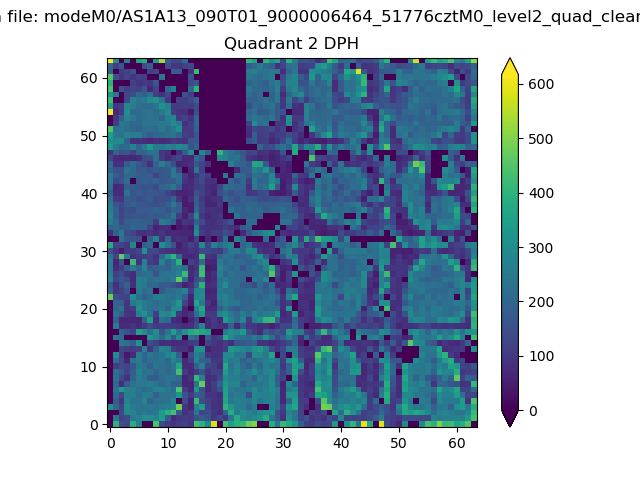 |
Quadrant C |
| Plot type | Count rate plots | Images |
|---|---|---|
| Comparison with Poisson distribution Blue bars denote a histogram of data divided into 1 sec bins. Red curve is a Poisson curve with rate = median count rate of data. |
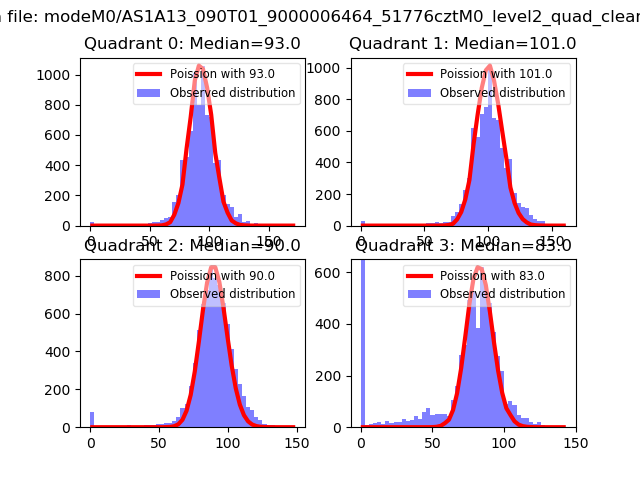 |
 |
| Quadrant-wise count rates Data is divided into 100 sec bins |
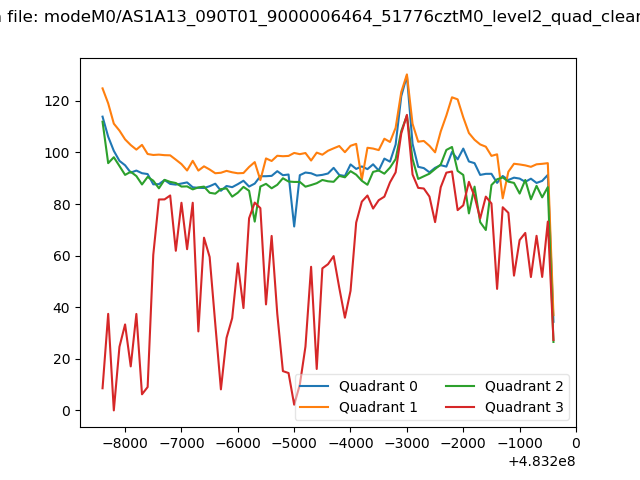 |
|
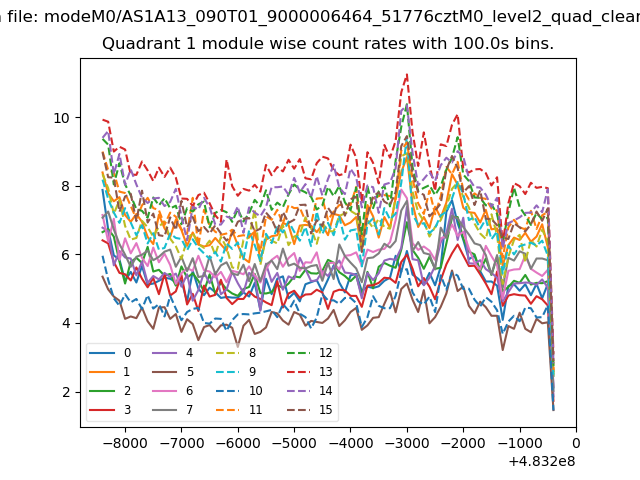
| Module-wise count rates for Quadrant A Data is divided into 100 sec bins |
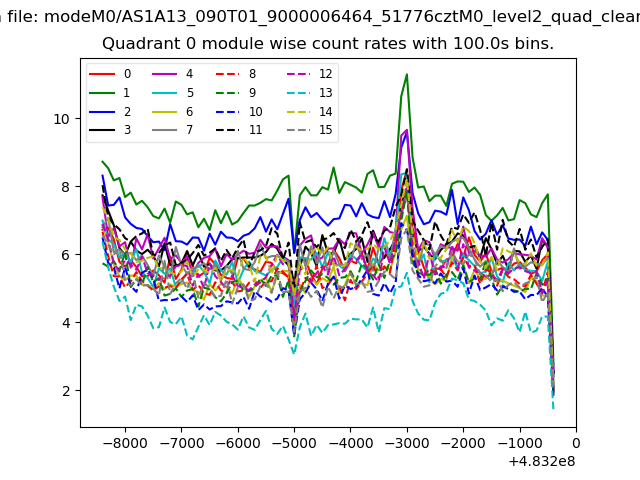 |
 |
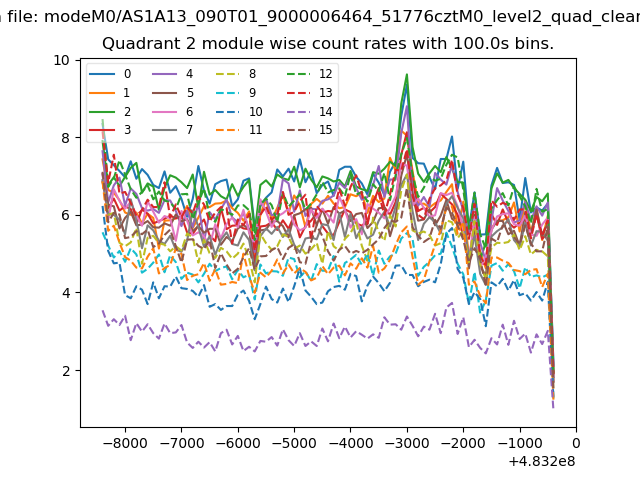
| Module-wise count rates for Quadrant B Data is divided into 100 sec bins |
 |
 |
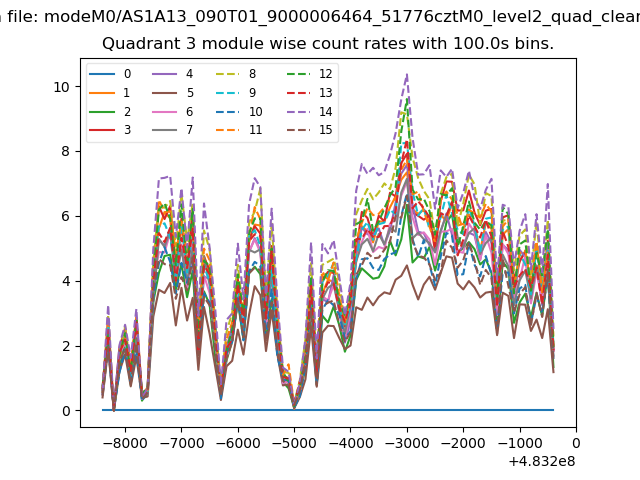
| Module-wise count rates for Quadrant C Data is divided into 100 sec bins |
 |
 |
| Module-wise count rates for Quadrant D Data is divided into 100 sec bins |
 |
 |
| Parameter | Plot |
|---|---|
| CZT HV Monitor |  |
| D_VDD | 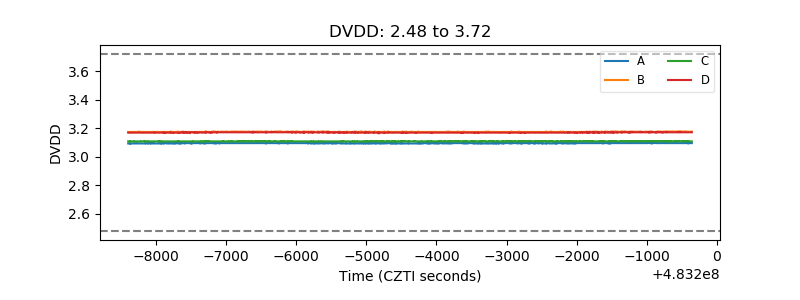 |
| Temperature 1 | 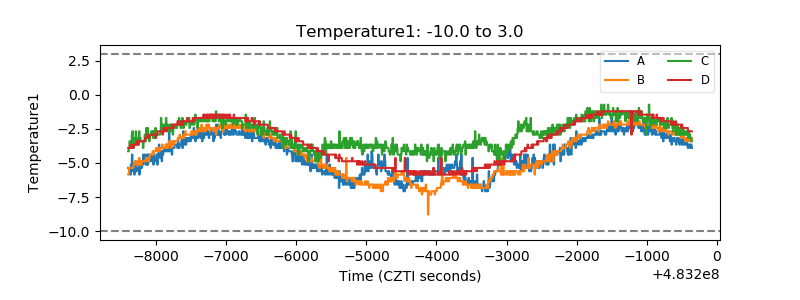 |
| Veto HV Monitor | 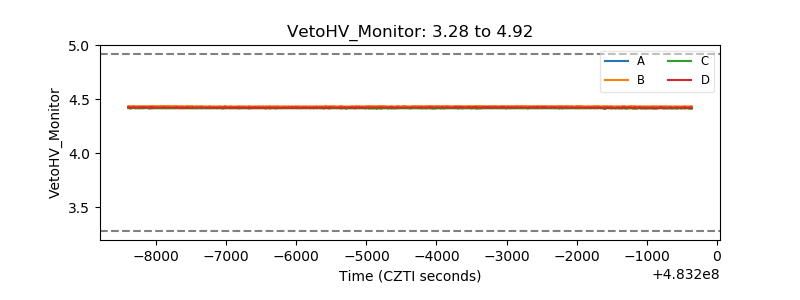 |
| Veto LLD | 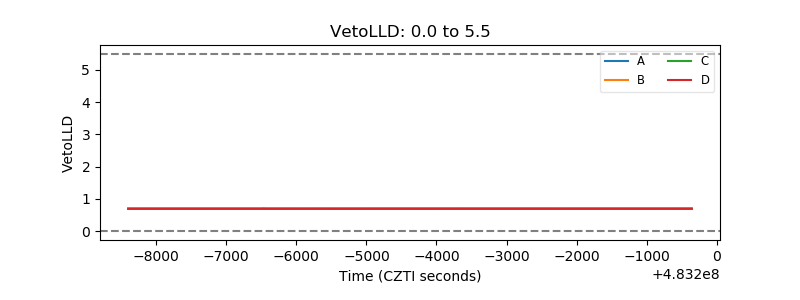 |
| Alpha Counter | 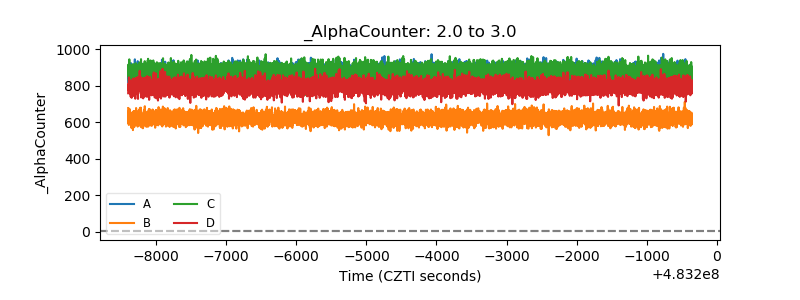 |
| _CPM_Rate | 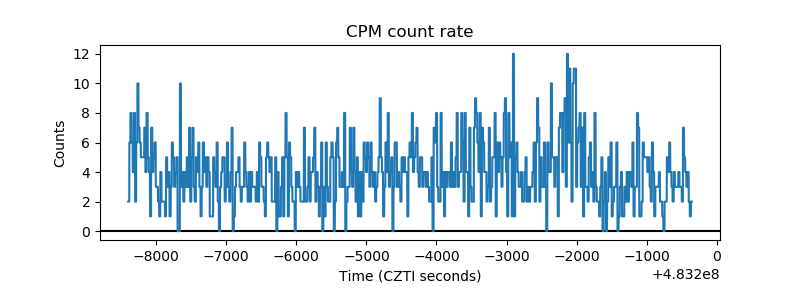 |
| CZT Counter | 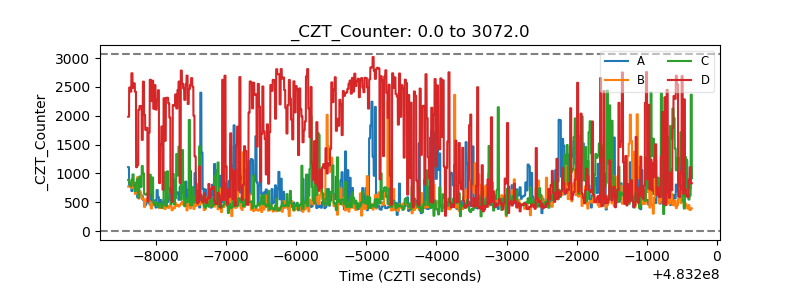 |
| +2.5 Volts monitor | 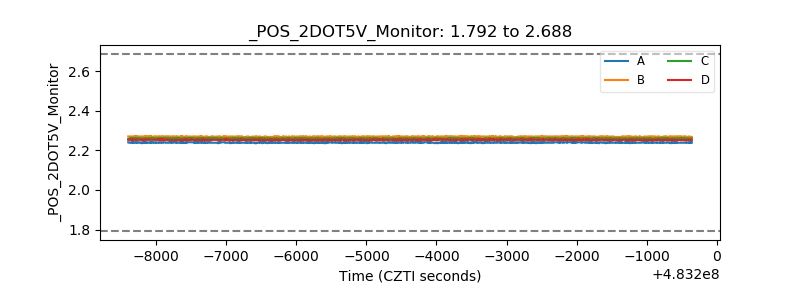 |
| +5 Volts monitor | 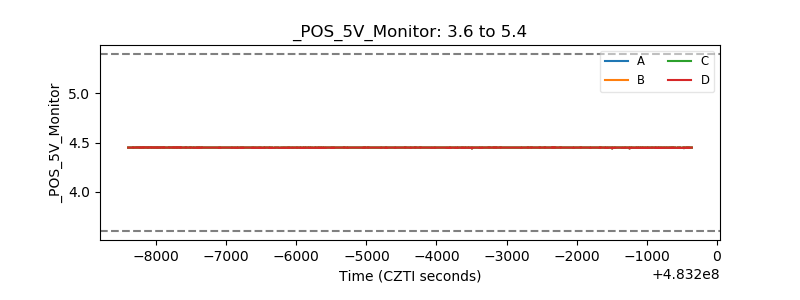 |
| _ROLL_ROT | 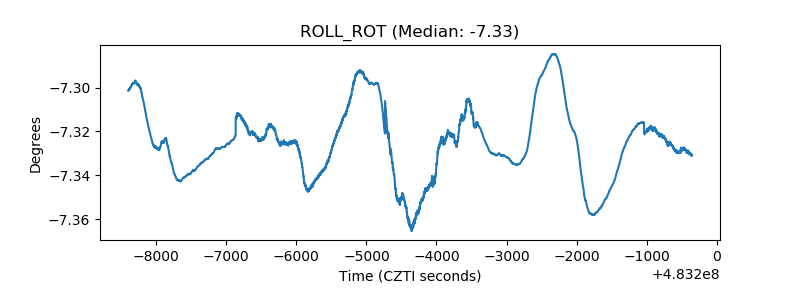 |
| _Roll_DEC | 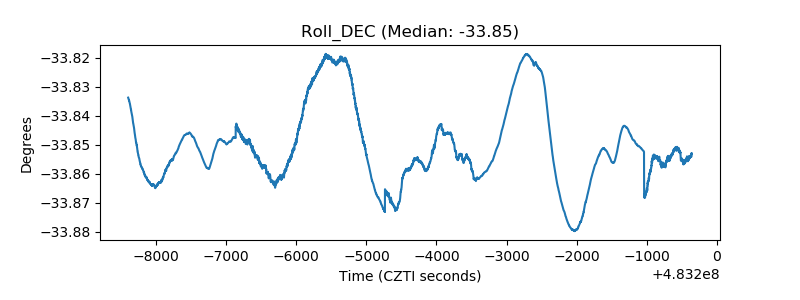 |
| _Roll_RA | 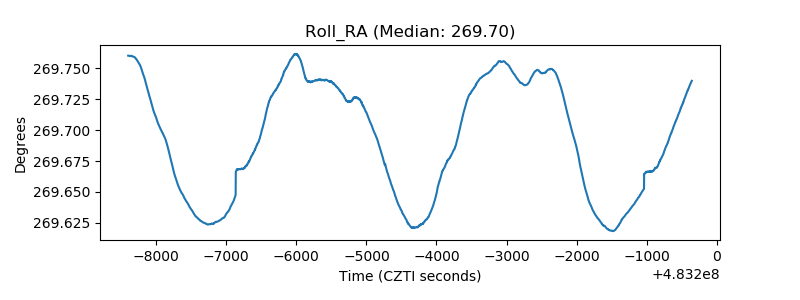 |
| Veto Counter | 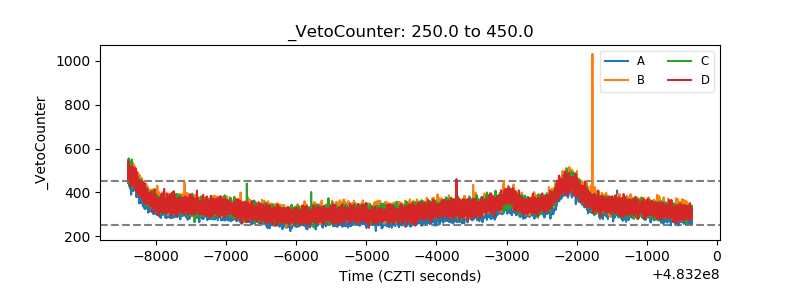 |