| Param | Original file | Final file |
|---|---|---|
| Filename | modeM0/AS1A13_090T01_9000006464_51779cztM0_level2.fits | modeM0/AS1A13_090T01_9000006464_51779cztM0_level2_quad_clean.evt |
| Size (bytes) | 1,599,120,000 | 209,304,000 |
| Size | 1.5 GB | 199.6 MB |
| Events in quadrant A | 11,644,214 | 1,437,124 |
| Events in quadrant B | 10,753,875 | 1,532,661 |
| Events in quadrant C | 13,233,367 | 1,363,241 |
| Events in quadrant D | 22,337,753 | 907,477 |
| Mode M9 | |||
|---|---|---|---|
| Quadrant | BADHDUFLAG | Total packets | Discarded packets |
| A | 0 | 3 | 0 |
| B | 0 | 3 | 0 |
| C | 0 | 3 | 0 |
| D | 0 | 3 | 0 |
| Mode SS | |||
|---|---|---|---|
| Quadrant | BADHDUFLAG | Total packets | Discarded packets |
| A | 0 | 320 | 0 |
| B | 0 | 320 | 0 |
| C | 0 | 320 | 0 |
| D | 0 | 320 | 0 |
| Mode M0 | |||
|---|---|---|---|
| Quadrant | BADHDUFLAG | Total packets | Discarded packets |
| A | 0 | 45550 | 1 |
| B | 0 | 42904 | 1 |
| C | 0 | 50178 | 1 |
| D | 0 | 77337 | 1 |
| Quadrant | Total seconds | Saturated seconds | Saturation percentage |
|---|---|---|---|
| A | 15883 | 605 | 3.809104% |
| B | 15884 | 846 | 5.326114% |
| C | 15884 | 1009 | 6.352304% |
| D | 15884 | 5361 | 33.750944% |
Noise dominated data is calculated using 1-second bins in cleaned event files. If a bin has >2000 counts, and if more than 50% of those come from <1% of pixels, then it is considered to be noise-dominated and hence unusable.
| Quadrant | # 1 sec bins | Bins with >0 counts | Bins with >2000 counts | High rate bins dominated by noise | Noise dominated (total time) | Noise dominated (detector-on time) | Marked lightcurve |
|---|---|---|---|---|---|---|---|
| A | 16158 | 15884 | 331 | 331 | 2.05% | 2.08% | 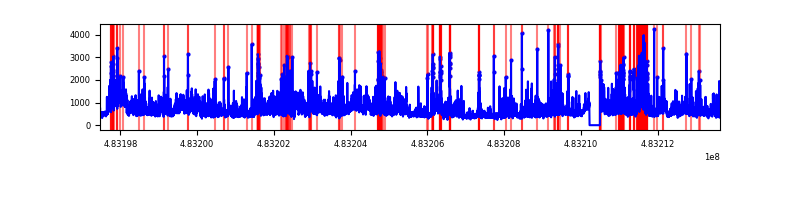 |
| B | 16159 | 15885 | 431 | 431 | 2.67% | 2.71% | 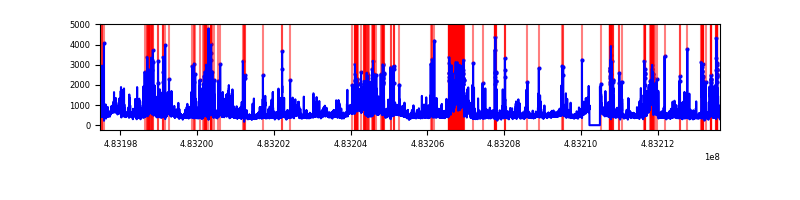 |
| C | 16159 | 15885 | 637 | 637 | 3.94% | 4.01% | 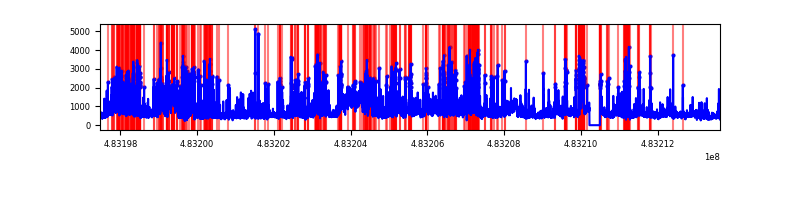 |
| D | 16159 | 15885 | 4632 | 4632 | 28.67% | 29.16% |  |
Top three noisy pixels from each quadrant. If the there are fewer than three noisy pixels in the level2.evt file, extra rows are filled as -1
| Pixel properties | Quadrant properties | ||||||
|---|---|---|---|---|---|---|---|
| Quadrant | DetID | PixID | Counts | Sigma | Mean | Median | Sigma |
| A | 12 | 3 | 1363735 | 3232.49 | 1711 | 1668 | 421.4 |
| A | 3 | 14 | 587063 | 1389.27 | 1711 | 1668 | 421.4 |
| A | 4 | 175 | 548207 | 1297.06 | 1711 | 1668 | 421.4 |
| B | 4 | 206 | 1321150 | 3642.94 | 1692 | 1633 | 362.2 |
| B | 10 | 44 | 956173 | 2635.3 | 1692 | 1633 | 362.2 |
| B | 4 | 174 | 477615 | 1314.1 | 1692 | 1633 | 362.2 |
| C | 3 | 242 | 2316316 | 5172.96 | 1653 | 1643 | 447.5 |
| C | 15 | 218 | 808725 | 1803.71 | 1653 | 1643 | 447.5 |
| C | 9 | 38 | 692670 | 1544.35 | 1653 | 1643 | 447.5 |
| D | 11 | 129 | 12881943 | 33353.48 | 1384 | 1336 | 386.2 |
| D | 7 | 60 | 1833677 | 4744.72 | 1384 | 1336 | 386.2 |
| D | 7 | 159 | 387927 | 1001.05 | 1384 | 1336 | 386.2 |
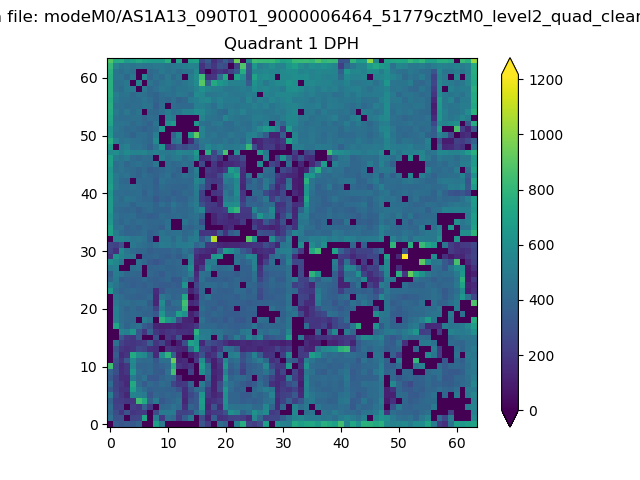
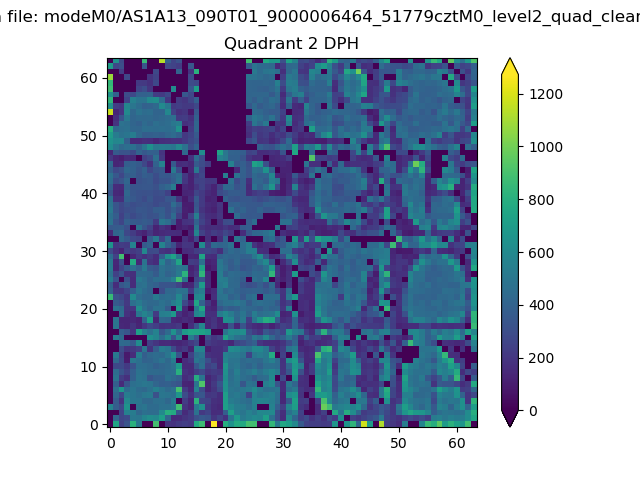
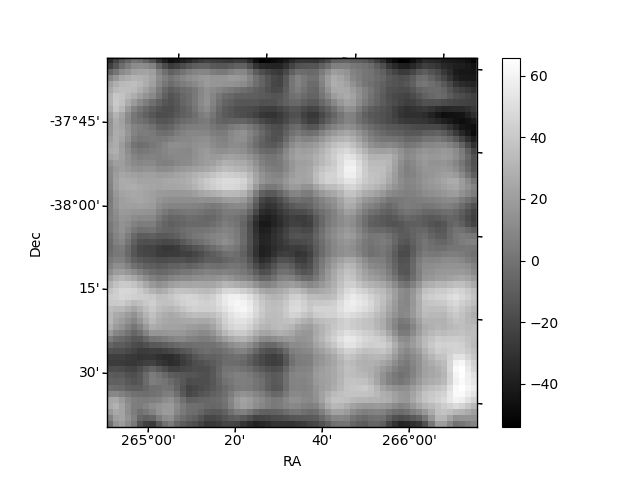
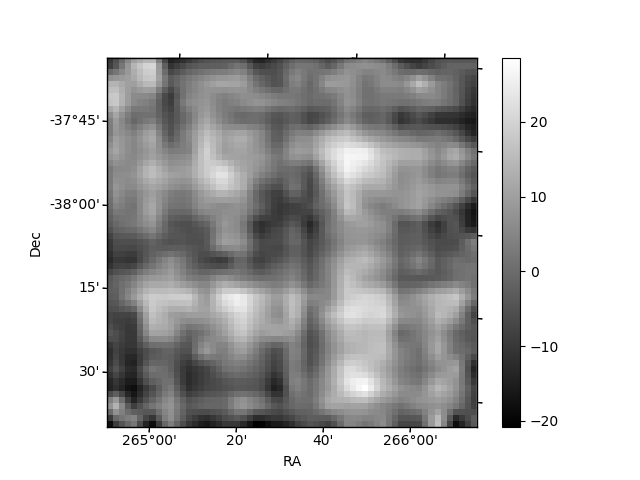
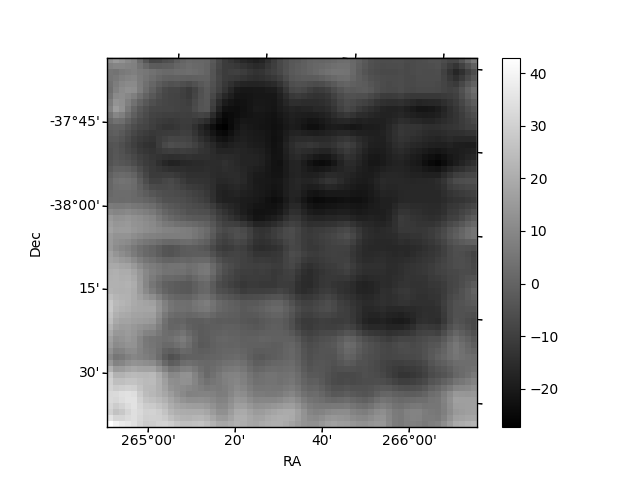
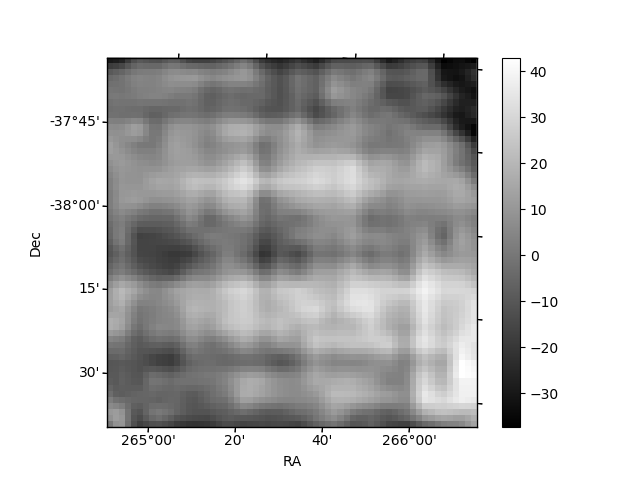
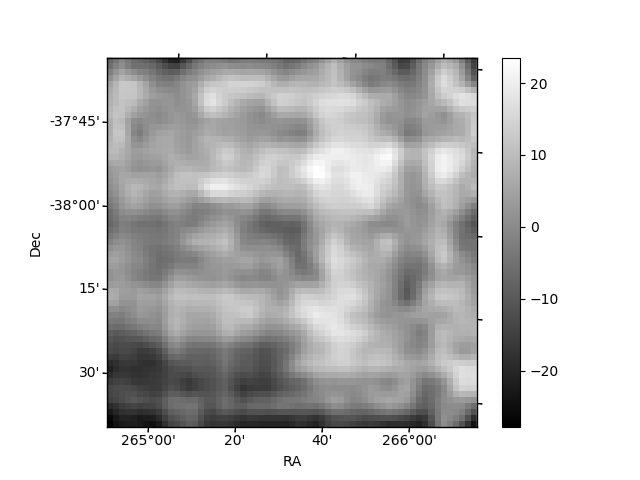
Histogram calculated using DETX and DETY for each event in the final _common_clean file
| Quadrant A | 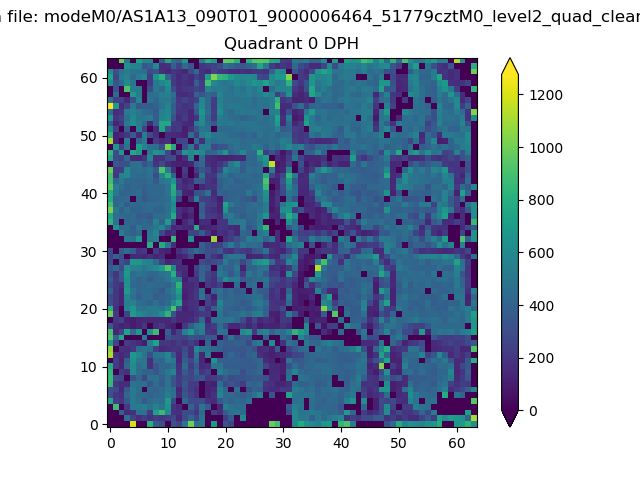 |
 |
Quadrant B |
|---|---|---|---|
| Quadrant D | 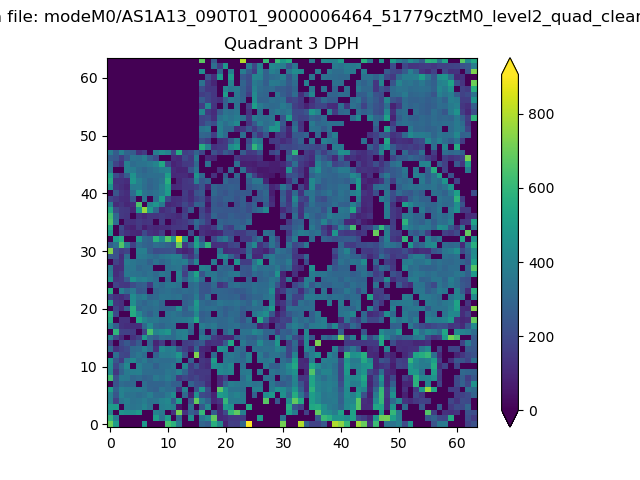 |
 |
Quadrant C |
| Plot type | Count rate plots | Images |
|---|---|---|
| Comparison with Poisson distribution Blue bars denote a histogram of data divided into 1 sec bins. Red curve is a Poisson curve with rate = median count rate of data. |
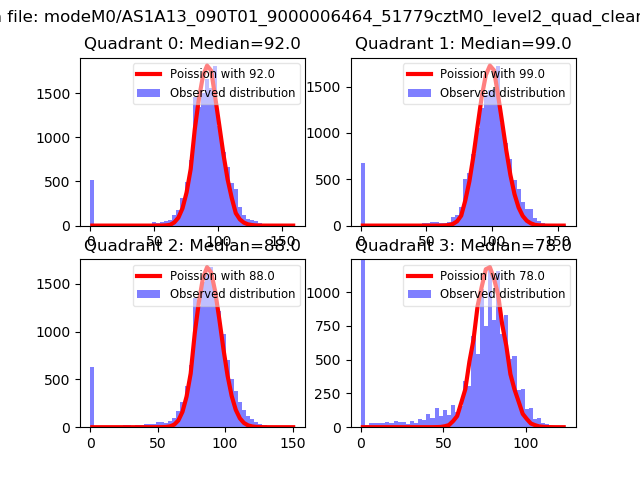 |
 |
| Quadrant-wise count rates Data is divided into 100 sec bins |
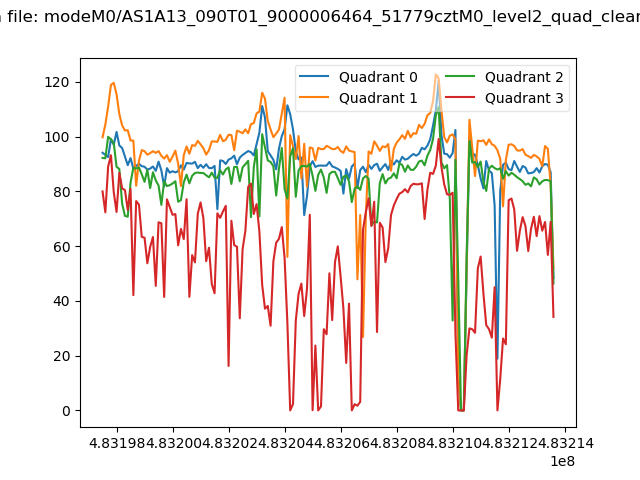 |
|
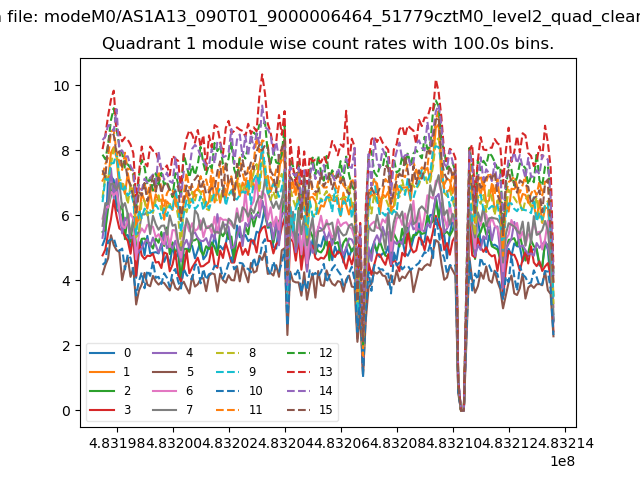
| Module-wise count rates for Quadrant A Data is divided into 100 sec bins |
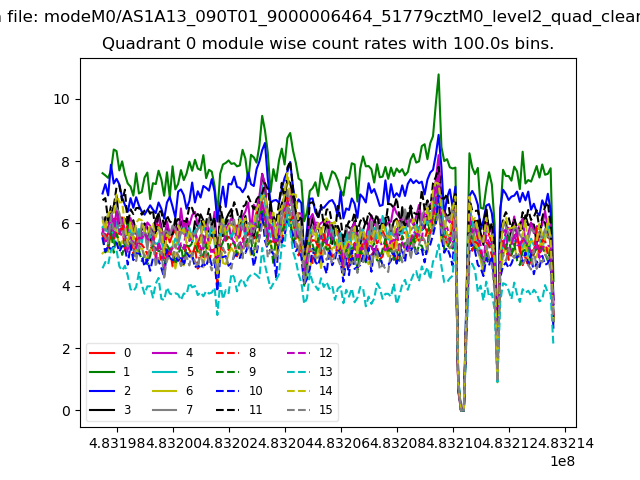 |
 |
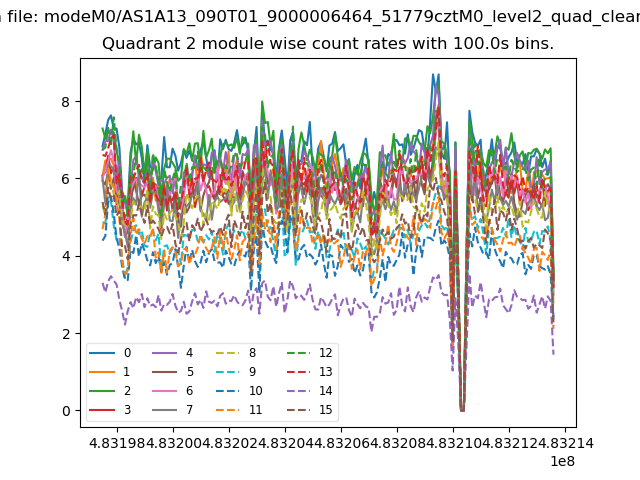
| Module-wise count rates for Quadrant B Data is divided into 100 sec bins |
 |
 |
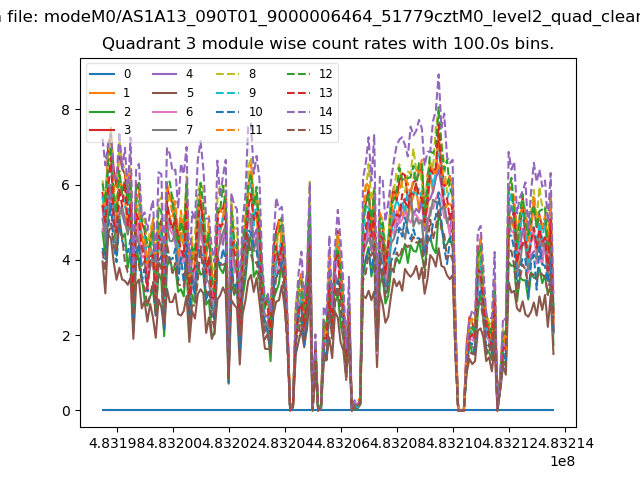
| Module-wise count rates for Quadrant C Data is divided into 100 sec bins |
 |
 |
| Module-wise count rates for Quadrant D Data is divided into 100 sec bins |
 |
 |
| Parameter | Plot |
|---|---|
| CZT HV Monitor | 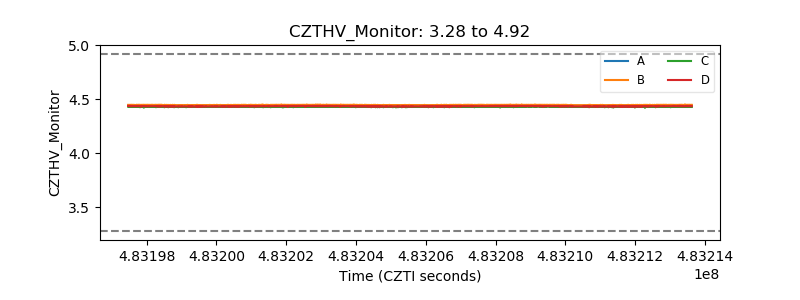 |
| D_VDD | 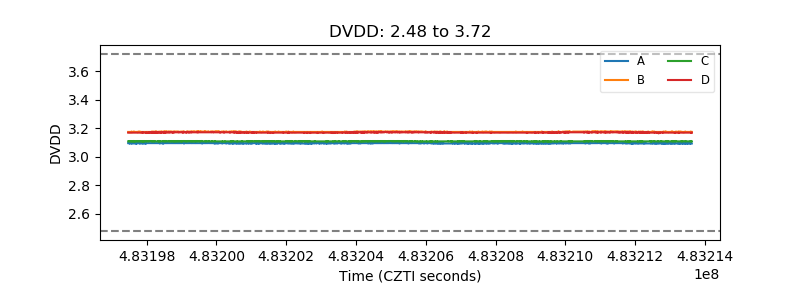 |
| Temperature 1 | 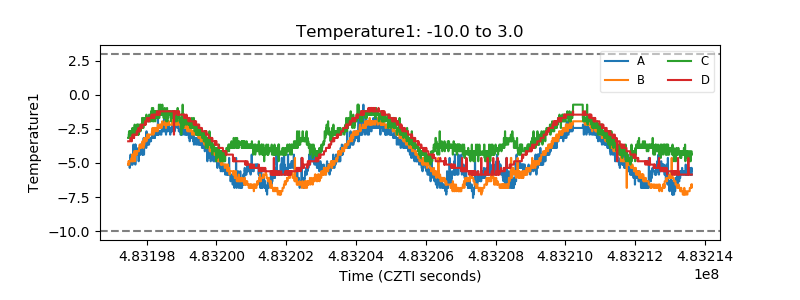 |
| Veto HV Monitor | 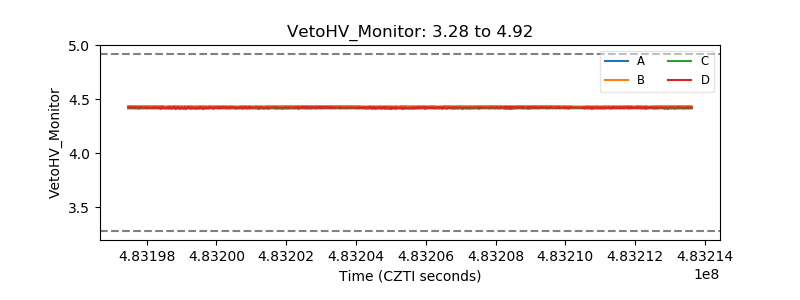 |
| Veto LLD | 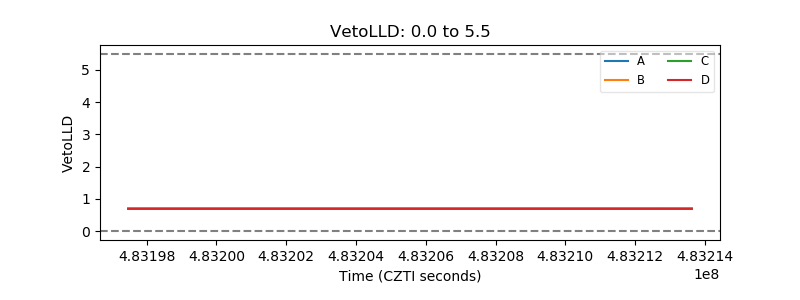 |
| Alpha Counter | 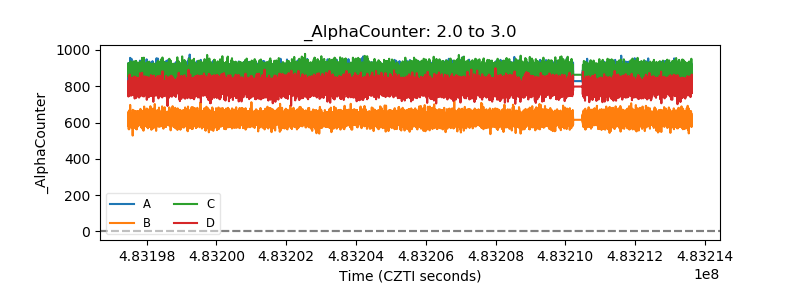 |
| _CPM_Rate | 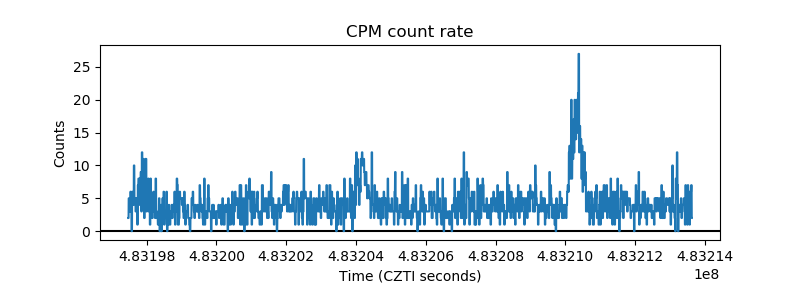 |
| CZT Counter | 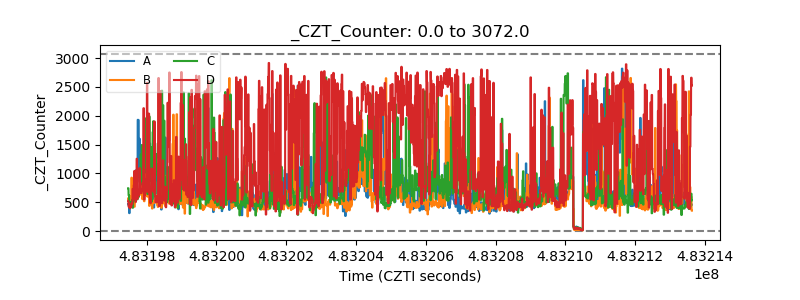 |
| +2.5 Volts monitor | 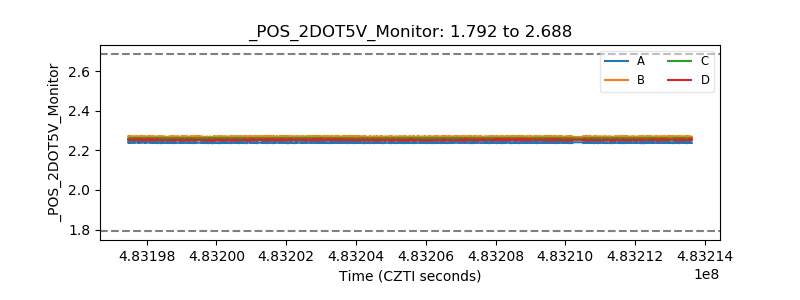 |
| +5 Volts monitor | 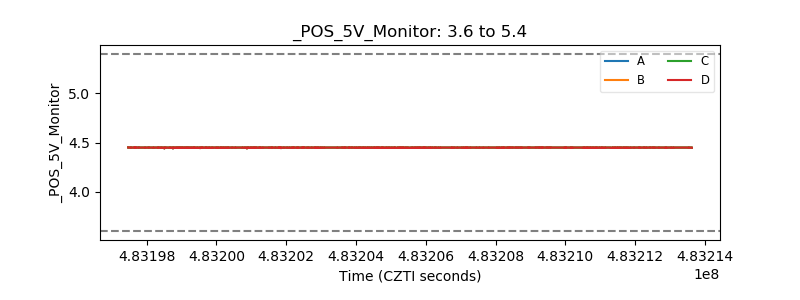 |
| _ROLL_ROT | 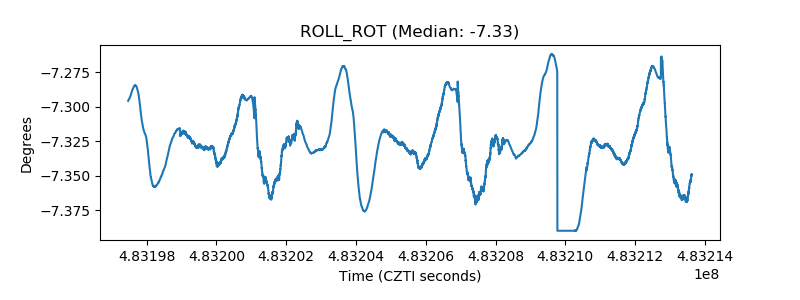 |
| _Roll_DEC | 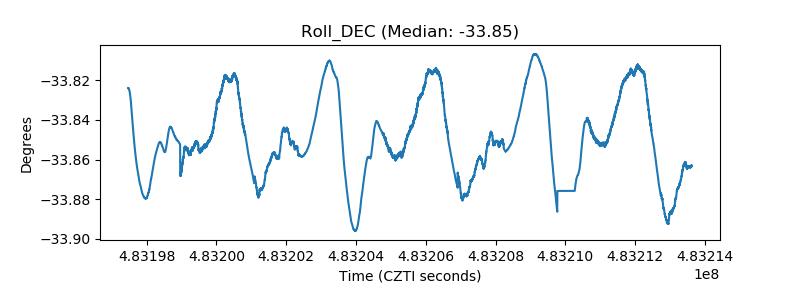 |
| _Roll_RA | 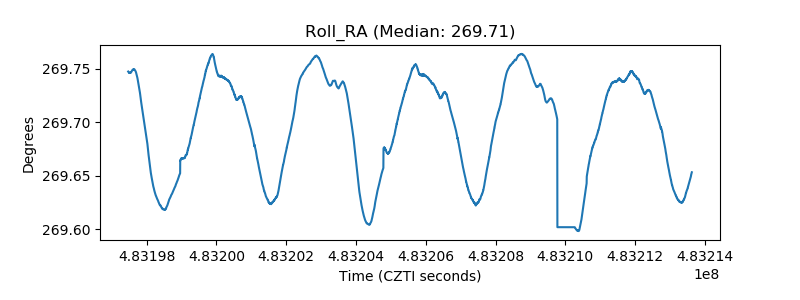 |
| Veto Counter | 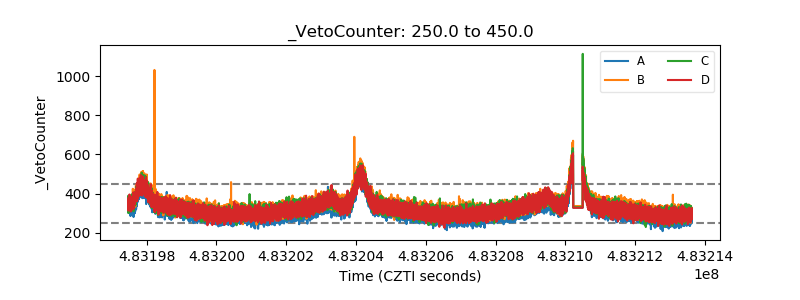 |