| Param | Original file | Final file |
|---|---|---|
| Filename | modeM0/AS1A13_090T01_9000006464_51780cztM0_level2.fits | modeM0/AS1A13_090T01_9000006464_51780cztM0_level2_quad_clean.evt |
| Size (bytes) | 1,015,007,040 | 144,351,360 |
| Size | 968.0 MB | 137.7 MB |
| Events in quadrant A | 6,911,551 | 990,088 |
| Events in quadrant B | 7,895,898 | 1,053,722 |
| Events in quadrant C | 6,725,865 | 948,269 |
| Events in quadrant D | 15,213,338 | 638,465 |
| Mode M9 | |||
|---|---|---|---|
| Quadrant | BADHDUFLAG | Total packets | Discarded packets |
| A | 0 | 13 | 0 |
| B | 0 | 13 | 0 |
| C | 0 | 13 | 0 |
| D | 0 | 13 | 0 |
| Mode SS | |||
|---|---|---|---|
| Quadrant | BADHDUFLAG | Total packets | Discarded packets |
| A | 0 | 218 | 0 |
| B | 0 | 218 | 0 |
| C | 0 | 218 | 0 |
| D | 0 | 218 | 0 |
| Mode M0 | |||
|---|---|---|---|
| Quadrant | BADHDUFLAG | Total packets | Discarded packets |
| A | 0 | 27846 | 2 |
| B | 0 | 30873 | 2 |
| C | 0 | 27228 | 2 |
| D | 0 | 52627 | 2 |
| Quadrant | Total seconds | Saturated seconds | Saturation percentage |
|---|---|---|---|
| A | 10682 | 184 | 1.722524% |
| B | 10683 | 450 | 4.212300% |
| C | 10683 | 238 | 2.227839% |
| D | 10683 | 3567 | 33.389497% |
Noise dominated data is calculated using 1-second bins in cleaned event files. If a bin has >2000 counts, and if more than 50% of those come from <1% of pixels, then it is considered to be noise-dominated and hence unusable.
| Quadrant | # 1 sec bins | Bins with >0 counts | Bins with >2000 counts | High rate bins dominated by noise | Noise dominated (total time) | Noise dominated (detector-on time) | Marked lightcurve |
|---|---|---|---|---|---|---|---|
| A | 12002 | 10684 | 122 | 122 | 1.02% | 1.14% | 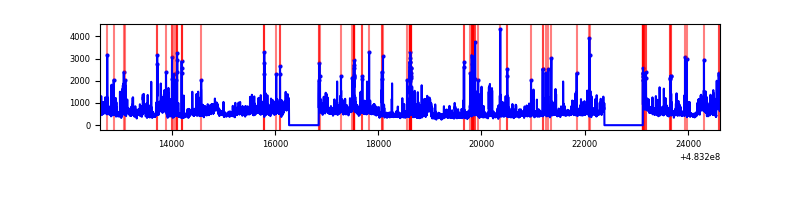 |
| B | 12003 | 10685 | 256 | 256 | 2.13% | 2.40% | 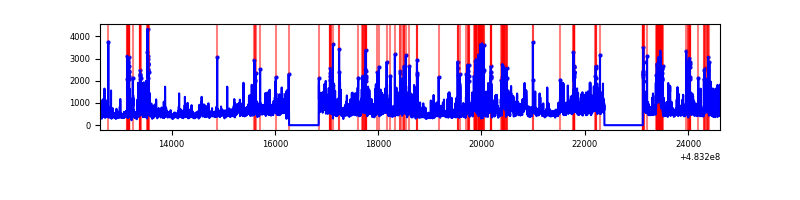 |
| C | 12003 | 10685 | 176 | 176 | 1.47% | 1.65% | 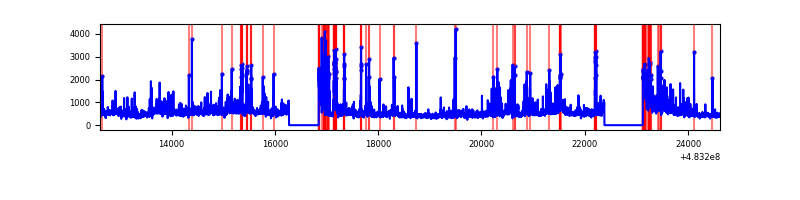 |
| D | 12003 | 10685 | 3203 | 3203 | 26.68% | 29.98% | 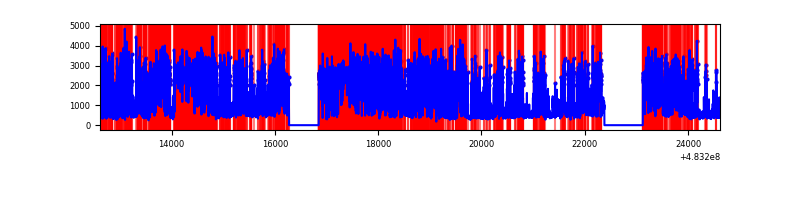 |
Top three noisy pixels from each quadrant. If the there are fewer than three noisy pixels in the level2.evt file, extra rows are filled as -1
| Pixel properties | Quadrant properties | ||||||
|---|---|---|---|---|---|---|---|
| Quadrant | DetID | PixID | Counts | Sigma | Mean | Median | Sigma |
| A | 3 | 14 | 612648 | 2180.28 | 1130 | 1103 | 280.5 |
| A | 12 | 3 | 372746 | 1324.98 | 1130 | 1103 | 280.5 |
| A | 2 | 143 | 195274 | 692.26 | 1130 | 1103 | 280.5 |
| B | 4 | 206 | 990981 | 4092.36 | 1118 | 1075 | 241.9 |
| B | 10 | 44 | 847000 | 3497.13 | 1118 | 1075 | 241.9 |
| B | 4 | 174 | 421686 | 1738.84 | 1118 | 1075 | 241.9 |
| C | 15 | 218 | 625248 | 2092.84 | 1100 | 1091 | 298.2 |
| C | 3 | 242 | 506692 | 1695.31 | 1100 | 1091 | 298.2 |
| C | 9 | 38 | 343524 | 1148.2 | 1100 | 1091 | 298.2 |
| D | 11 | 129 | 10580684 | 40493.33 | 926 | 892 | 261.3 |
| D | 3 | 12 | 558368 | 2133.7 | 926 | 892 | 261.3 |
| D | 8 | 176 | 117034 | 444.52 | 926 | 892 | 261.3 |
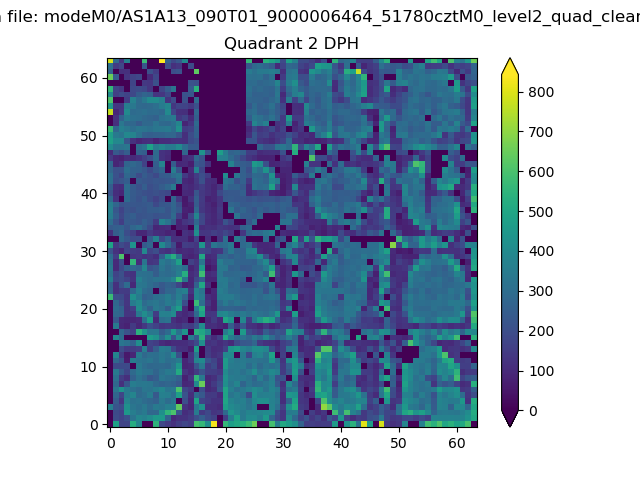
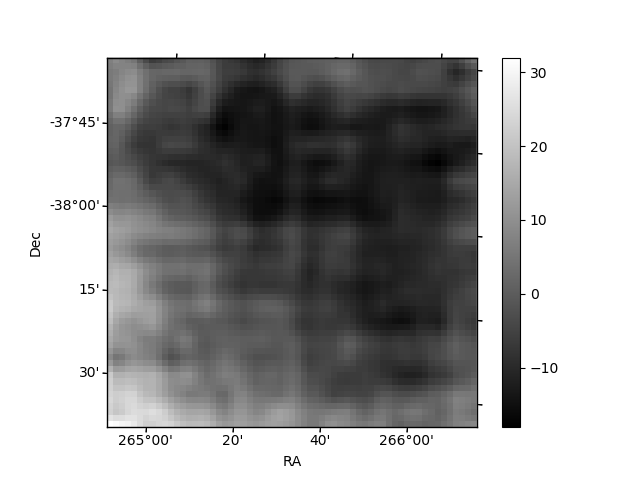
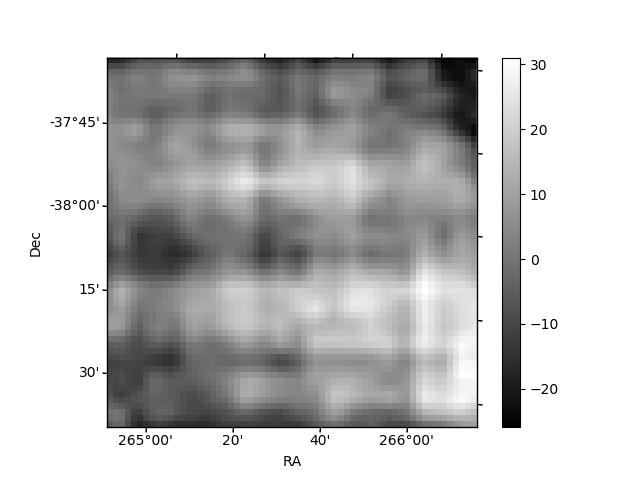
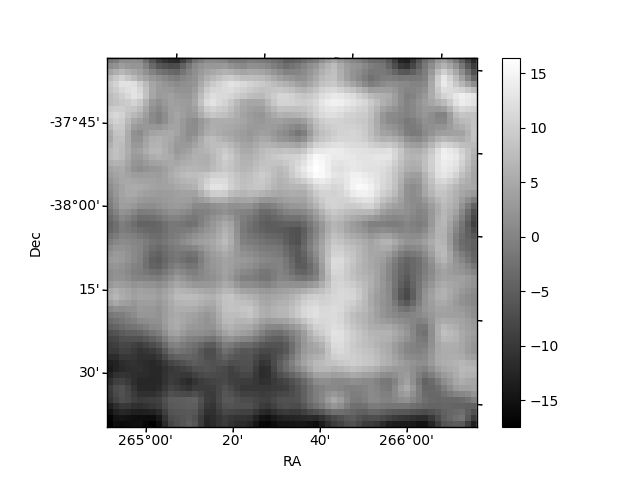
Histogram calculated using DETX and DETY for each event in the final _common_clean file
| Quadrant A | 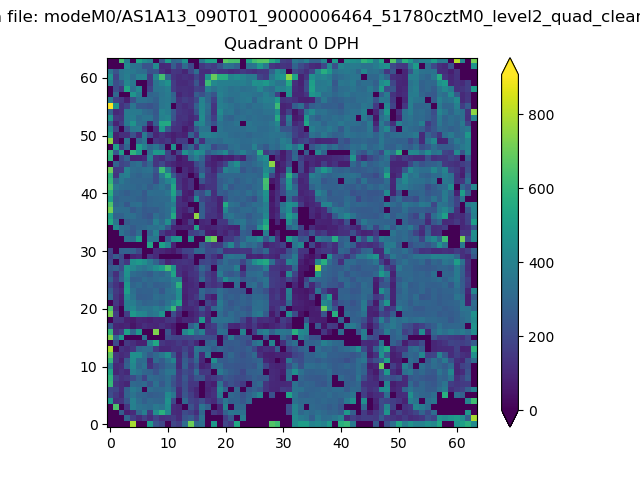 |
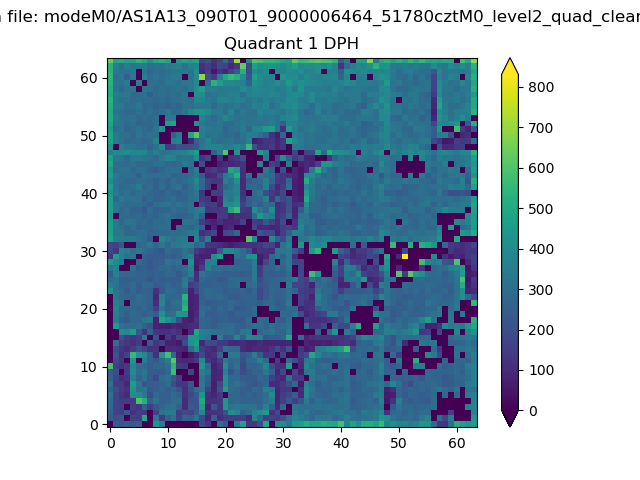 |
Quadrant B |
|---|---|---|---|
| Quadrant D | 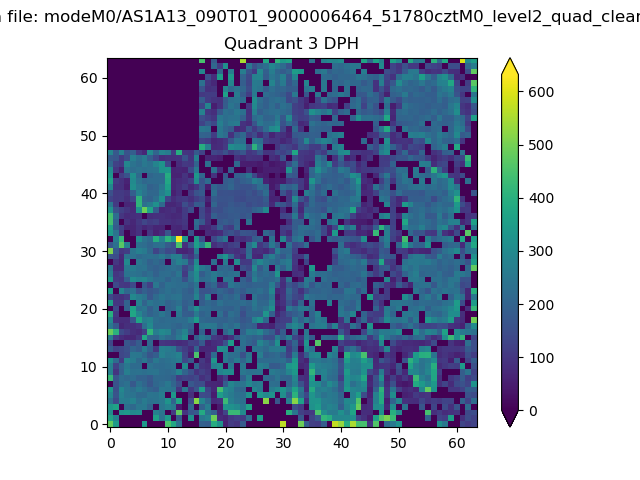 |
 |
Quadrant C |
| Plot type | Count rate plots | Images |
|---|---|---|
| Comparison with Poisson distribution Blue bars denote a histogram of data divided into 1 sec bins. Red curve is a Poisson curve with rate = median count rate of data. |
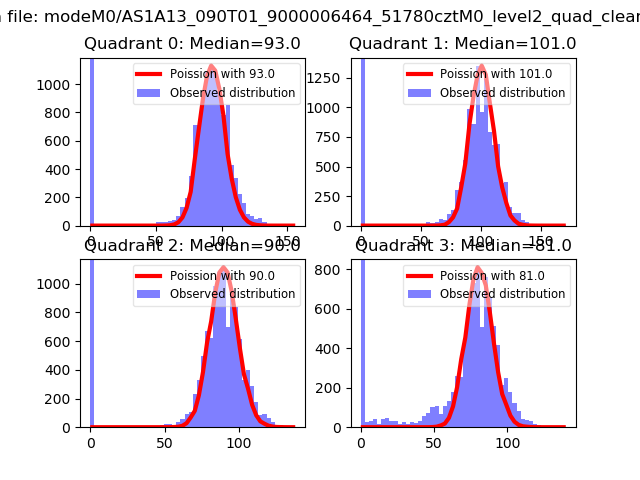 |
 |
| Quadrant-wise count rates Data is divided into 100 sec bins |
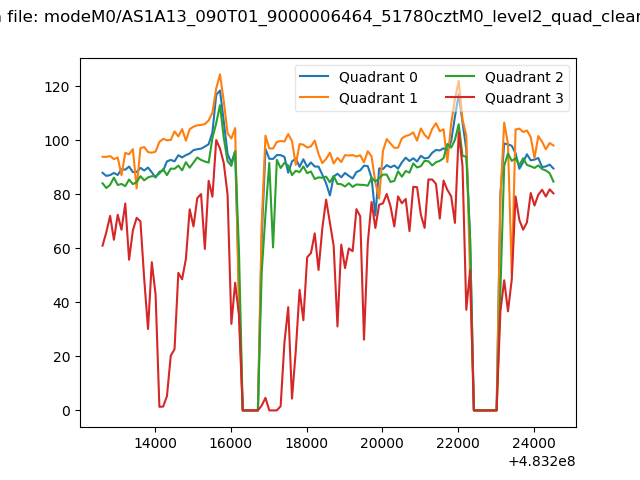 |
|
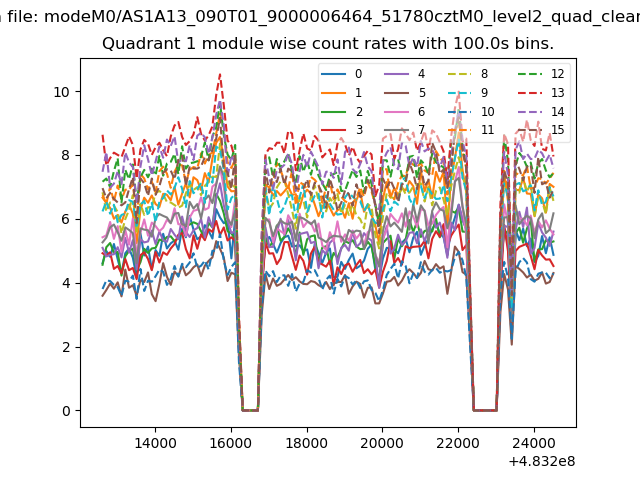
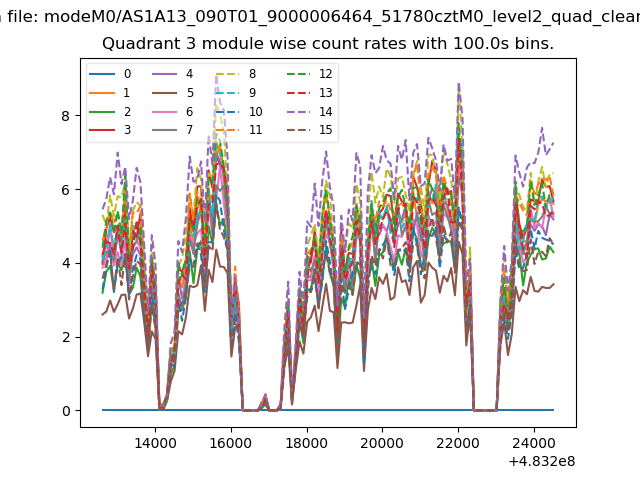
| Module-wise count rates for Quadrant A Data is divided into 100 sec bins |
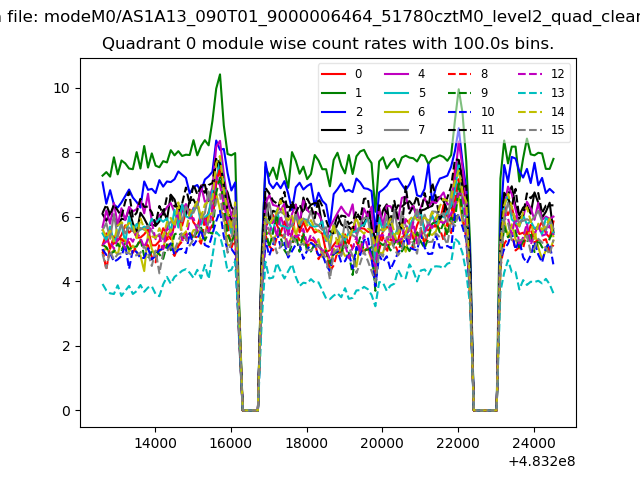 |
 |
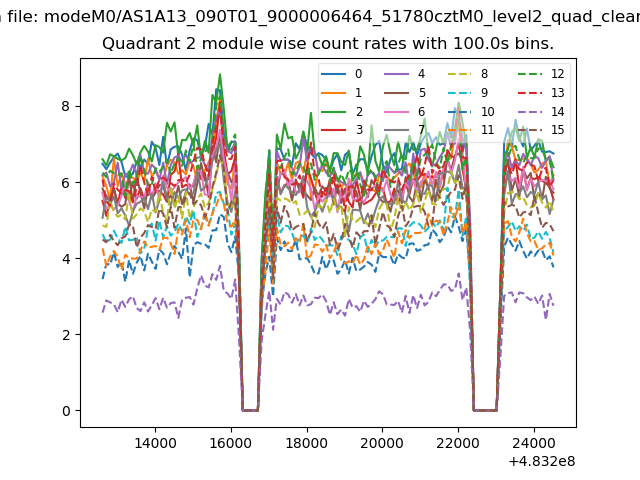
| Module-wise count rates for Quadrant B Data is divided into 100 sec bins |
 |
 |
| Module-wise count rates for Quadrant C Data is divided into 100 sec bins |
 |
 |
| Module-wise count rates for Quadrant D Data is divided into 100 sec bins |
 |
 |
| Parameter | Plot |
|---|---|
| CZT HV Monitor | 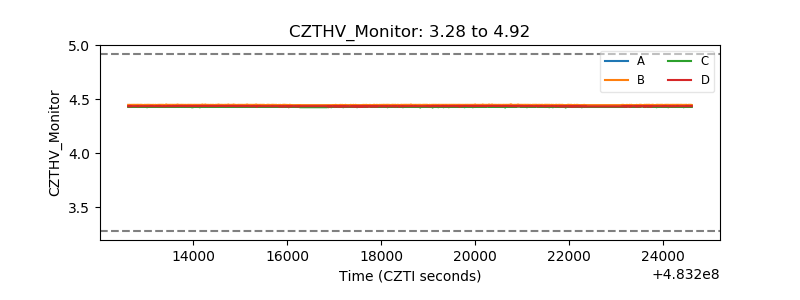 |
| D_VDD | 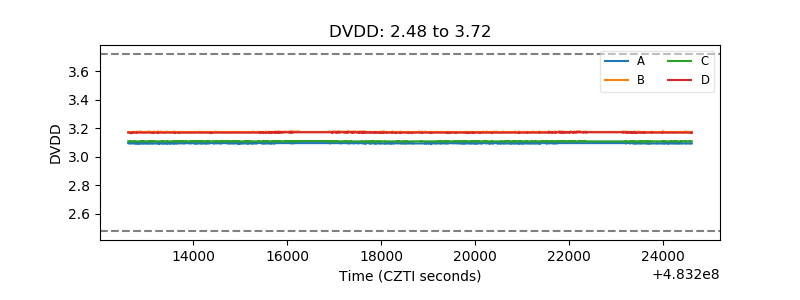 |
| Temperature 1 | 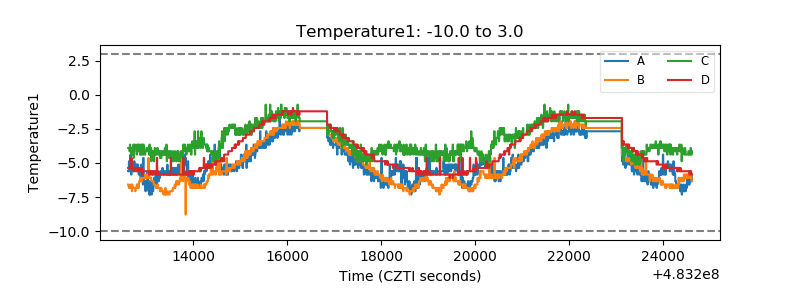 |
| Veto HV Monitor | 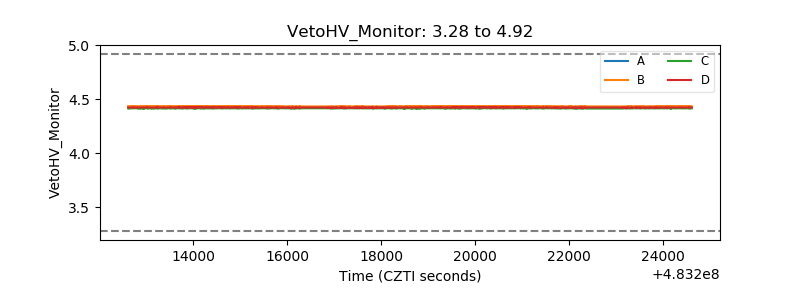 |
| Veto LLD | 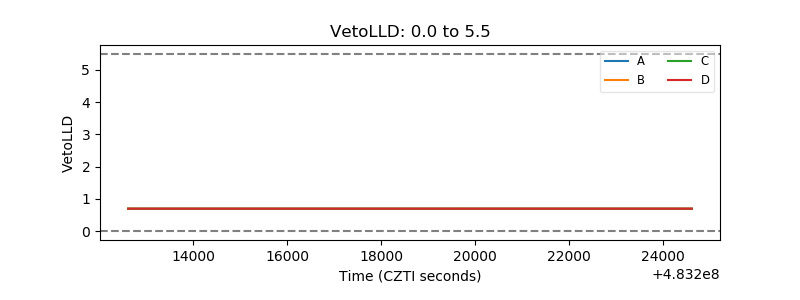 |
| Alpha Counter | 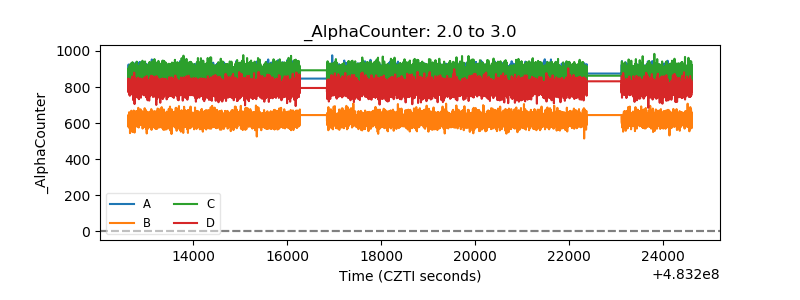 |
| _CPM_Rate | 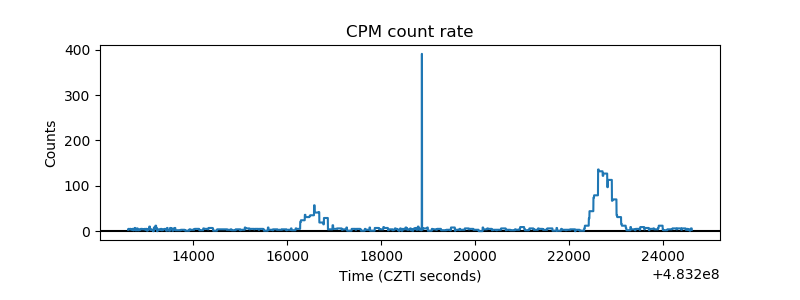 |
| CZT Counter | 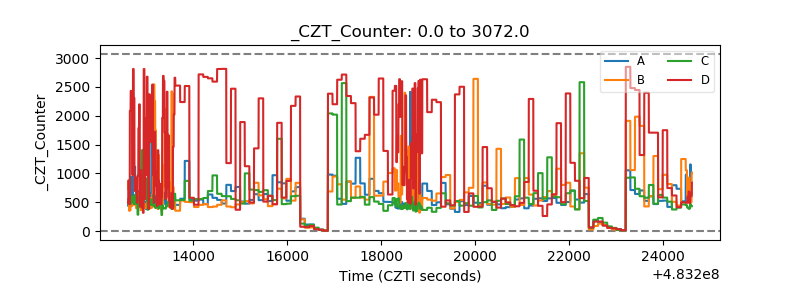 |
| +2.5 Volts monitor | 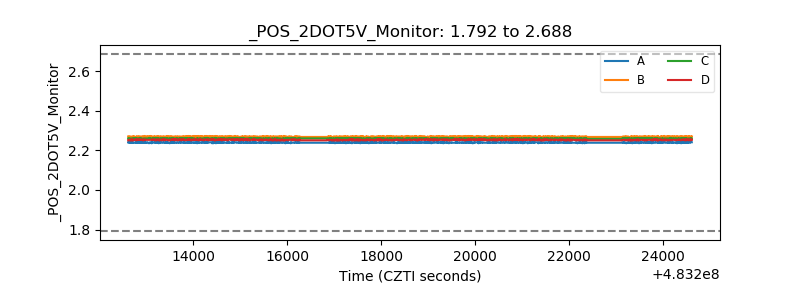 |
| +5 Volts monitor | 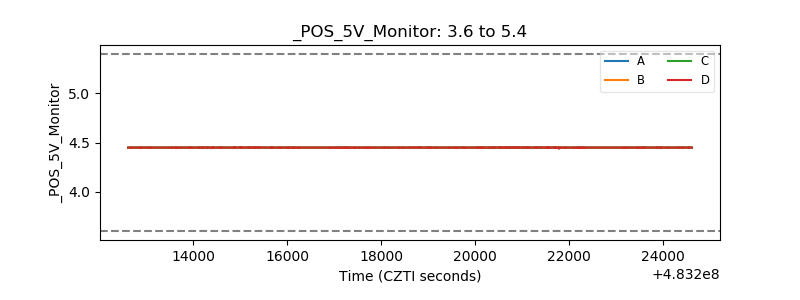 |
| _ROLL_ROT | 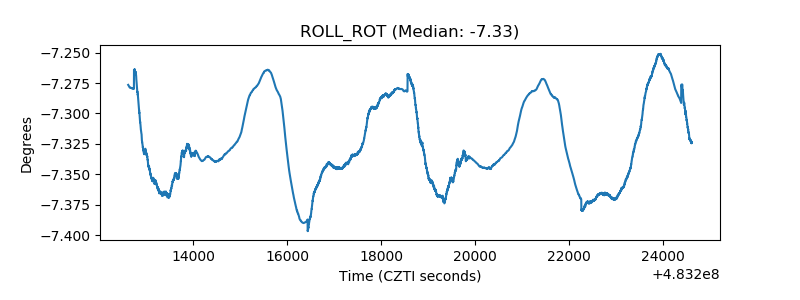 |
| _Roll_DEC | 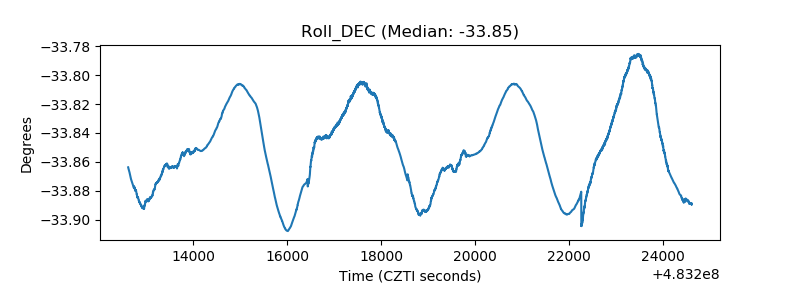 |
| _Roll_RA | 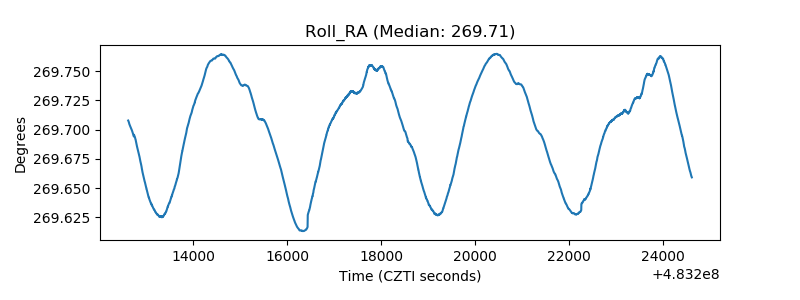 |
| Veto Counter | 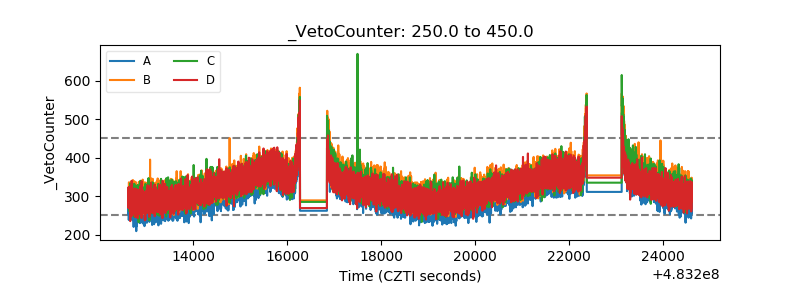 |