| Param | Original file | Final file |
|---|---|---|
| Filename | modeM0/AS1A13_090T01_9000006464_51781cztM0_level2.fits | modeM0/AS1A13_090T01_9000006464_51781cztM0_level2_quad_clean.evt |
| Size (bytes) | 657,760,320 | 101,194,560 |
| Size | 627.3 MB | 96.5 MB |
| Events in quadrant A | 5,036,773 | 682,032 |
| Events in quadrant B | 5,655,646 | 717,558 |
| Events in quadrant C | 4,418,891 | 646,453 |
| Events in quadrant D | 8,675,379 | 512,568 |
| Mode M9 | |||
|---|---|---|---|
| Quadrant | BADHDUFLAG | Total packets | Discarded packets |
| A | 0 | 16 | 0 |
| B | 0 | 16 | 0 |
| C | 0 | 16 | 0 |
| D | 0 | 16 | 0 |
| Mode SS | |||
|---|---|---|---|
| Quadrant | BADHDUFLAG | Total packets | Discarded packets |
| A | 0 | 150 | 0 |
| B | 0 | 150 | 0 |
| C | 0 | 150 | 0 |
| D | 0 | 150 | 0 |
| Mode M0 | |||
|---|---|---|---|
| Quadrant | BADHDUFLAG | Total packets | Discarded packets |
| A | 0 | 19888 | 2 |
| B | 0 | 21725 | 2 |
| C | 0 | 18141 | 2 |
| D | 0 | 30835 | 2 |
| Quadrant | Total seconds | Saturated seconds | Saturation percentage |
|---|---|---|---|
| A | 7253 | 91 | 1.254653% |
| B | 7254 | 433 | 5.969120% |
| C | 7254 | 221 | 3.046595% |
| D | 7254 | 1556 | 21.450234% |
Noise dominated data is calculated using 1-second bins in cleaned event files. If a bin has >2000 counts, and if more than 50% of those come from <1% of pixels, then it is considered to be noise-dominated and hence unusable.
| Quadrant | # 1 sec bins | Bins with >0 counts | Bins with >2000 counts | High rate bins dominated by noise | Noise dominated (total time) | Noise dominated (detector-on time) | Marked lightcurve |
|---|---|---|---|---|---|---|---|
| A | 8933 | 7255 | 52 | 52 | 0.58% | 0.72% | 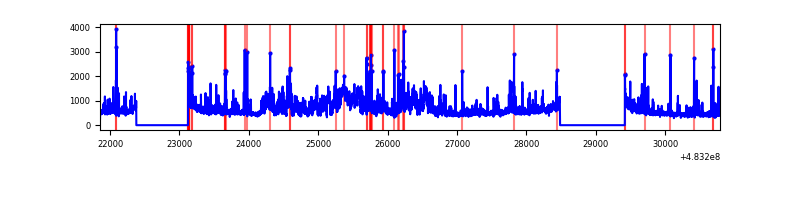 |
| B | 8934 | 7256 | 252 | 252 | 2.82% | 3.47% | 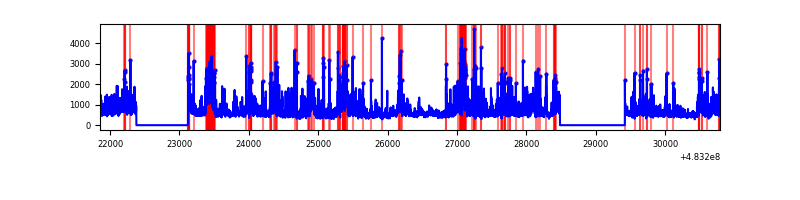 |
| C | 8934 | 7256 | 163 | 163 | 1.82% | 2.25% | 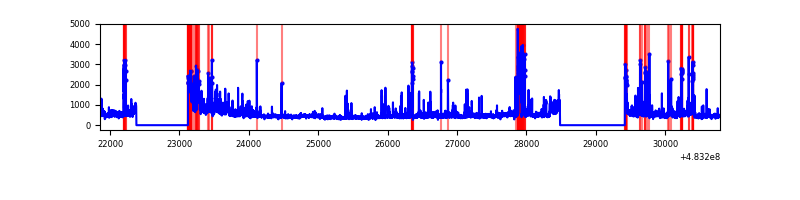 |
| D | 8933 | 7254 | 1421 | 1421 | 15.91% | 19.59% | 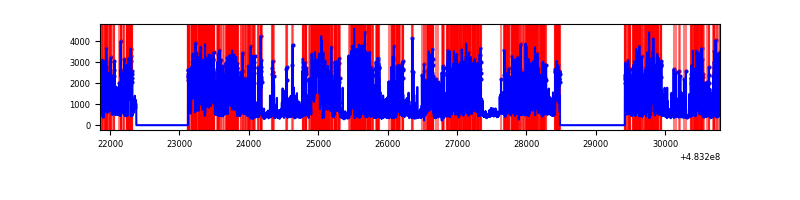 |
Top three noisy pixels from each quadrant. If the there are fewer than three noisy pixels in the level2.evt file, extra rows are filled as -1
| Pixel properties | Quadrant properties | ||||||
|---|---|---|---|---|---|---|---|
| Quadrant | DetID | PixID | Counts | Sigma | Mean | Median | Sigma |
| A | 12 | 3 | 914123 | 4774.67 | 779 | 760 | 191.3 |
| A | 3 | 14 | 148069 | 770.07 | 779 | 760 | 191.3 |
| A | 2 | 143 | 130542 | 678.44 | 779 | 760 | 191.3 |
| B | 4 | 206 | 1116075 | 6746.38 | 767 | 741 | 165.3 |
| B | 4 | 174 | 447907 | 2704.8 | 767 | 741 | 165.3 |
| B | 10 | 44 | 276174 | 1666.03 | 767 | 741 | 165.3 |
| C | 9 | 38 | 210401 | 1015.94 | 758 | 753 | 206.4 |
| C | 15 | 218 | 191340 | 923.57 | 758 | 753 | 206.4 |
| C | 14 | 245 | 165631 | 798.99 | 758 | 753 | 206.4 |
| D | 11 | 129 | 4483307 | 23389.9 | 684 | 659 | 191.6 |
| D | 3 | 12 | 1096967 | 5720.4 | 684 | 659 | 191.6 |
| D | 8 | 176 | 103788 | 538.11 | 684 | 659 | 191.6 |
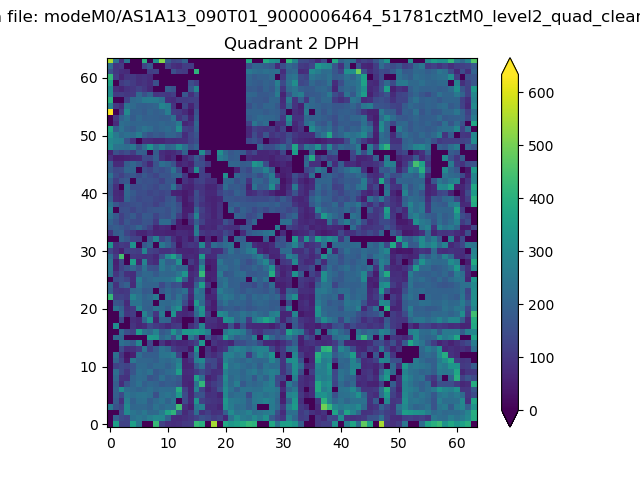
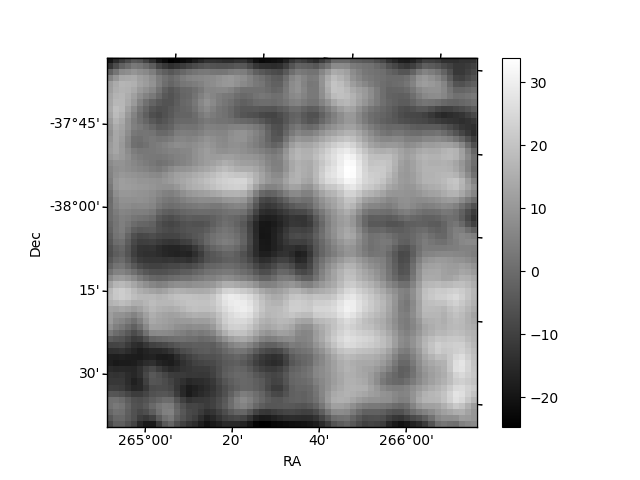
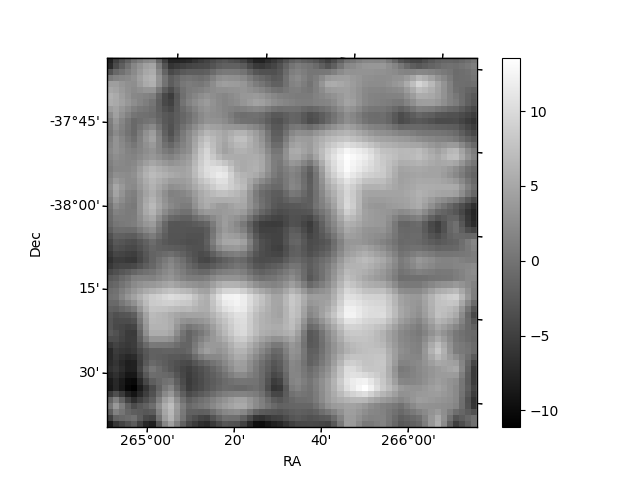
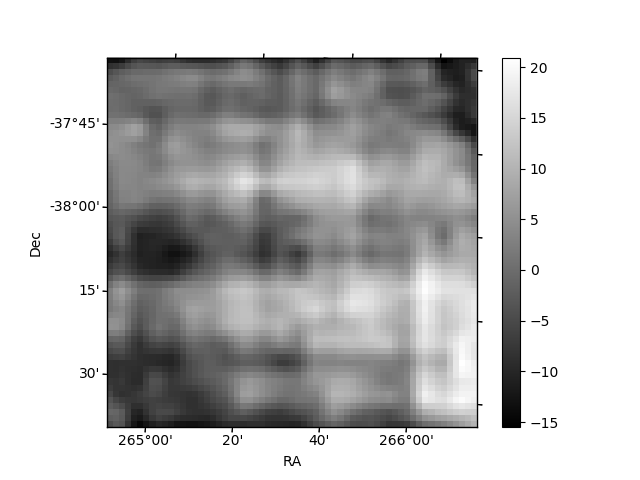
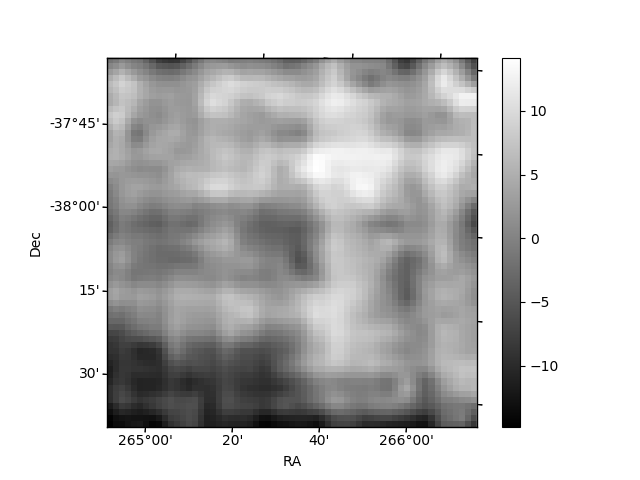
Histogram calculated using DETX and DETY for each event in the final _common_clean file
| Quadrant A | 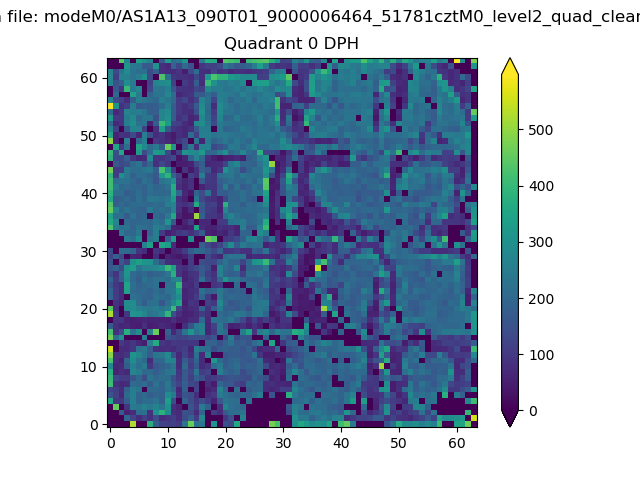 |
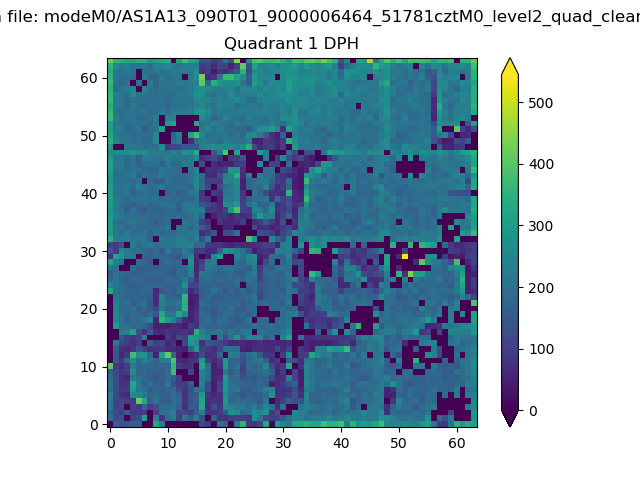 |
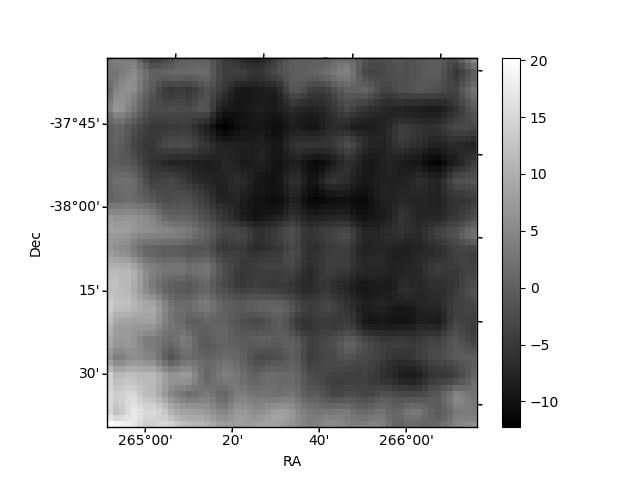
Quadrant B |
|---|---|---|---|
| Quadrant D | 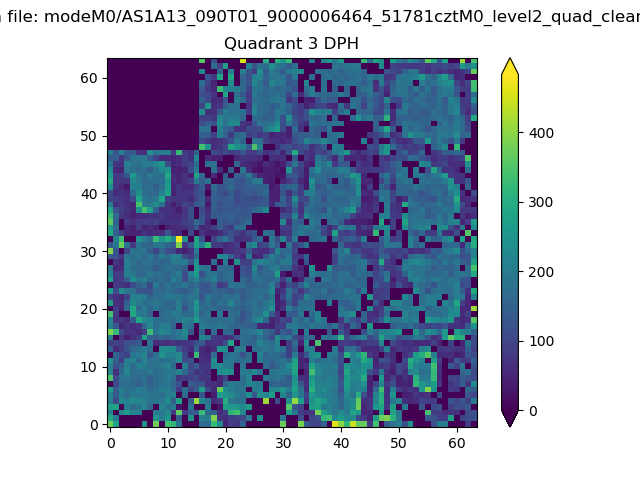 |
 |
Quadrant C |
| Plot type | Count rate plots | Images |
|---|---|---|
| Comparison with Poisson distribution Blue bars denote a histogram of data divided into 1 sec bins. Red curve is a Poisson curve with rate = median count rate of data. |
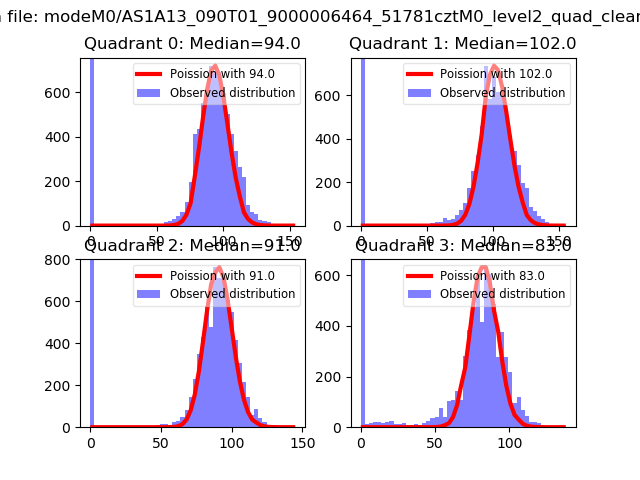 |
 |
| Quadrant-wise count rates Data is divided into 100 sec bins |
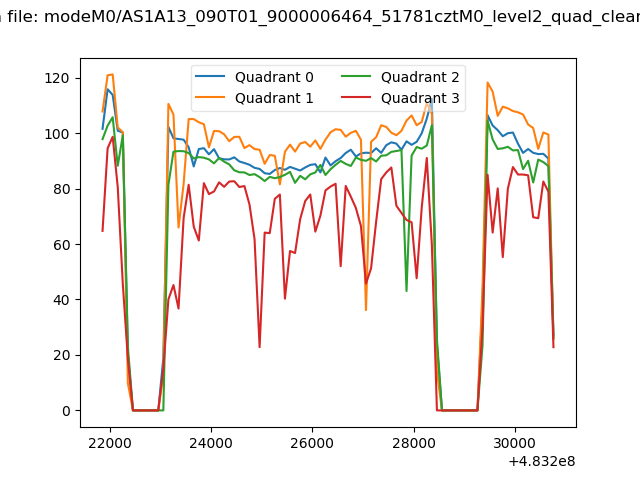 |
|
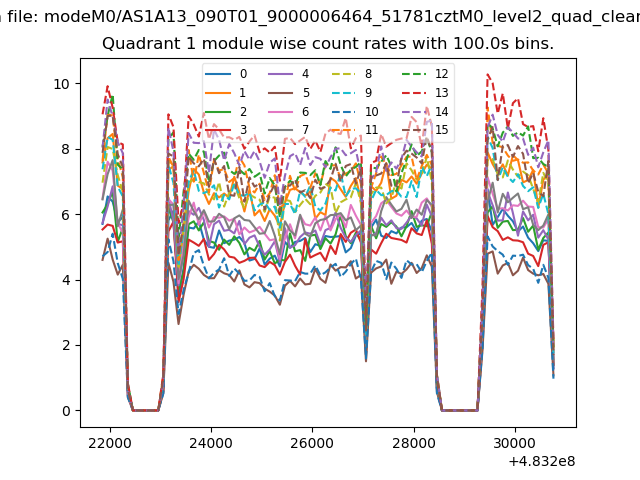
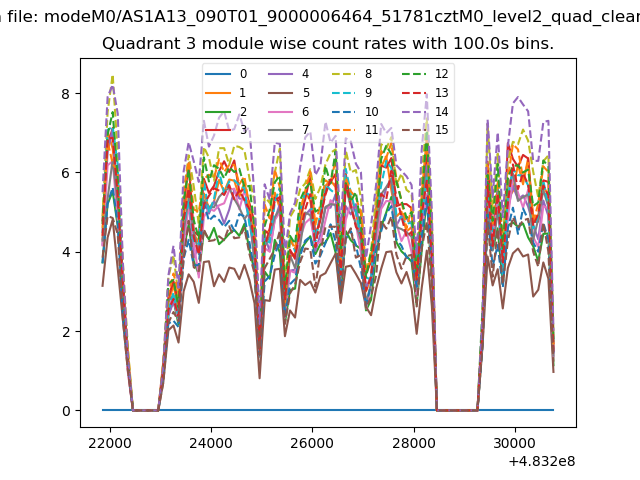
| Module-wise count rates for Quadrant A Data is divided into 100 sec bins |
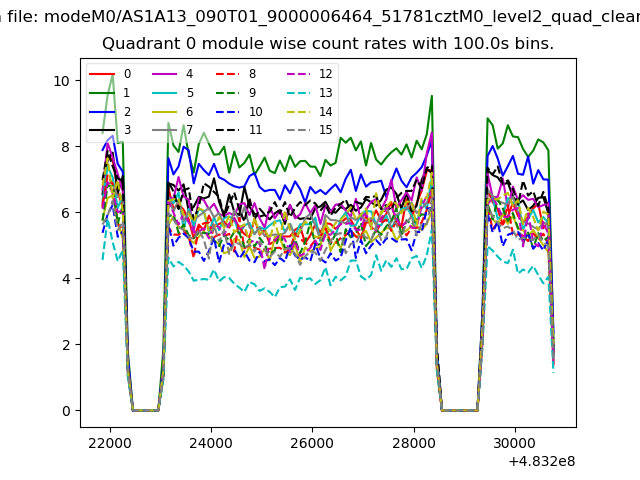 |
 |
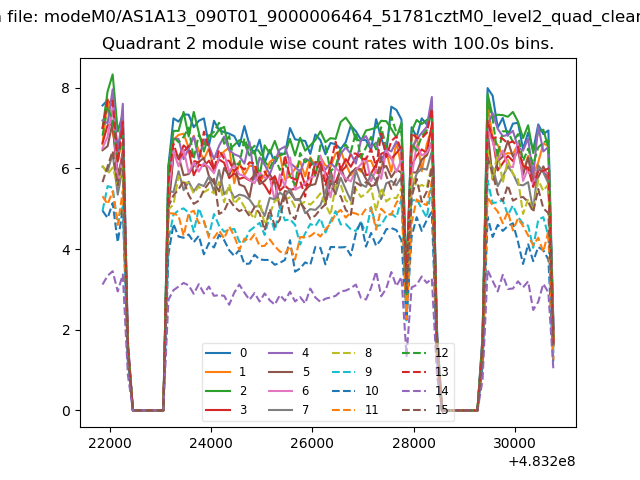
| Module-wise count rates for Quadrant B Data is divided into 100 sec bins |
 |
 |
| Module-wise count rates for Quadrant C Data is divided into 100 sec bins |
 |
 |
| Module-wise count rates for Quadrant D Data is divided into 100 sec bins |
 |
 |
| Parameter | Plot |
|---|---|
| CZT HV Monitor | 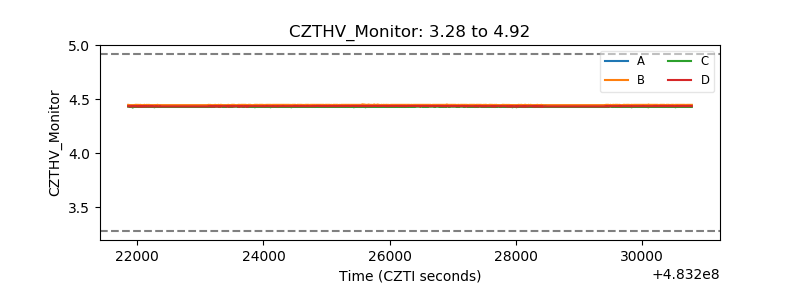 |
| D_VDD | 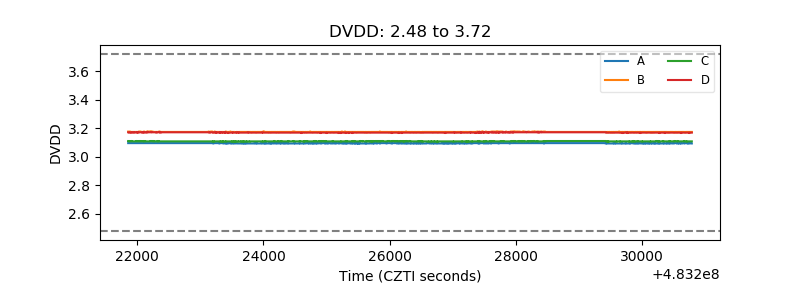 |
| Temperature 1 | 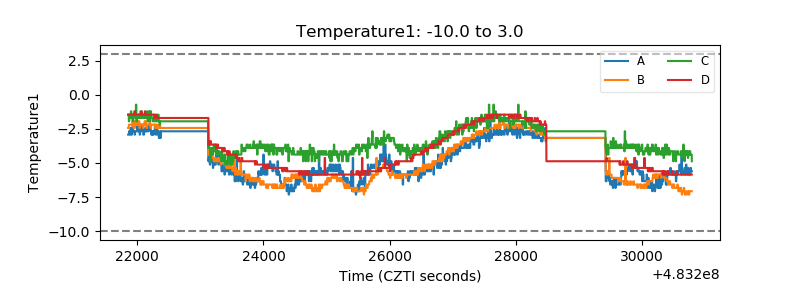 |
| Veto HV Monitor |  |
| Veto LLD | 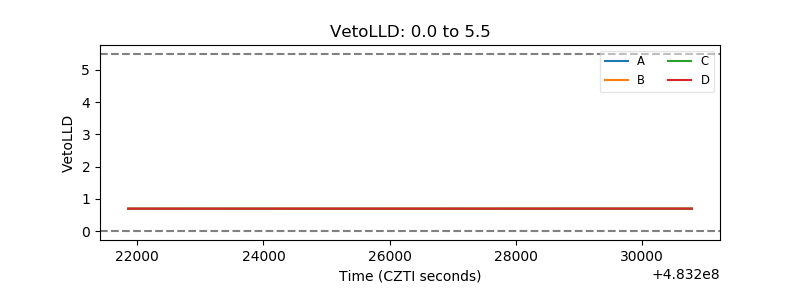 |
| Alpha Counter | 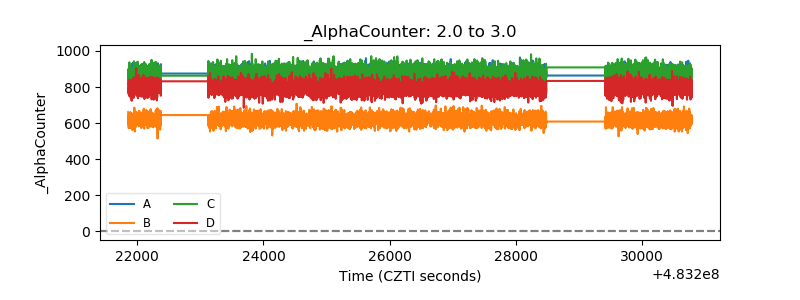 |
| _CPM_Rate | 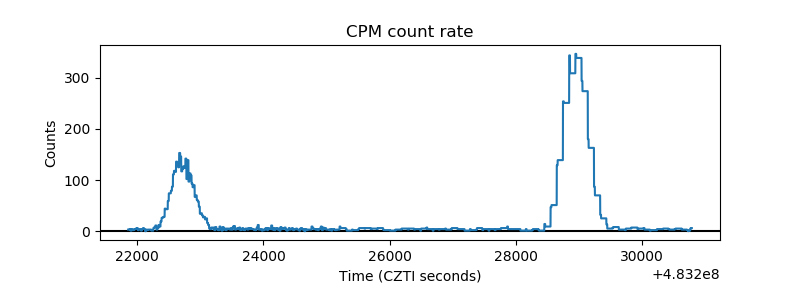 |
| CZT Counter | 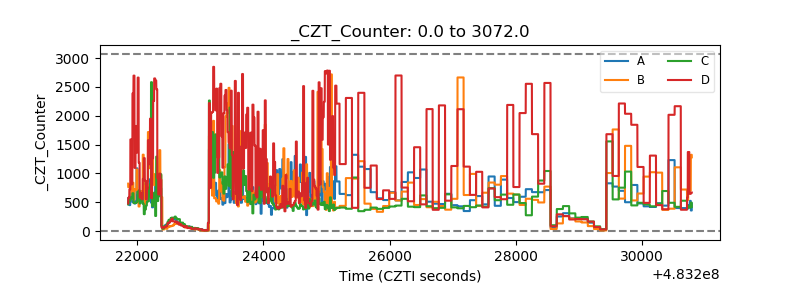 |
| +2.5 Volts monitor | 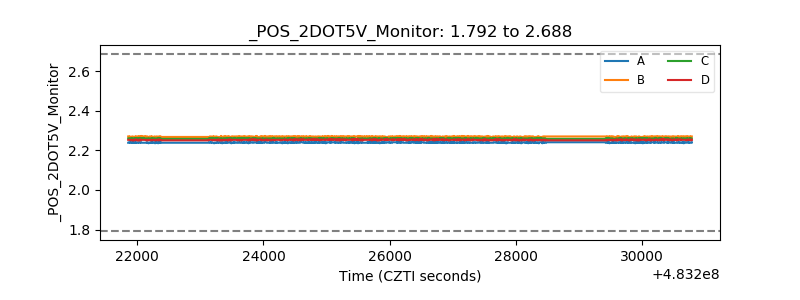 |
| +5 Volts monitor | 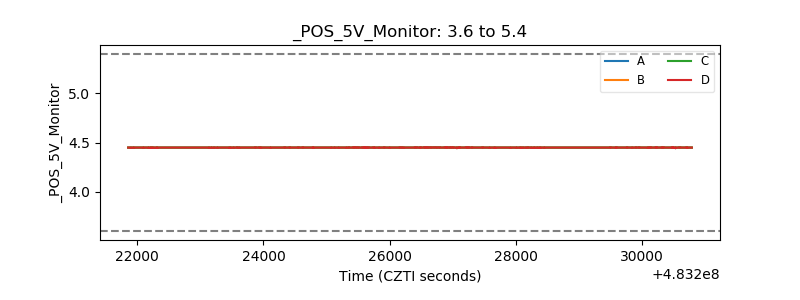 |
| _ROLL_ROT | 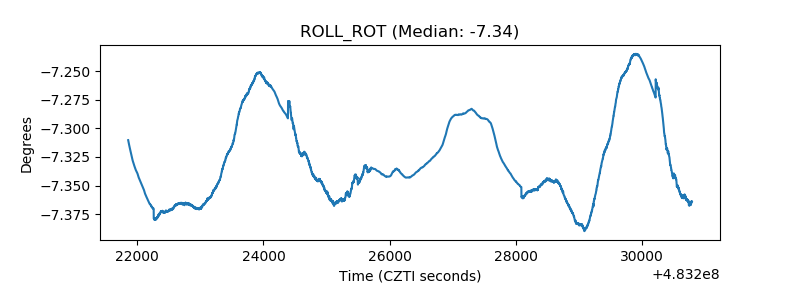 |
| _Roll_DEC | 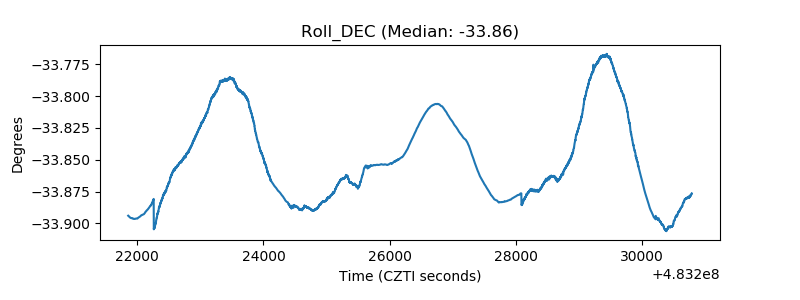 |
| _Roll_RA | 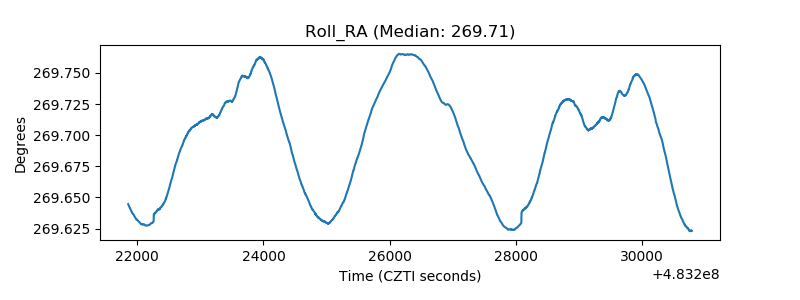 |
| Veto Counter | 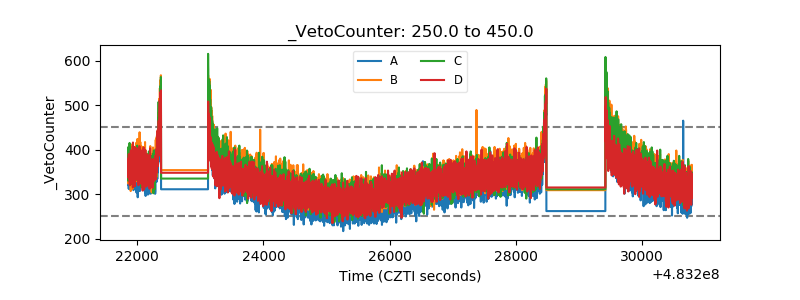 |