| Param | Original file | Final file |
|---|---|---|
| Filename | modeM0/AS1A13_090T01_9000006464_51783cztM0_level2.fits | modeM0/AS1A13_090T01_9000006464_51783cztM0_level2_quad_clean.evt |
| Size (bytes) | 644,391,360 | 97,286,400 |
| Size | 614.5 MB | 92.8 MB |
| Events in quadrant A | 5,311,292 | 626,176 |
| Events in quadrant B | 4,710,996 | 718,801 |
| Events in quadrant C | 4,724,531 | 625,601 |
| Events in quadrant D | 8,564,780 | 488,058 |
| Mode M9 | |||
|---|---|---|---|
| Quadrant | BADHDUFLAG | Total packets | Discarded packets |
| A | 0 | 20 | 0 |
| B | 0 | 20 | 0 |
| C | 0 | 20 | 0 |
| D | 0 | 20 | 0 |
| Mode SS | |||
|---|---|---|---|
| Quadrant | BADHDUFLAG | Total packets | Discarded packets |
| A | 0 | 144 | 0 |
| B | 0 | 144 | 0 |
| C | 0 | 144 | 0 |
| D | 0 | 144 | 0 |
| Mode M0 | |||
|---|---|---|---|
| Quadrant | BADHDUFLAG | Total packets | Discarded packets |
| A | 0 | 20526 | 2 |
| B | 0 | 18785 | 2 |
| C | 0 | 18659 | 2 |
| D | 0 | 30325 | 3 |
| Quadrant | Total seconds | Saturated seconds | Saturation percentage |
|---|---|---|---|
| A | 6990 | 518 | 7.410587% |
| B | 6990 | 210 | 3.004292% |
| C | 6990 | 307 | 4.391989% |
| D | 6990 | 1647 | 23.562232% |
Noise dominated data is calculated using 1-second bins in cleaned event files. If a bin has >2000 counts, and if more than 50% of those come from <1% of pixels, then it is considered to be noise-dominated and hence unusable.
| Quadrant | # 1 sec bins | Bins with >0 counts | Bins with >2000 counts | High rate bins dominated by noise | Noise dominated (total time) | Noise dominated (detector-on time) | Marked lightcurve |
|---|---|---|---|---|---|---|---|
| A | 8970 | 6992 | 481 | 481 | 5.36% | 6.88% | 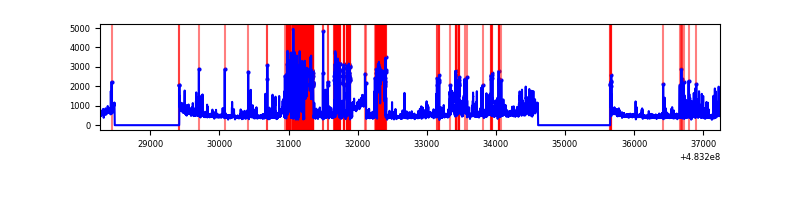 |
| B | 8970 | 6992 | 106 | 106 | 1.18% | 1.52% | 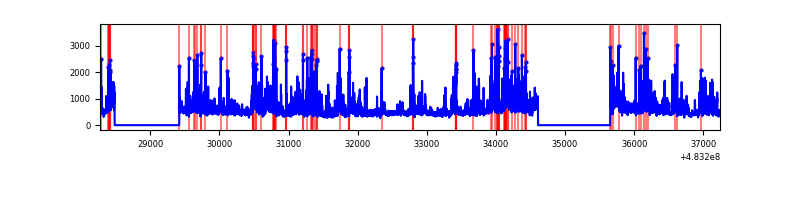 |
| C | 8970 | 6992 | 271 | 271 | 3.02% | 3.88% | 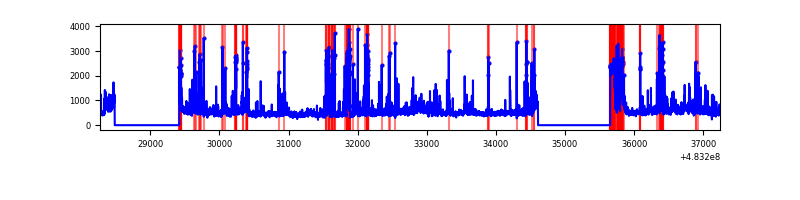 |
| D | 8970 | 6990 | 1497 | 1497 | 16.69% | 21.42% | 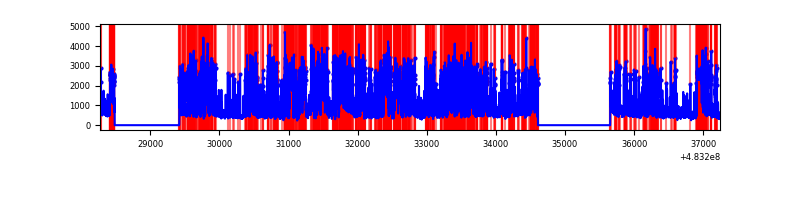 |
Top three noisy pixels from each quadrant. If the there are fewer than three noisy pixels in the level2.evt file, extra rows are filled as -1
| Pixel properties | Quadrant properties | ||||||
|---|---|---|---|---|---|---|---|
| Quadrant | DetID | PixID | Counts | Sigma | Mean | Median | Sigma |
| A | 15 | 174 | 1420433 | 7945.81 | 729 | 712 | 178.7 |
| A | 3 | 14 | 226337 | 1262.76 | 729 | 712 | 178.7 |
| A | 11 | 3 | 108637 | 604.03 | 729 | 712 | 178.7 |
| B | 4 | 206 | 816170 | 5082.15 | 745 | 716 | 160.5 |
| B | 4 | 174 | 258034 | 1603.68 | 745 | 716 | 160.5 |
| B | 0 | 171 | 226865 | 1409.43 | 745 | 716 | 160.5 |
| C | 15 | 218 | 383563 | 1919.93 | 722 | 718 | 199.4 |
| C | 14 | 245 | 357410 | 1788.78 | 722 | 718 | 199.4 |
| C | 9 | 38 | 341546 | 1709.22 | 722 | 718 | 199.4 |
| D | 11 | 129 | 5161821 | 28594.84 | 642 | 617 | 180.5 |
| D | 3 | 12 | 344369 | 1904.5 | 642 | 617 | 180.5 |
| D | 2 | 120 | 262848 | 1452.85 | 642 | 617 | 180.5 |
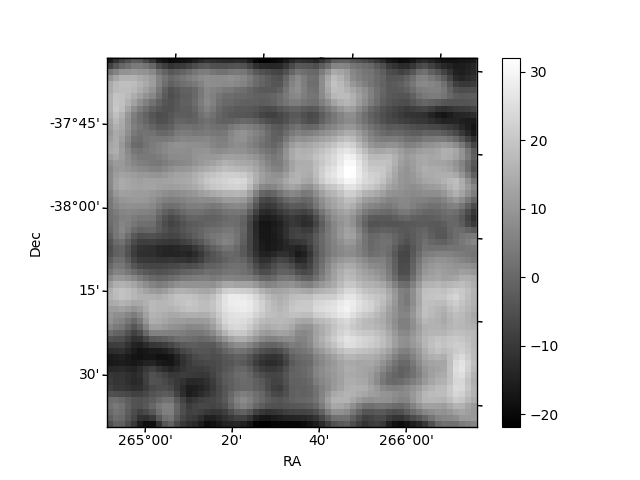
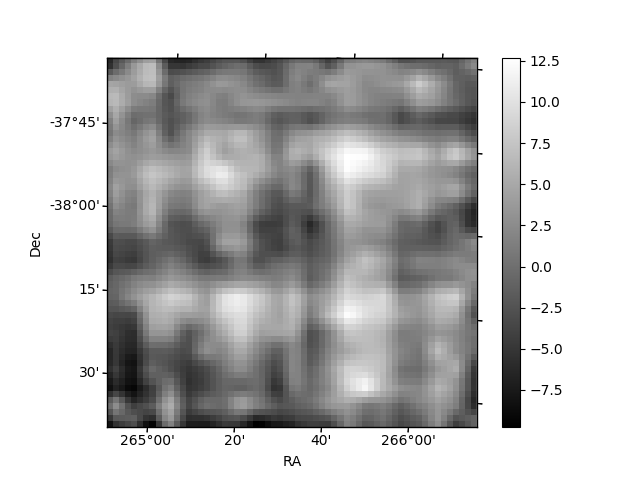
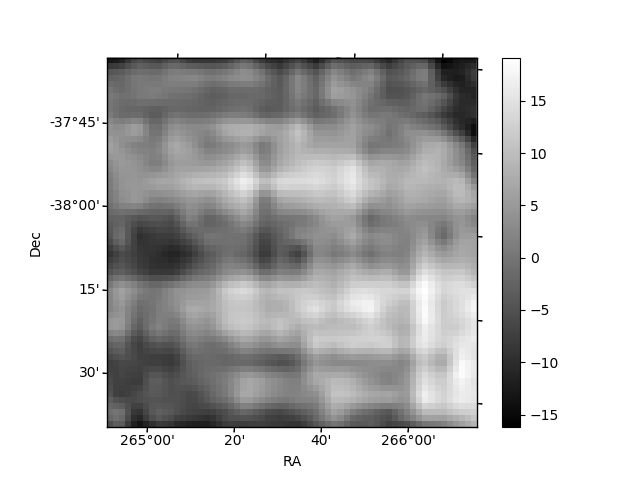
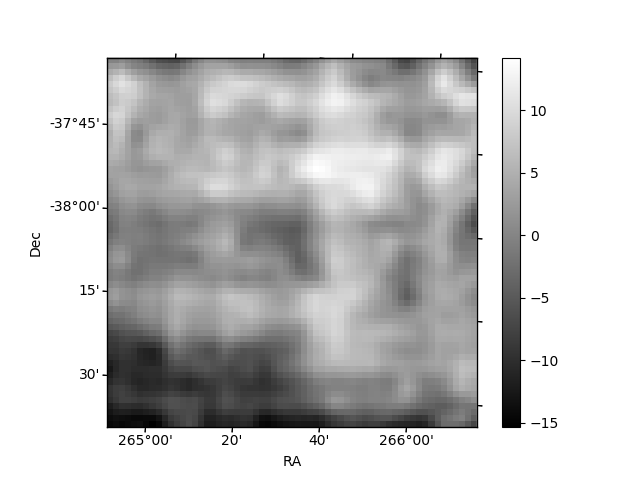
Histogram calculated using DETX and DETY for each event in the final _common_clean file
| Quadrant A | 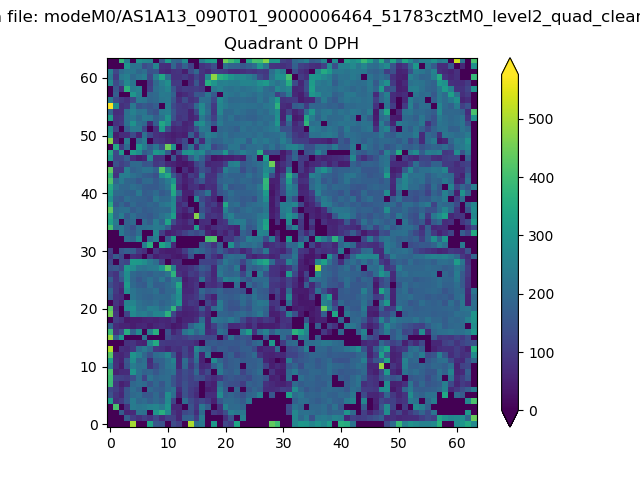 |
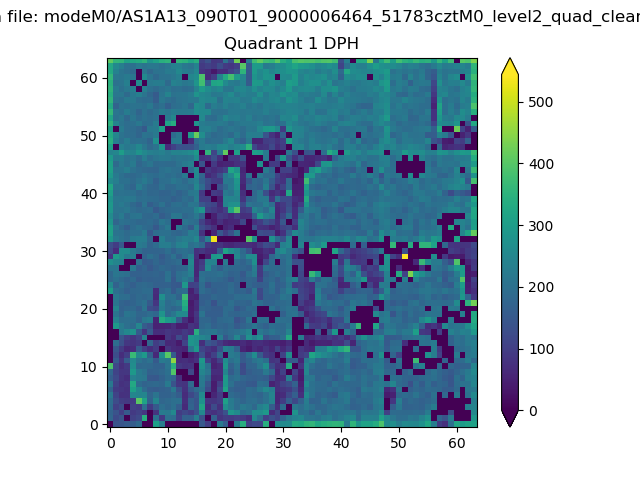 |
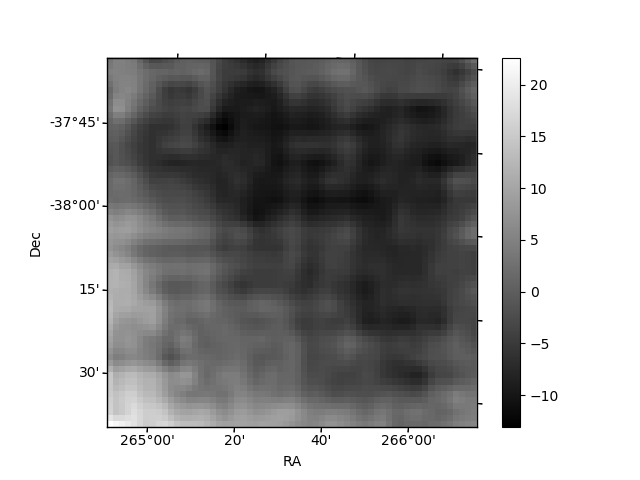
Quadrant B |
|---|---|---|---|
| Quadrant D | 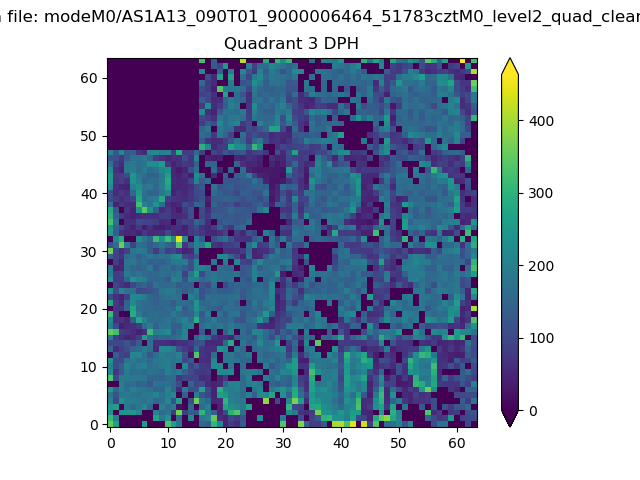 |
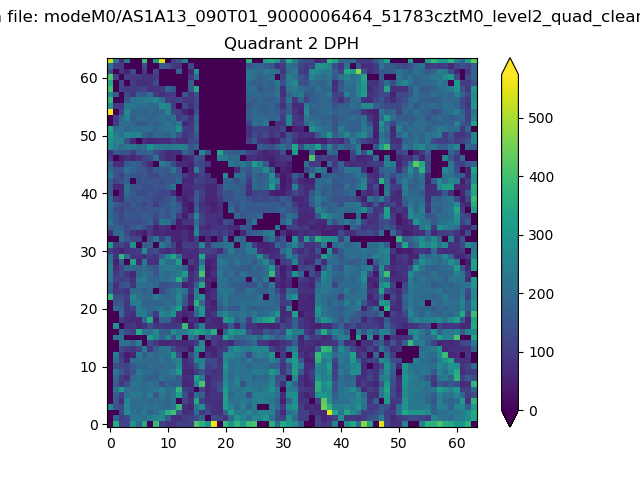 |
Quadrant C |
| Plot type | Count rate plots | Images |
|---|---|---|
| Comparison with Poisson distribution Blue bars denote a histogram of data divided into 1 sec bins. Red curve is a Poisson curve with rate = median count rate of data. |
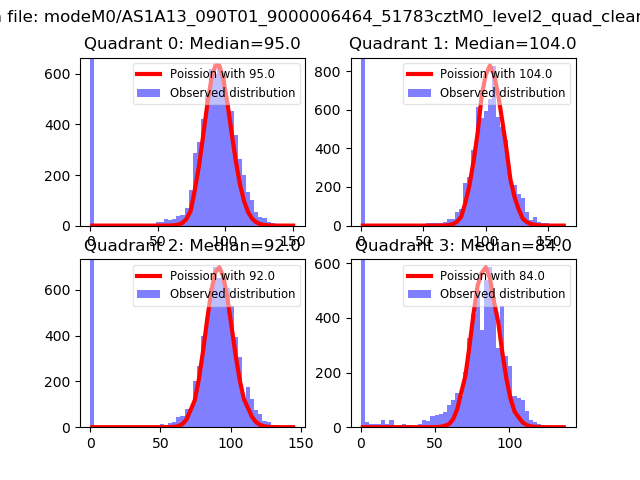 |
 |
| Quadrant-wise count rates Data is divided into 100 sec bins |
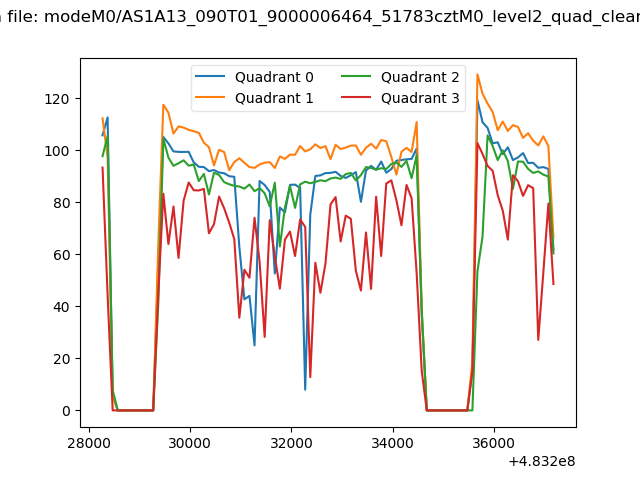 |
|
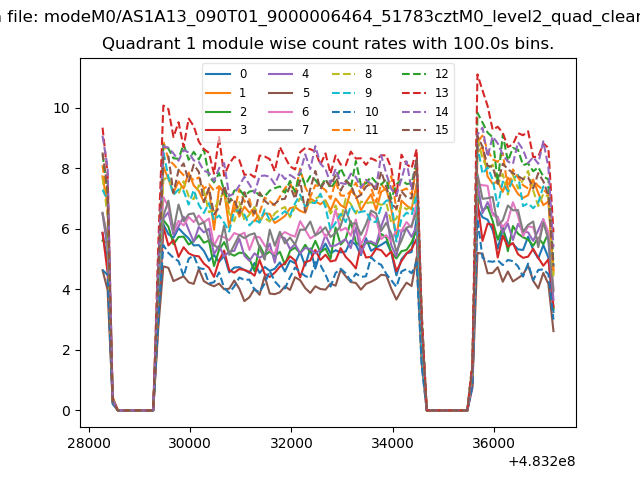
| Module-wise count rates for Quadrant A Data is divided into 100 sec bins |
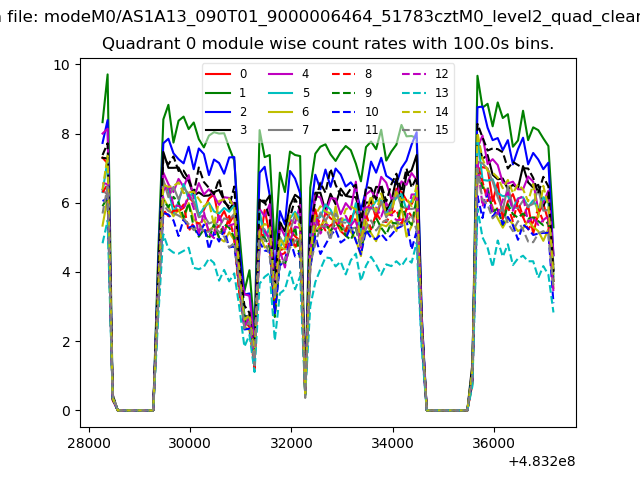 |
 |
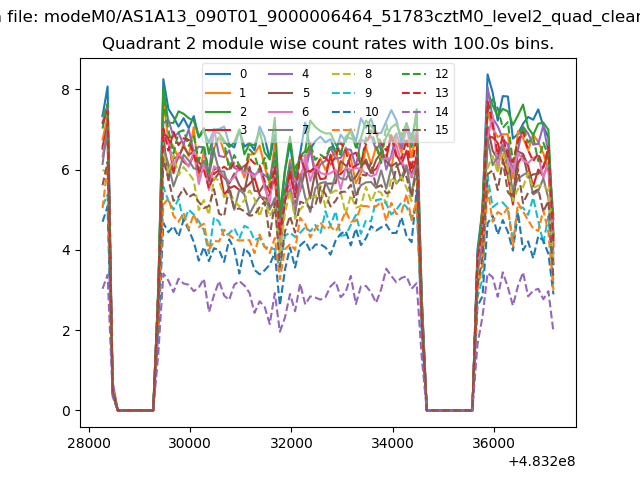
| Module-wise count rates for Quadrant B Data is divided into 100 sec bins |
 |
 |
| Module-wise count rates for Quadrant C Data is divided into 100 sec bins |
 |
 |
| Module-wise count rates for Quadrant D Data is divided into 100 sec bins |
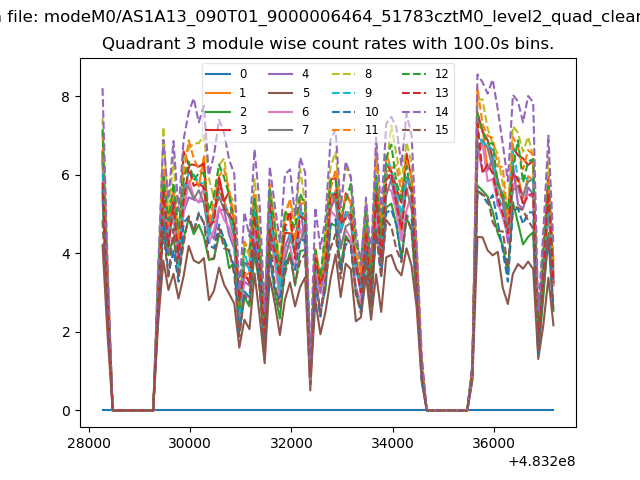 |
 |
| Parameter | Plot |
|---|---|
| CZT HV Monitor | 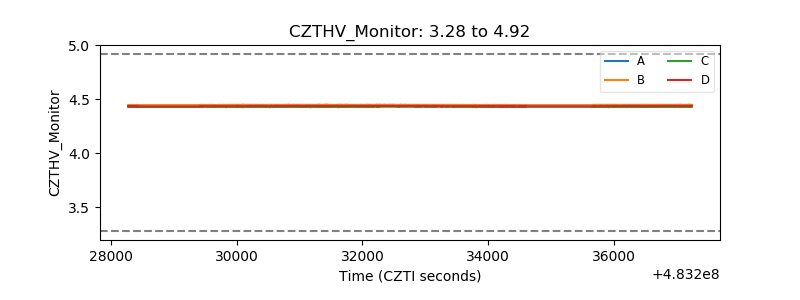 |
| D_VDD | 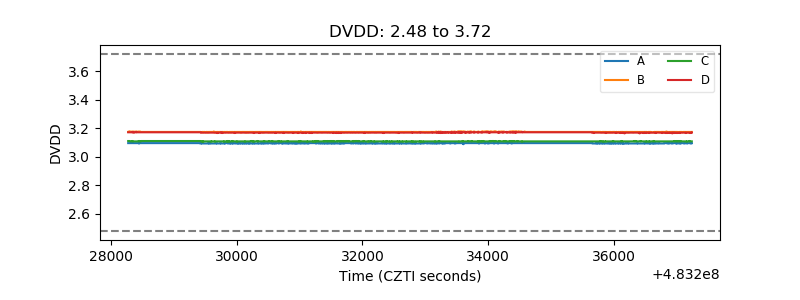 |
| Temperature 1 | 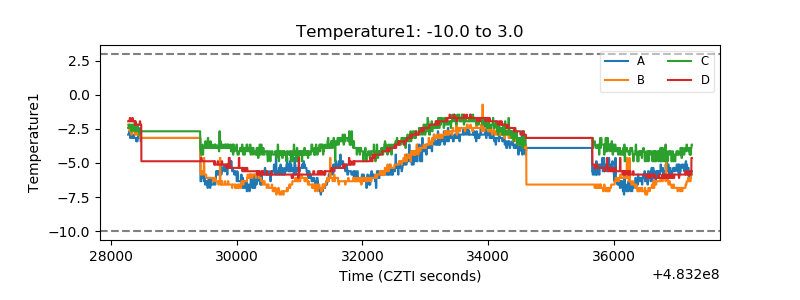 |
| Veto HV Monitor | 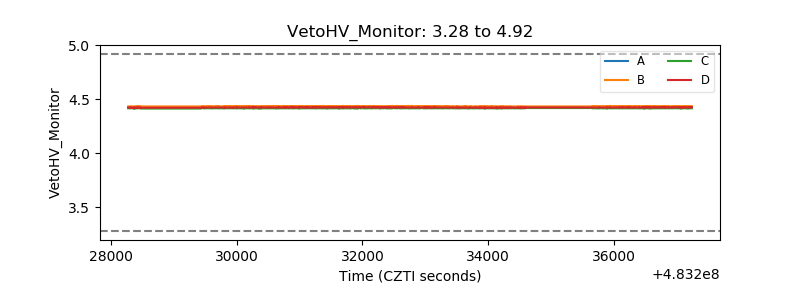 |
| Veto LLD | 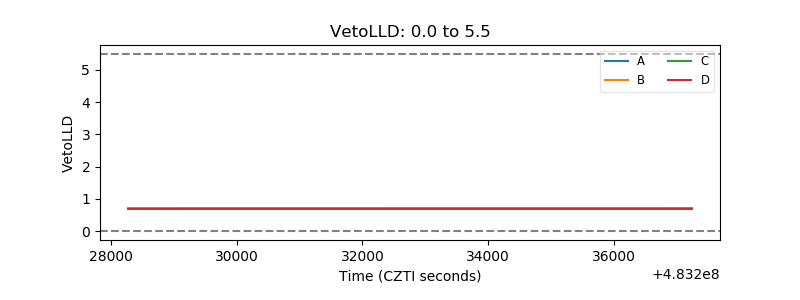 |
| Alpha Counter | 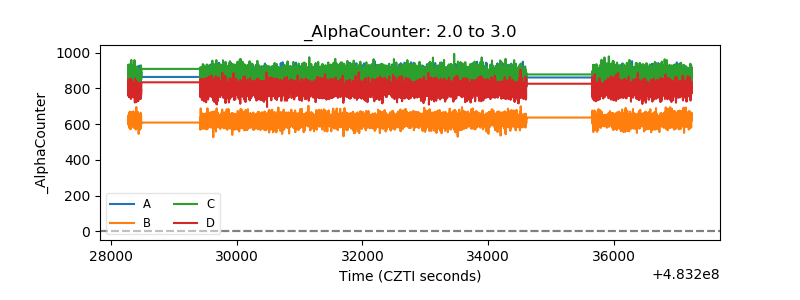 |
| _CPM_Rate | 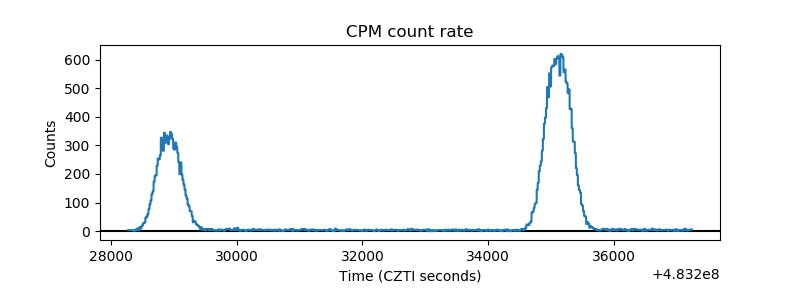 |
| CZT Counter | 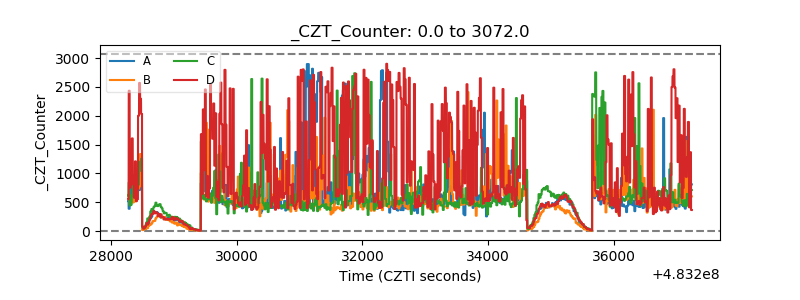 |
| +2.5 Volts monitor | 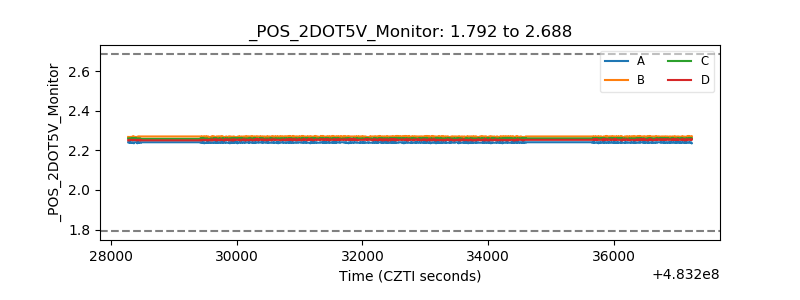 |
| +5 Volts monitor | 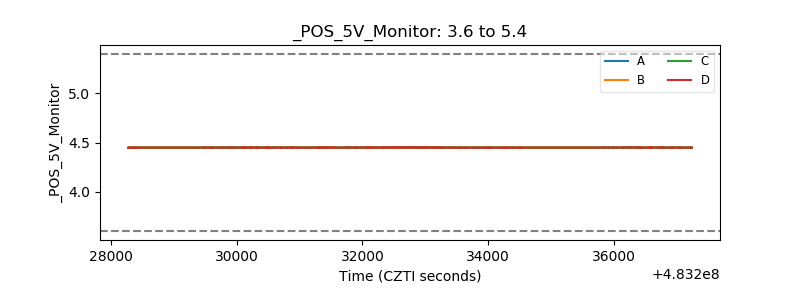 |
| _ROLL_ROT | 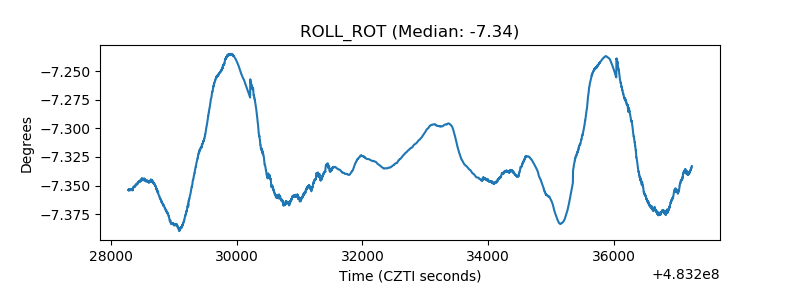 |
| _Roll_DEC | 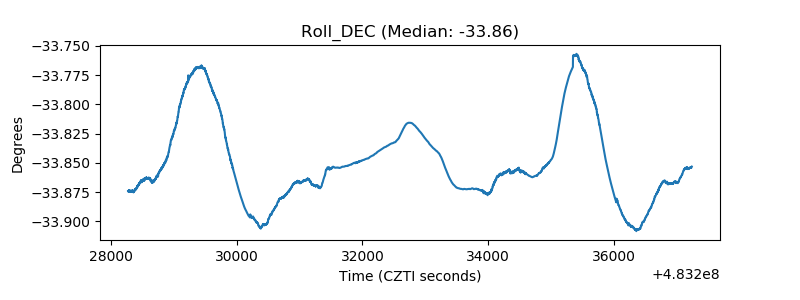 |
| _Roll_RA | 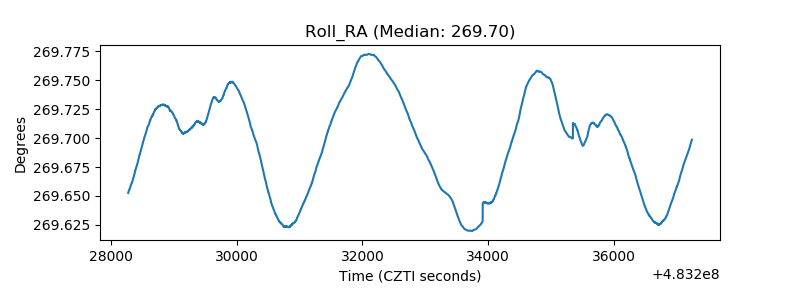 |
| Veto Counter | 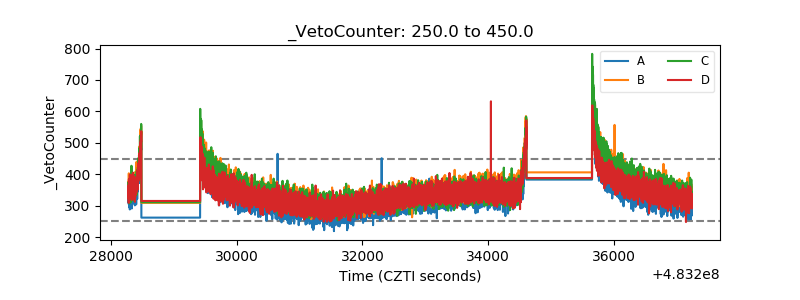 |