| Param | Original file | Final file |
|---|---|---|
| Filename | modeM0/AS1A13_090T01_9000006464_51784cztM0_level2.fits | modeM0/AS1A13_090T01_9000006464_51784cztM0_level2_quad_clean.evt |
| Size (bytes) | 597,038,400 | 98,285,760 |
| Size | 569.4 MB | 93.7 MB |
| Events in quadrant A | 4,737,115 | 654,873 |
| Events in quadrant B | 4,785,479 | 716,641 |
| Events in quadrant C | 5,258,497 | 608,919 |
| Events in quadrant D | 6,790,277 | 520,395 |
| Mode M9 | |||
|---|---|---|---|
| Quadrant | BADHDUFLAG | Total packets | Discarded packets |
| A | 0 | 22 | 0 |
| B | 0 | 22 | 0 |
| C | 0 | 22 | 0 |
| D | 0 | 22 | 0 |
| Mode SS | |||
|---|---|---|---|
| Quadrant | BADHDUFLAG | Total packets | Discarded packets |
| A | 0 | 138 | 0 |
| B | 0 | 138 | 0 |
| C | 0 | 138 | 0 |
| D | 0 | 138 | 0 |
| Mode M0 | |||
|---|---|---|---|
| Quadrant | BADHDUFLAG | Total packets | Discarded packets |
| A | 0 | 18684 | 2 |
| B | 0 | 18962 | 2 |
| C | 0 | 20101 | 2 |
| D | 0 | 24957 | 2 |
| Quadrant | Total seconds | Saturated seconds | Saturation percentage |
|---|---|---|---|
| A | 6825 | 215 | 3.150183% |
| B | 6826 | 239 | 3.501318% |
| C | 6826 | 482 | 7.061236% |
| D | 6826 | 1125 | 16.481102% |
Noise dominated data is calculated using 1-second bins in cleaned event files. If a bin has >2000 counts, and if more than 50% of those come from <1% of pixels, then it is considered to be noise-dominated and hence unusable.
| Quadrant | # 1 sec bins | Bins with >0 counts | Bins with >2000 counts | High rate bins dominated by noise | Noise dominated (total time) | Noise dominated (detector-on time) | Marked lightcurve |
|---|---|---|---|---|---|---|---|
| A | 8985 | 6827 | 223 | 223 | 2.48% | 3.27% | 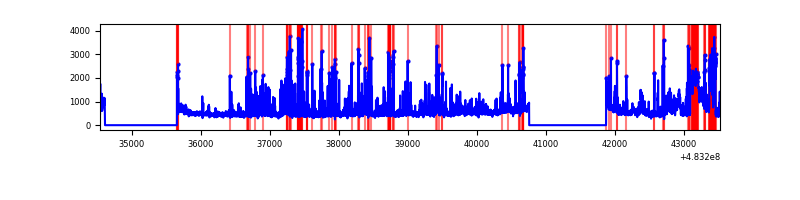 |
| B | 8986 | 6827 | 135 | 135 | 1.50% | 1.98% | 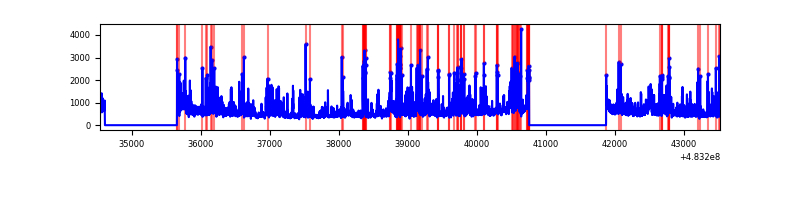 |
| C | 8986 | 6828 | 427 | 427 | 4.75% | 6.25% | 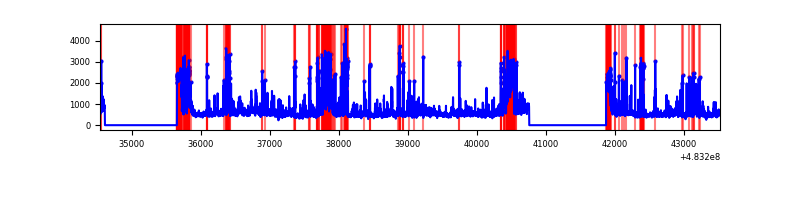 |
| D | 8986 | 6827 | 1001 | 1001 | 11.14% | 14.66% | 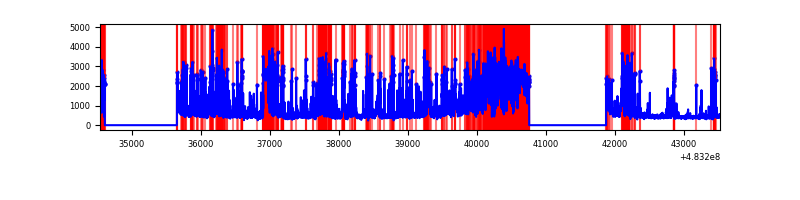 |
Top three noisy pixels from each quadrant. If the there are fewer than three noisy pixels in the level2.evt file, extra rows are filled as -1
| Pixel properties | Quadrant properties | ||||||
|---|---|---|---|---|---|---|---|
| Quadrant | DetID | PixID | Counts | Sigma | Mean | Median | Sigma |
| A | 11 | 14 | 442727 | 2444.34 | 736 | 719 | 180.8 |
| A | 11 | 3 | 373666 | 2062.43 | 736 | 719 | 180.8 |
| A | 3 | 14 | 194316 | 1070.61 | 736 | 719 | 180.8 |
| B | 4 | 206 | 1077760 | 6849.0 | 737 | 710 | 157.3 |
| B | 4 | 174 | 208467 | 1321.13 | 737 | 710 | 157.3 |
| B | 0 | 171 | 163979 | 1038.23 | 737 | 710 | 157.3 |
| C | 15 | 218 | 956221 | 4939.72 | 705 | 700 | 193.4 |
| C | 9 | 38 | 265116 | 1366.94 | 705 | 700 | 193.4 |
| C | 11 | 227 | 226167 | 1165.59 | 705 | 700 | 193.4 |
| D | 11 | 129 | 2877638 | 15420.58 | 666 | 642 | 186.6 |
| D | 3 | 12 | 829560 | 4442.97 | 666 | 642 | 186.6 |
| D | 10 | 172 | 130737 | 697.3 | 666 | 642 | 186.6 |
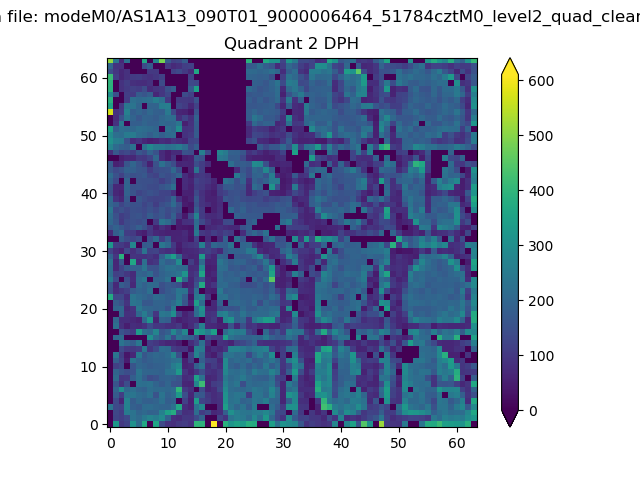
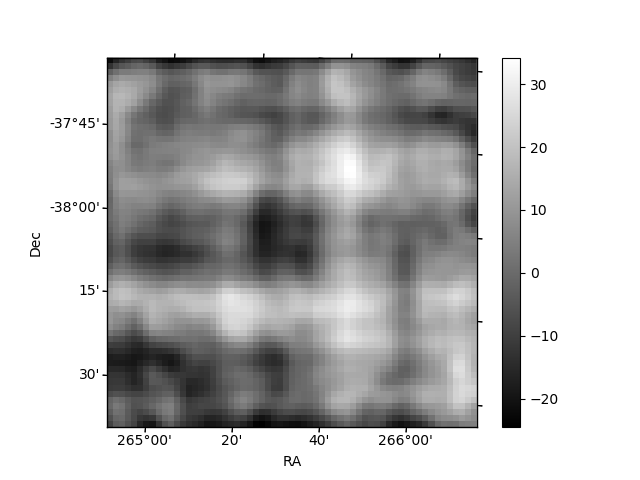
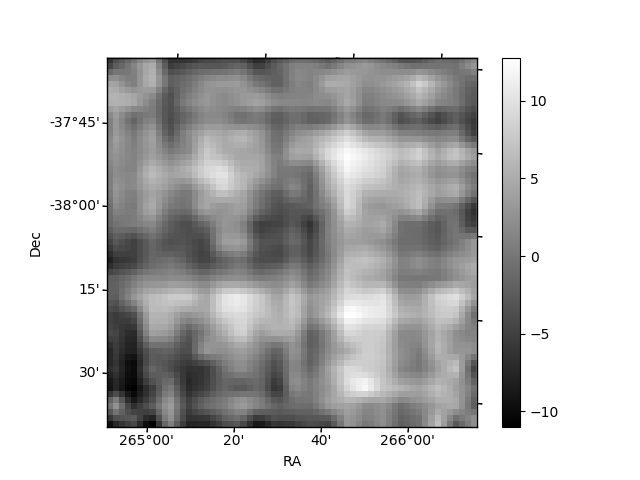
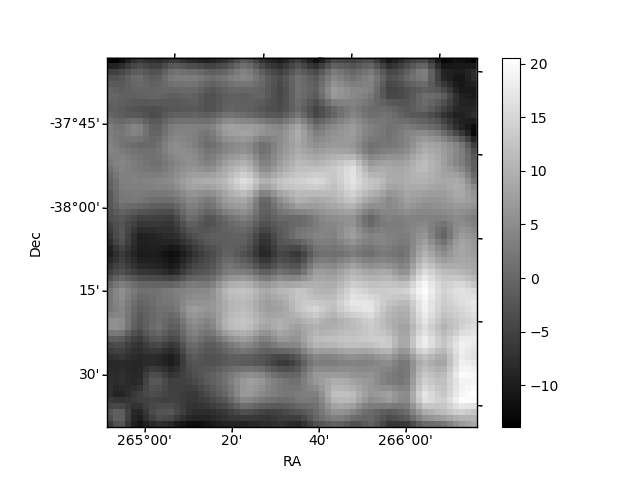
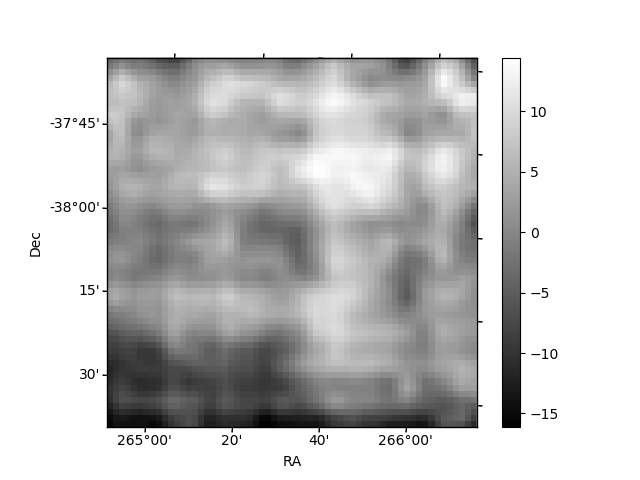
Histogram calculated using DETX and DETY for each event in the final _common_clean file
| Quadrant A | 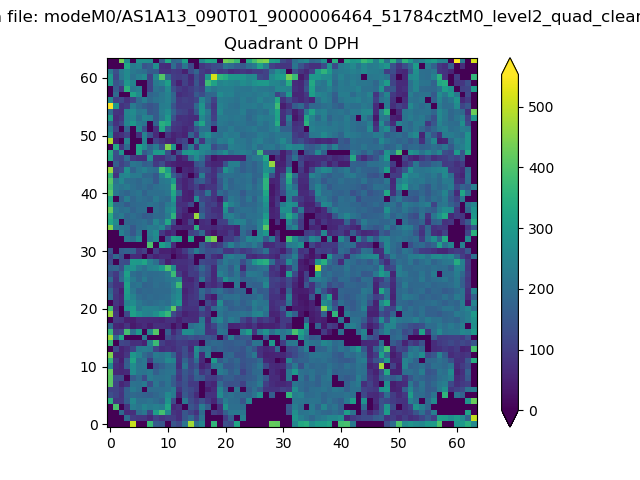 |
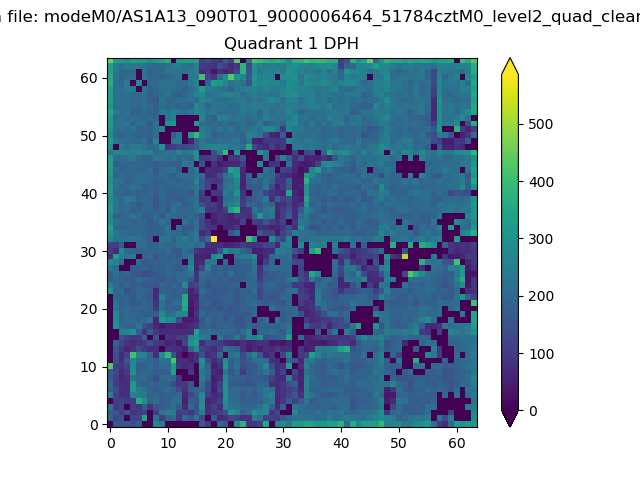 |
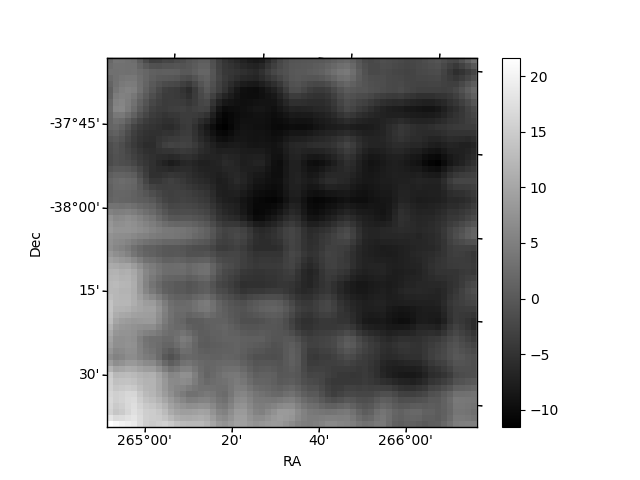
Quadrant B |
|---|---|---|---|
| Quadrant D | 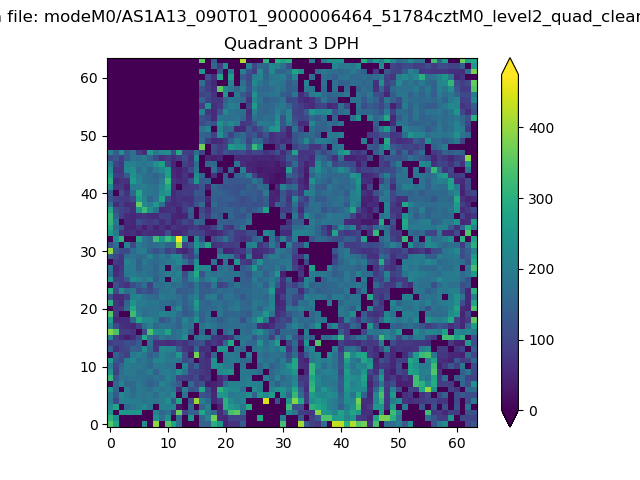 |
 |
Quadrant C |
| Plot type | Count rate plots | Images |
|---|---|---|
| Comparison with Poisson distribution Blue bars denote a histogram of data divided into 1 sec bins. Red curve is a Poisson curve with rate = median count rate of data. |
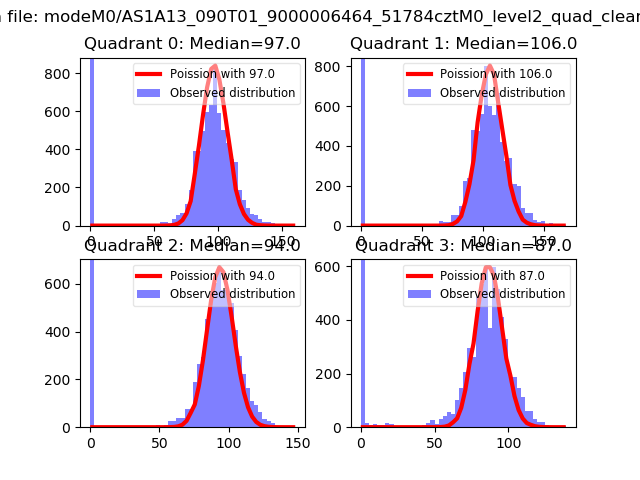 |
 |
| Quadrant-wise count rates Data is divided into 100 sec bins |
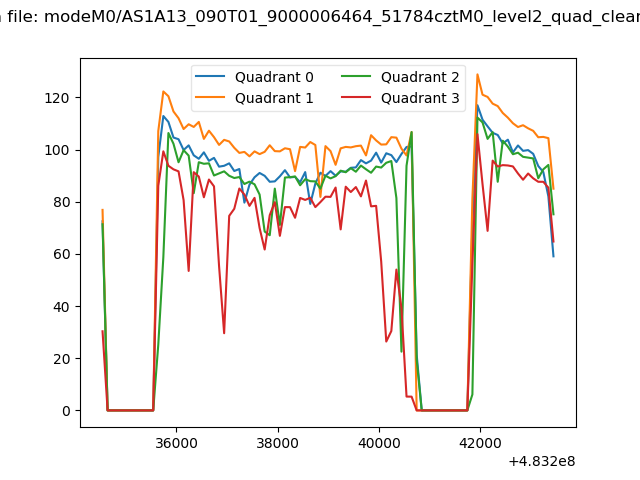 |
|
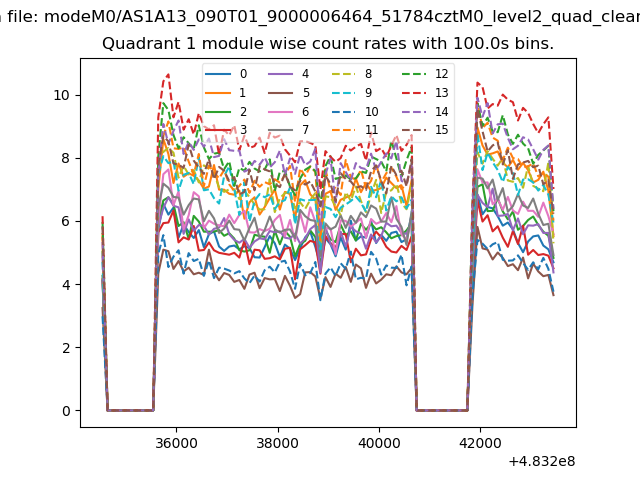
| Module-wise count rates for Quadrant A Data is divided into 100 sec bins |
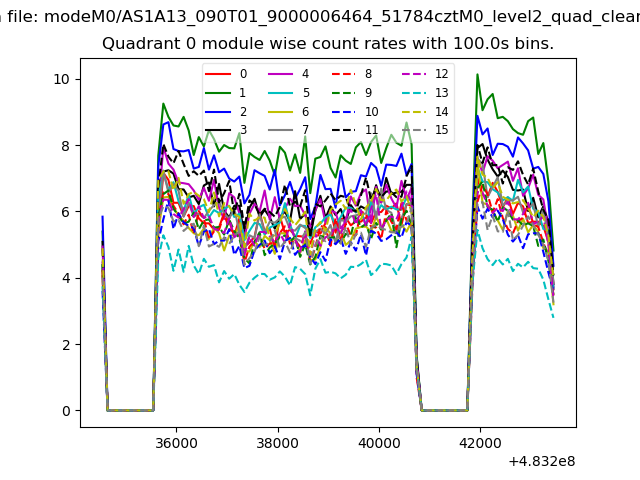 |
 |
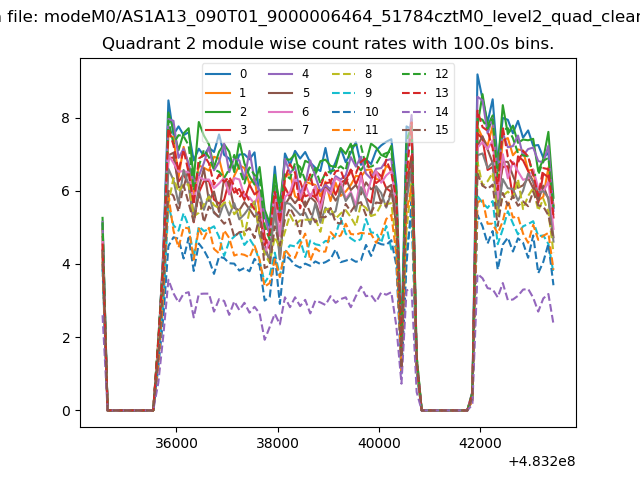
| Module-wise count rates for Quadrant B Data is divided into 100 sec bins |
 |
 |
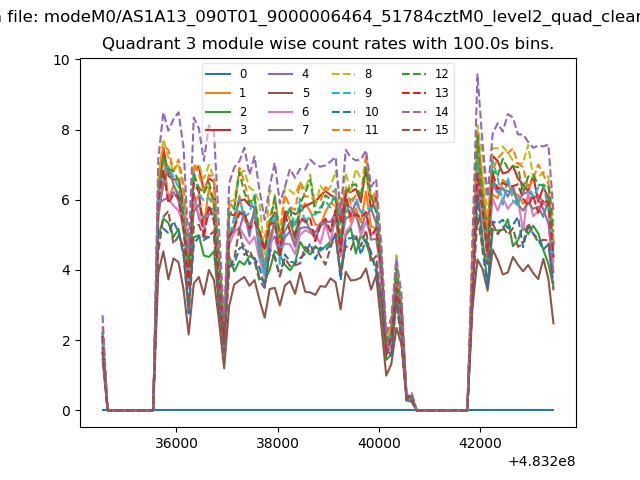
| Module-wise count rates for Quadrant C Data is divided into 100 sec bins |
 |
 |
| Module-wise count rates for Quadrant D Data is divided into 100 sec bins |
 |
 |
| Parameter | Plot |
|---|---|
| CZT HV Monitor | 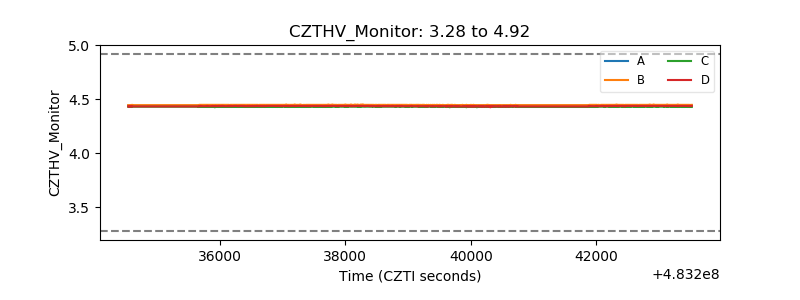 |
| D_VDD | 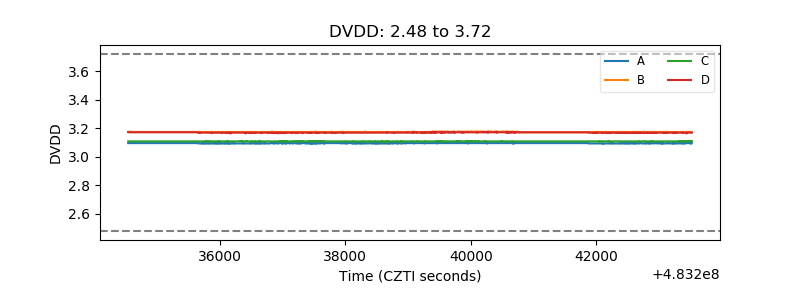 |
| Temperature 1 | 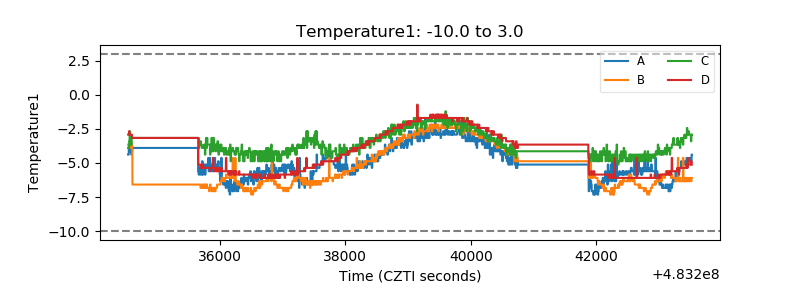 |
| Veto HV Monitor | 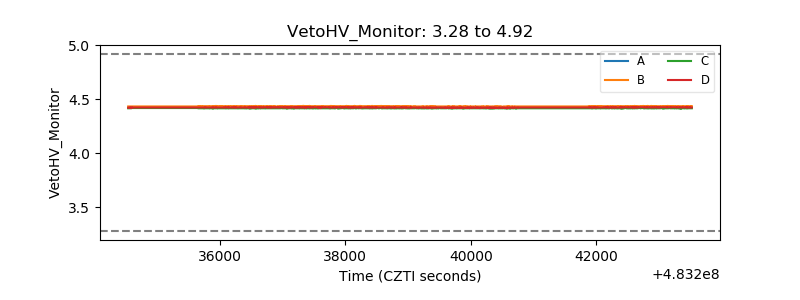 |
| Veto LLD | 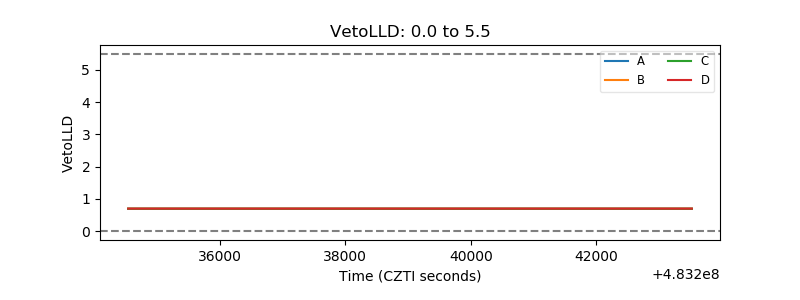 |
| Alpha Counter | 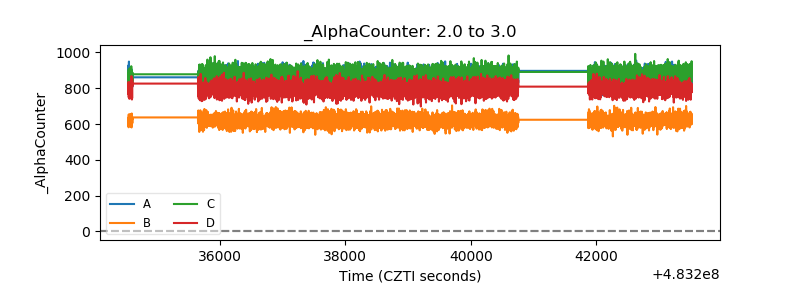 |
| _CPM_Rate | 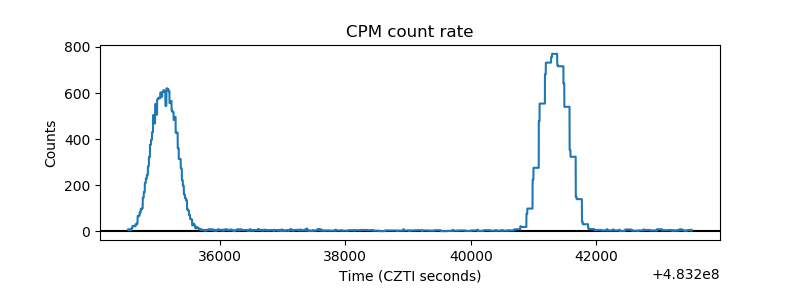 |
| CZT Counter | 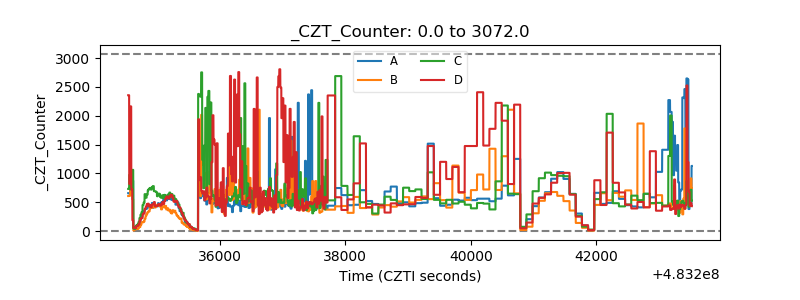 |
| +2.5 Volts monitor | 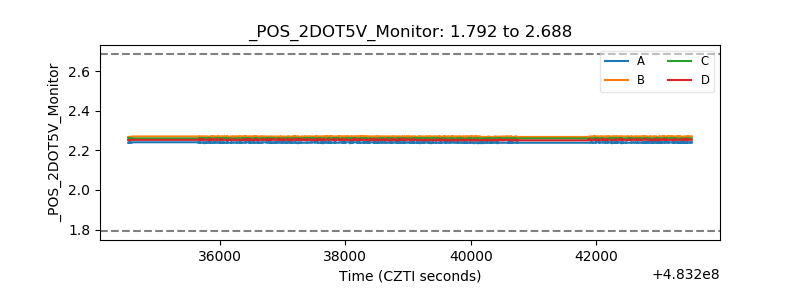 |
| +5 Volts monitor | 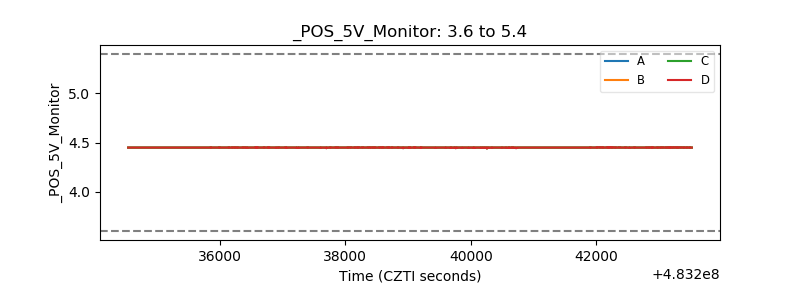 |
| _ROLL_ROT | 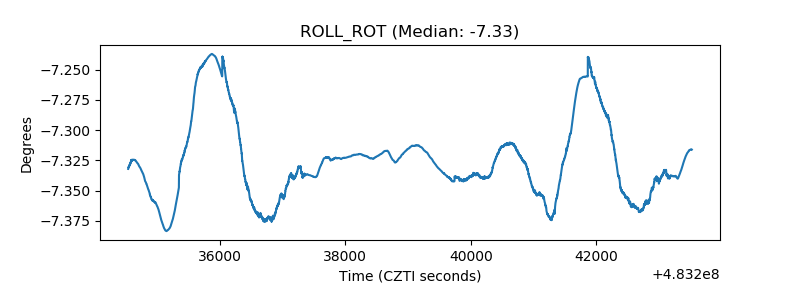 |
| _Roll_DEC | 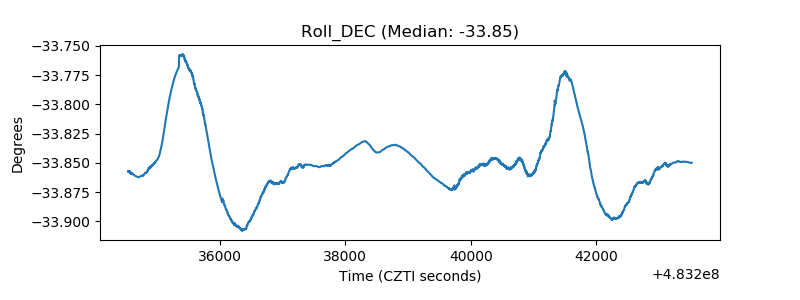 |
| _Roll_RA | 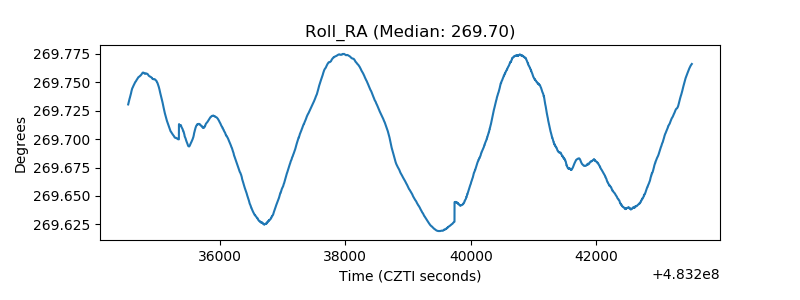 |
| Veto Counter | 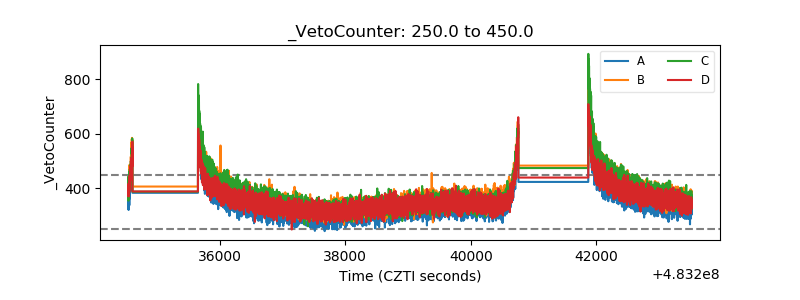 |