| Param | Original file | Final file |
|---|---|---|
| Filename | modeM0/AS1A13_090T01_9000006464_51785cztM0_level2.fits | modeM0/AS1A13_090T01_9000006464_51785cztM0_level2_quad_clean.evt |
| Size (bytes) | 616,968,000 | 92,462,400 |
| Size | 588.4 MB | 88.2 MB |
| Events in quadrant A | 5,428,447 | 586,725 |
| Events in quadrant B | 5,087,817 | 665,422 |
| Events in quadrant C | 5,093,584 | 589,734 |
| Events in quadrant D | 6,726,466 | 505,838 |
| Mode M9 | |||
|---|---|---|---|
| Quadrant | BADHDUFLAG | Total packets | Discarded packets |
| A | 0 | 18 | 0 |
| B | 0 | 19 | 0 |
| C | 0 | 19 | 0 |
| D | 0 | 19 | 0 |
| Mode SS | |||
|---|---|---|---|
| Quadrant | BADHDUFLAG | Total packets | Discarded packets |
| A | 0 | 132 | 0 |
| B | 0 | 132 | 0 |
| C | 0 | 132 | 0 |
| D | 0 | 132 | 0 |
| Mode M0 | |||
|---|---|---|---|
| Quadrant | BADHDUFLAG | Total packets | Discarded packets |
| A | 0 | 20502 | 2 |
| B | 0 | 19546 | 2 |
| C | 0 | 19498 | 2 |
| D | 0 | 24514 | 2 |
| Quadrant | Total seconds | Saturated seconds | Saturation percentage |
|---|---|---|---|
| A | 6475 | 686 | 10.594595% |
| B | 6475 | 517 | 7.984556% |
| C | 6475 | 532 | 8.216216% |
| D | 6475 | 1054 | 16.277992% |
Noise dominated data is calculated using 1-second bins in cleaned event files. If a bin has >2000 counts, and if more than 50% of those come from <1% of pixels, then it is considered to be noise-dominated and hence unusable.
| Quadrant | # 1 sec bins | Bins with >0 counts | Bins with >2000 counts | High rate bins dominated by noise | Noise dominated (total time) | Noise dominated (detector-on time) | Marked lightcurve |
|---|---|---|---|---|---|---|---|
| A | 7605 | 6476 | 567 | 567 | 7.46% | 8.76% | 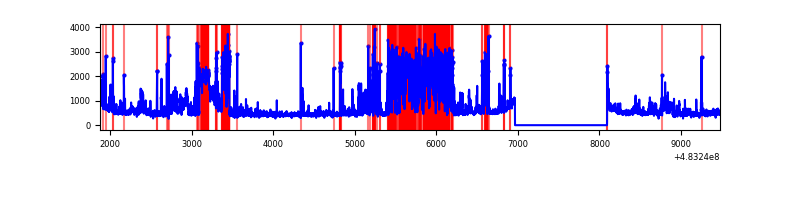 |
| B | 7605 | 6476 | 296 | 296 | 3.89% | 4.57% | 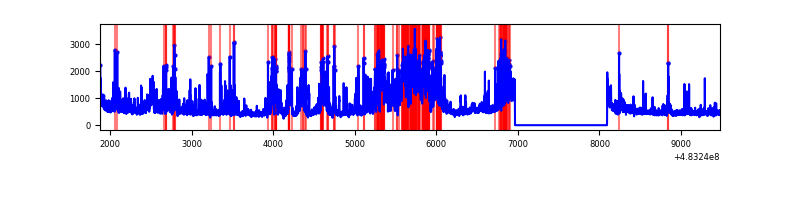 |
| C | 7605 | 6476 | 403 | 403 | 5.30% | 6.22% | 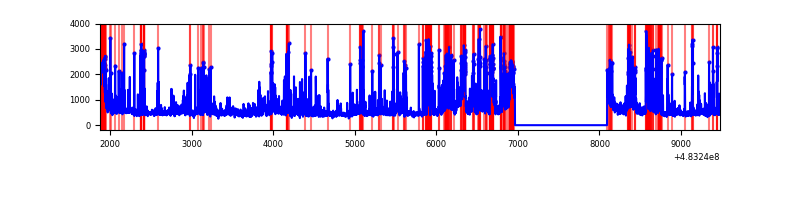 |
| D | 7605 | 6476 | 925 | 925 | 12.16% | 14.28% | 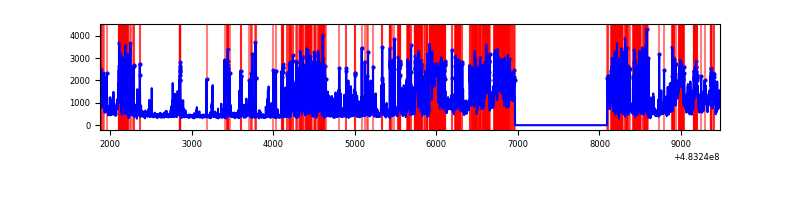 |
Top three noisy pixels from each quadrant. If the there are fewer than three noisy pixels in the level2.evt file, extra rows are filled as -1
| Pixel properties | Quadrant properties | ||||||
|---|---|---|---|---|---|---|---|
| Quadrant | DetID | PixID | Counts | Sigma | Mean | Median | Sigma |
| A | 13 | 248 | 1251908 | 7294.66 | 694 | 677 | 171.5 |
| A | 11 | 14 | 435884 | 2537.25 | 694 | 677 | 171.5 |
| A | 0 | 228 | 178072 | 1034.21 | 694 | 677 | 171.5 |
| B | 10 | 44 | 1094895 | 7268.44 | 703 | 681 | 150.5 |
| B | 4 | 206 | 307833 | 2040.29 | 703 | 681 | 150.5 |
| B | 0 | 171 | 169129 | 1118.94 | 703 | 681 | 150.5 |
| C | 15 | 218 | 572575 | 3037.74 | 687 | 681 | 188.3 |
| C | 0 | 209 | 274345 | 1453.63 | 687 | 681 | 188.3 |
| C | 0 | 192 | 217400 | 1151.15 | 687 | 681 | 188.3 |
| D | 11 | 129 | 3298603 | 18082.28 | 652 | 627 | 182.4 |
| D | 10 | 181 | 311419 | 1704.02 | 652 | 627 | 182.4 |
| D | 3 | 12 | 246674 | 1349.03 | 652 | 627 | 182.4 |
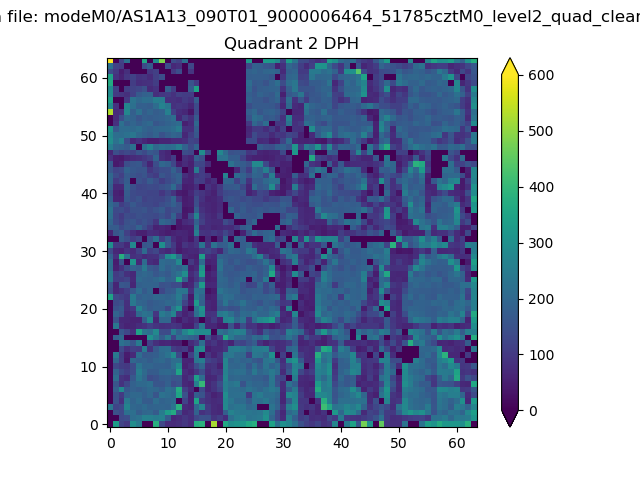
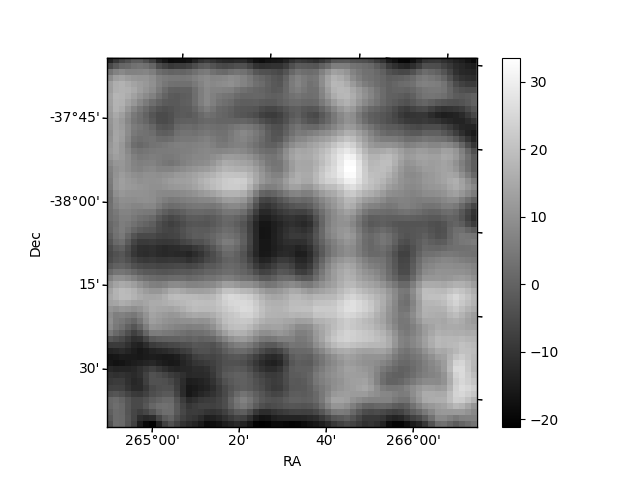
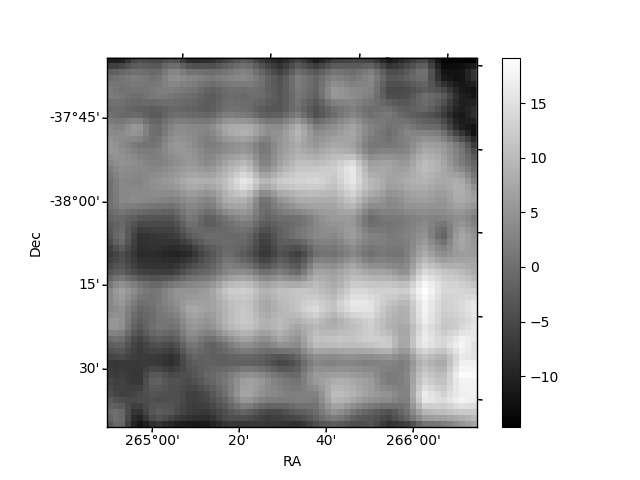
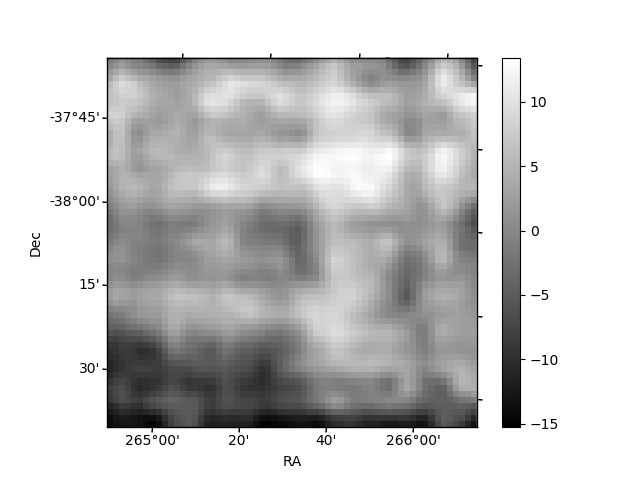
Histogram calculated using DETX and DETY for each event in the final _common_clean file
| Quadrant A | 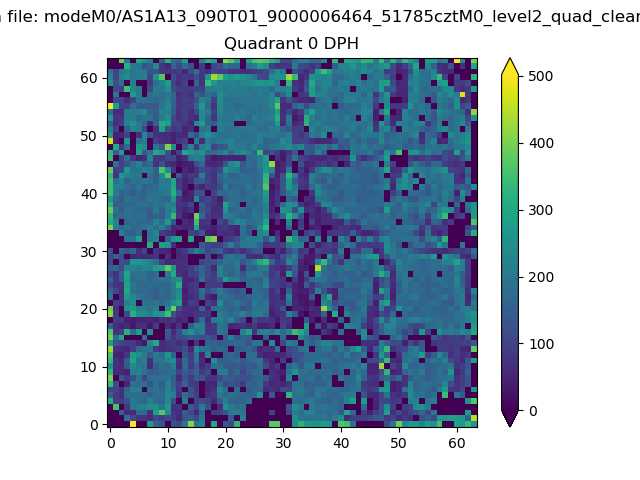 |
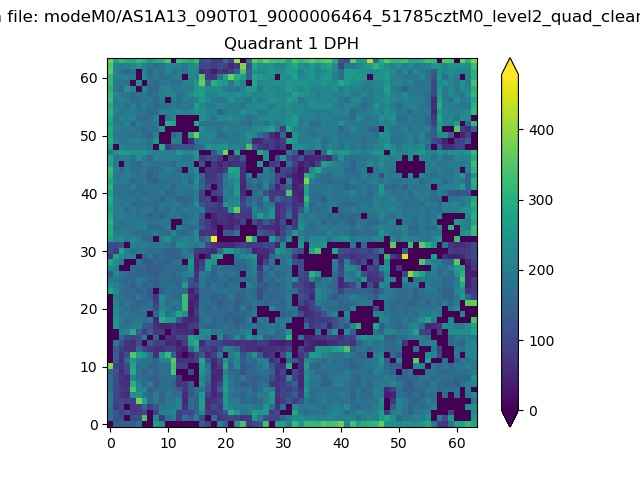 |
Quadrant B |
|---|---|---|---|
| Quadrant D | 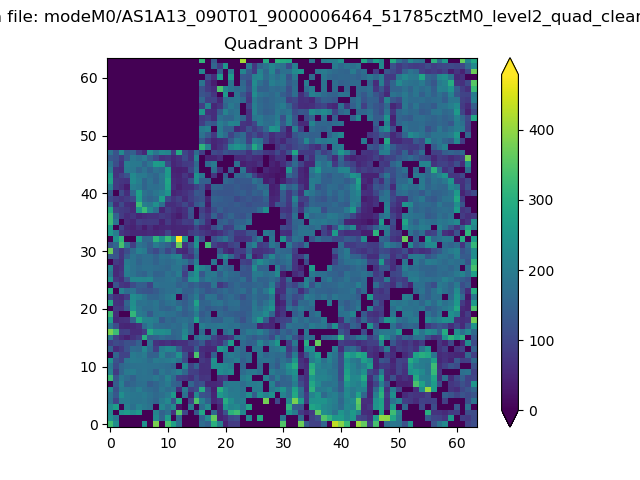 |
 |
Quadrant C |
| Plot type | Count rate plots | Images |
|---|---|---|
| Comparison with Poisson distribution Blue bars denote a histogram of data divided into 1 sec bins. Red curve is a Poisson curve with rate = median count rate of data. |
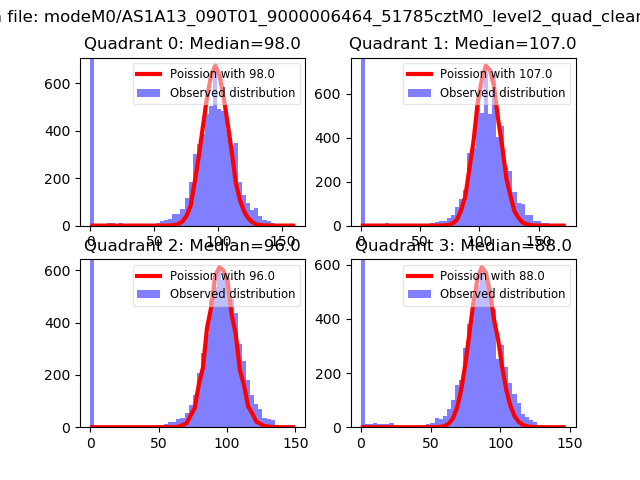 |
 |
| Quadrant-wise count rates Data is divided into 100 sec bins |
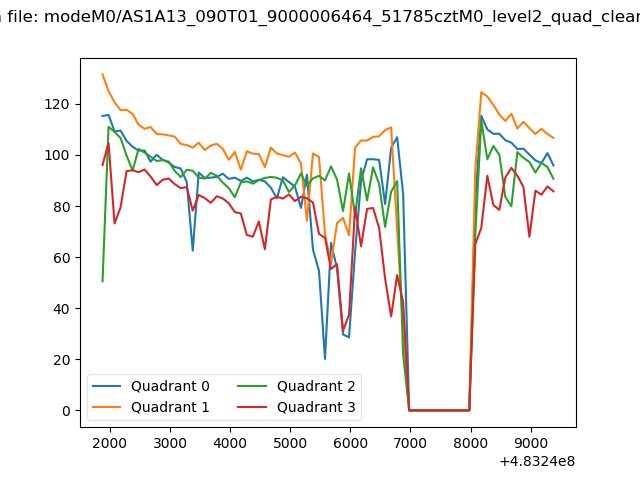 |
|
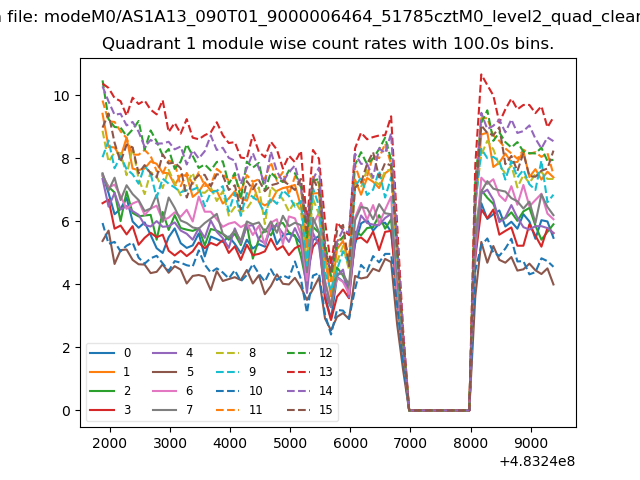
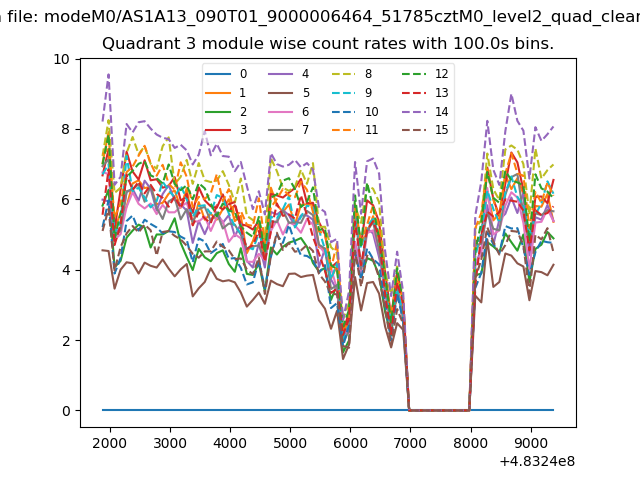
| Module-wise count rates for Quadrant A Data is divided into 100 sec bins |
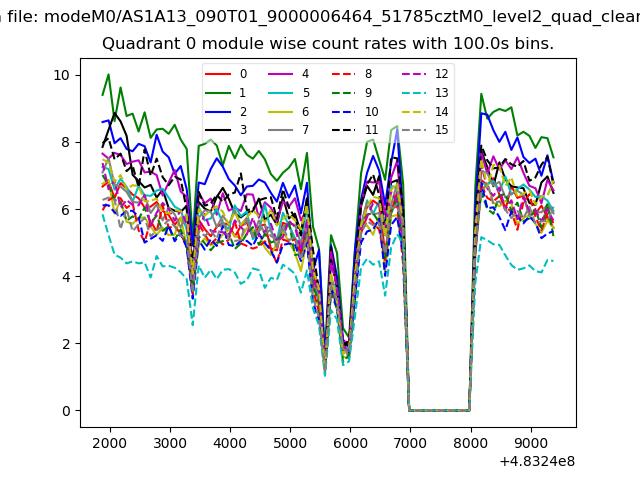 |
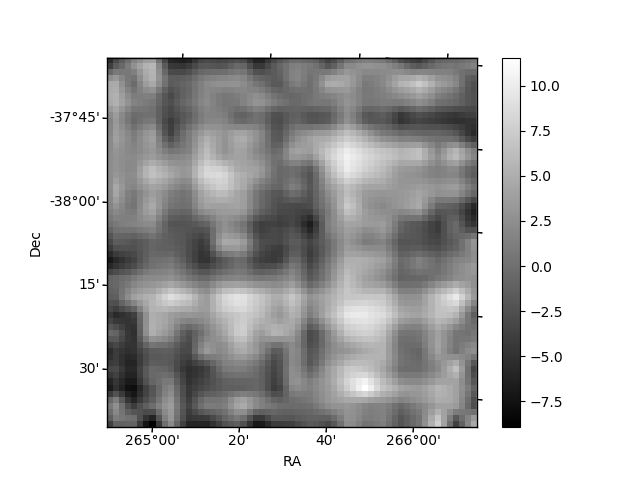 |
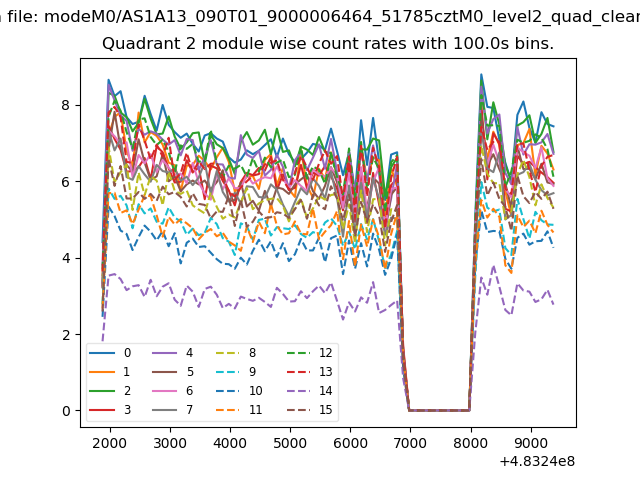
| Module-wise count rates for Quadrant B Data is divided into 100 sec bins |
 |
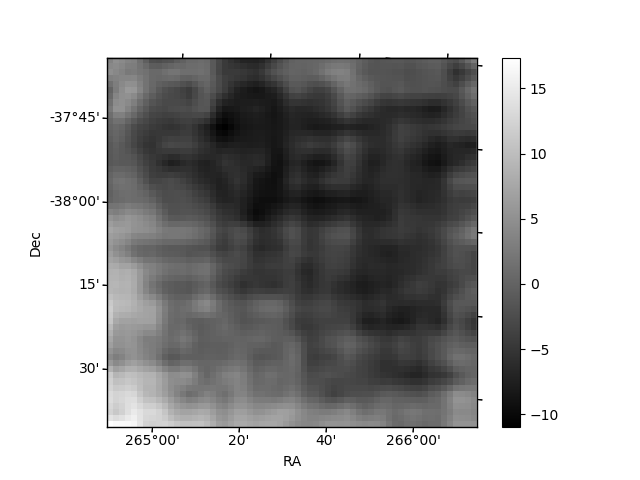 |
| Module-wise count rates for Quadrant C Data is divided into 100 sec bins |
 |
 |
| Module-wise count rates for Quadrant D Data is divided into 100 sec bins |
 |
 |
| Parameter | Plot |
|---|---|
| CZT HV Monitor | 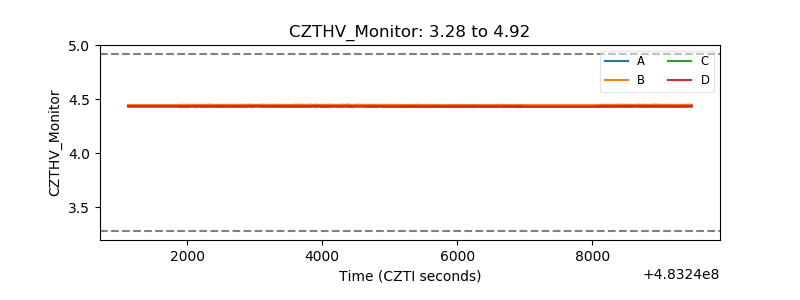 |
| D_VDD | 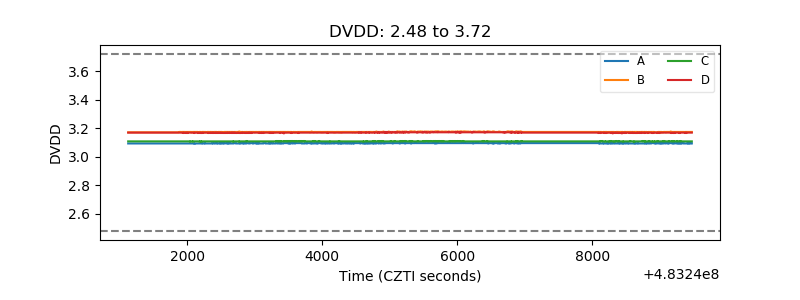 |
| Temperature 1 | 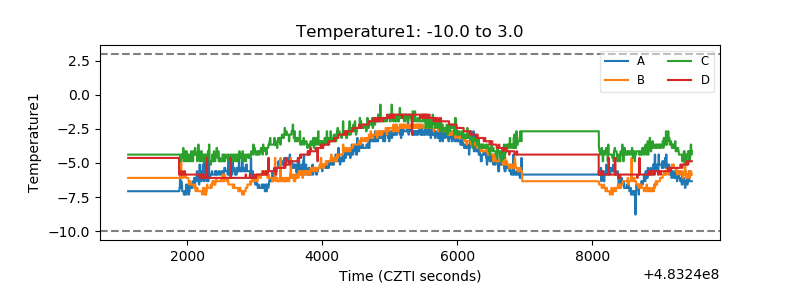 |
| Veto HV Monitor | 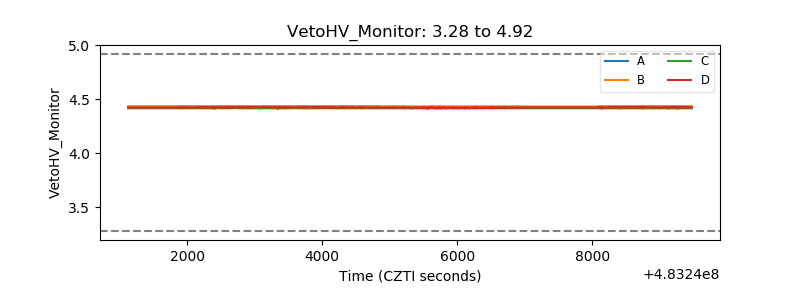 |
| Veto LLD | 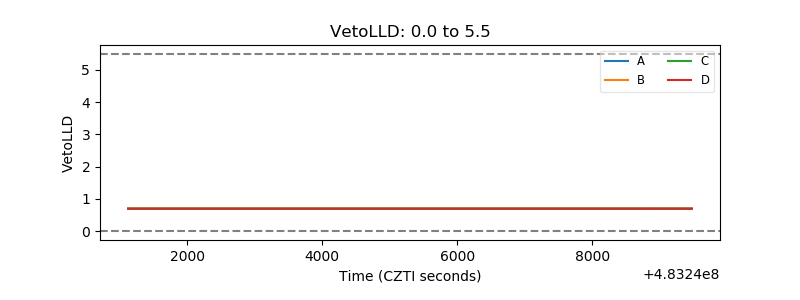 |
| Alpha Counter | 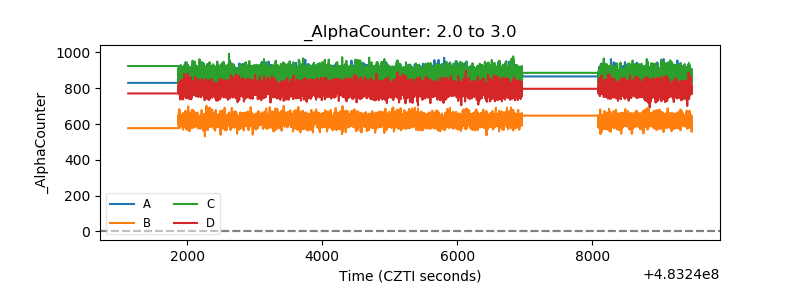 |
| _CPM_Rate | 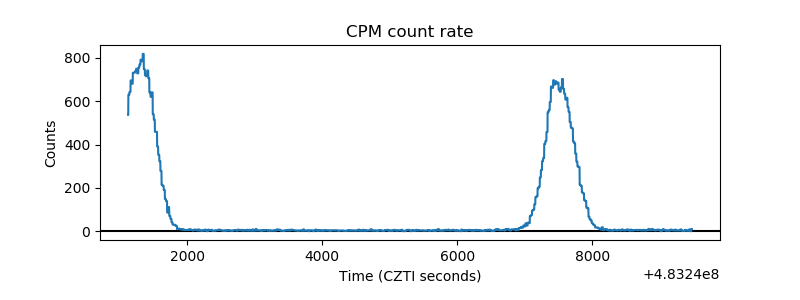 |
| CZT Counter | 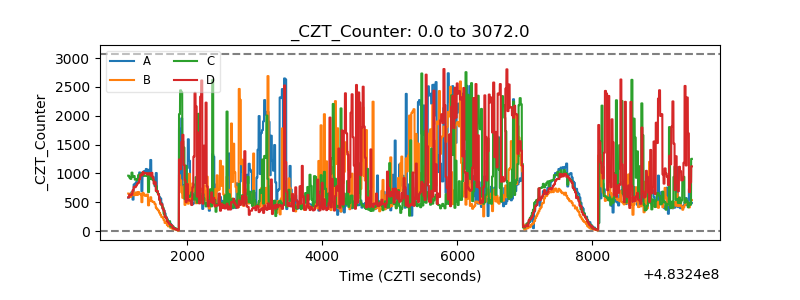 |
| +2.5 Volts monitor | 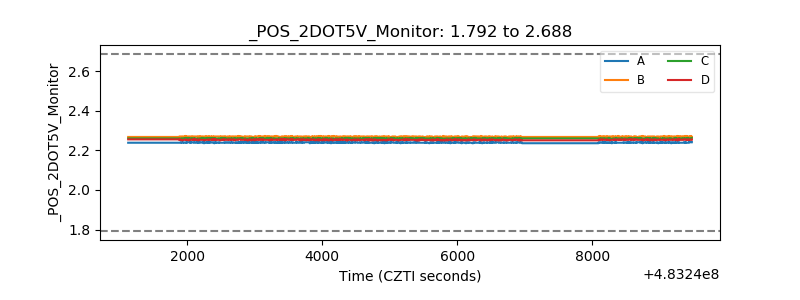 |
| +5 Volts monitor | 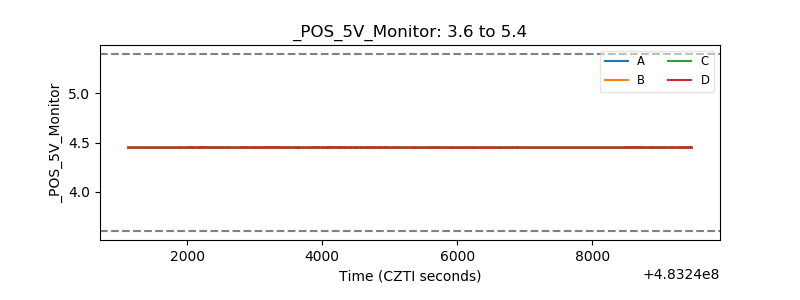 |
| _ROLL_ROT | 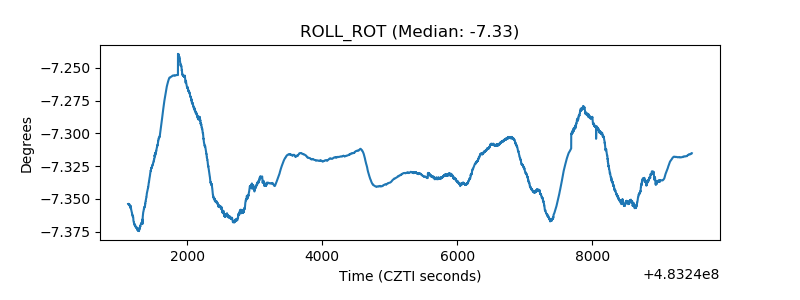 |
| _Roll_DEC | 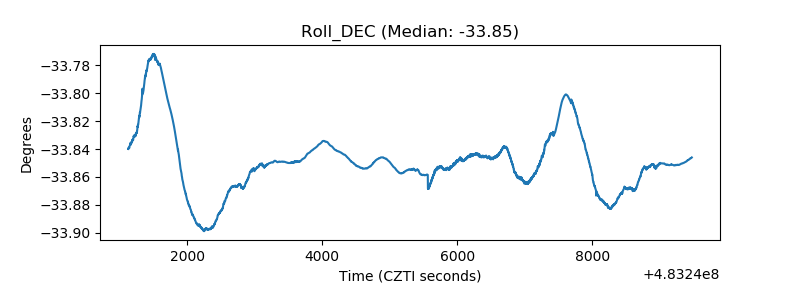 |
| _Roll_RA | 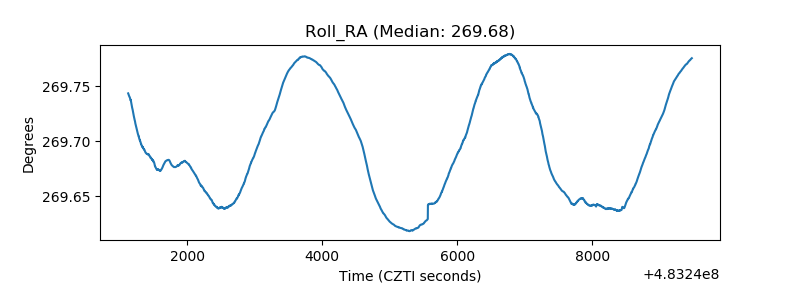 |
| Veto Counter | 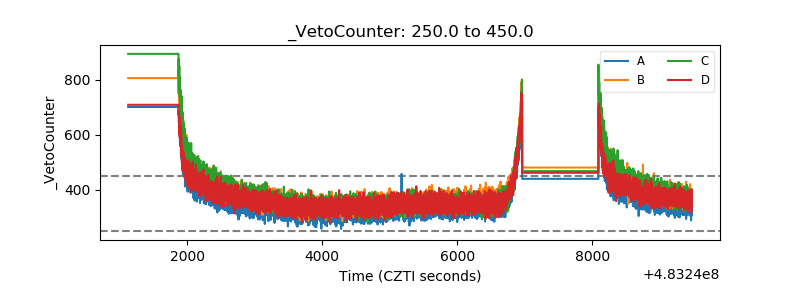 |