| Param | Original file | Final file |
|---|---|---|
| Filename | modeM0/AS1A13_090T01_9000006464_51787cztM0_level2.fits | modeM0/AS1A13_090T01_9000006464_51787cztM0_level2_quad_clean.evt |
| Size (bytes) | 618,456,960 | 82,028,160 |
| Size | 589.8 MB | 78.2 MB |
| Events in quadrant A | 5,361,890 | 565,357 |
| Events in quadrant B | 6,921,636 | 473,318 |
| Events in quadrant C | 4,138,681 | 547,058 |
| Events in quadrant D | 6,000,603 | 473,875 |
| Mode M9 | |||
|---|---|---|---|
| Quadrant | BADHDUFLAG | Total packets | Discarded packets |
| A | 0 | 10 | 0 |
| B | 0 | 10 | 0 |
| C | 0 | 10 | 0 |
| D | 0 | 10 | 0 |
| Mode SS | |||
|---|---|---|---|
| Quadrant | BADHDUFLAG | Total packets | Discarded packets |
| A | 0 | 124 | 0 |
| B | 0 | 124 | 0 |
| C | 0 | 124 | 0 |
| D | 0 | 124 | 0 |
| Mode M0 | |||
|---|---|---|---|
| Quadrant | BADHDUFLAG | Total packets | Discarded packets |
| A | 0 | 20109 | 1 |
| B | 0 | 24778 | 1 |
| C | 0 | 16445 | 1 |
| D | 0 | 21955 | 1 |
| Quadrant | Total seconds | Saturated seconds | Saturation percentage |
|---|---|---|---|
| A | 6071 | 261 | 4.299127% |
| B | 6071 | 1628 | 26.816011% |
| C | 6071 | 305 | 5.023884% |
| D | 6071 | 841 | 13.852743% |
Noise dominated data is calculated using 1-second bins in cleaned event files. If a bin has >2000 counts, and if more than 50% of those come from <1% of pixels, then it is considered to be noise-dominated and hence unusable.
| Quadrant | # 1 sec bins | Bins with >0 counts | Bins with >2000 counts | High rate bins dominated by noise | Noise dominated (total time) | Noise dominated (detector-on time) | Marked lightcurve |
|---|---|---|---|---|---|---|---|
| A | 7071 | 6072 | 127 | 127 | 1.80% | 2.09% | 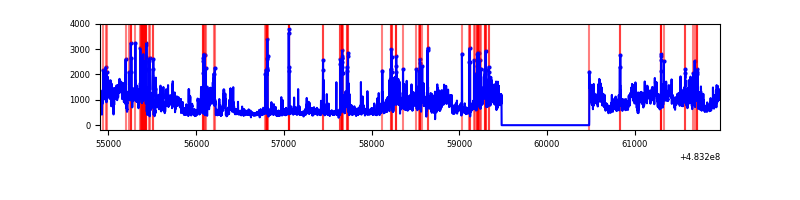 |
| B | 7070 | 6071 | 1470 | 1470 | 20.79% | 24.21% | 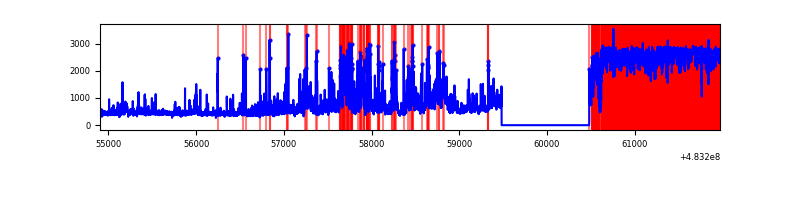 |
| C | 7071 | 6072 | 223 | 223 | 3.15% | 3.67% | 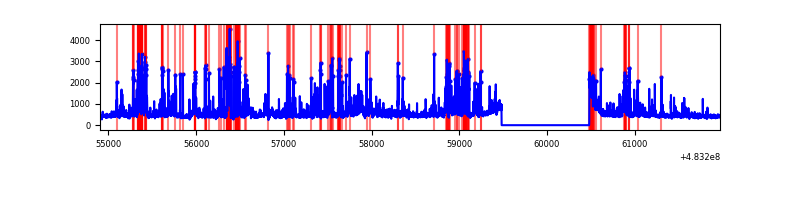 |
| D | 7071 | 6071 | 752 | 752 | 10.63% | 12.39% | 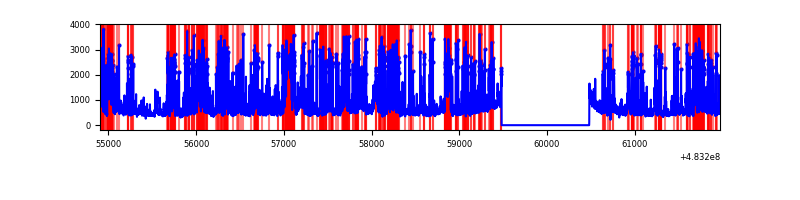 |
Top three noisy pixels from each quadrant. If the there are fewer than three noisy pixels in the level2.evt file, extra rows are filled as -1
| Pixel properties | Quadrant properties | ||||||
|---|---|---|---|---|---|---|---|
| Quadrant | DetID | PixID | Counts | Sigma | Mean | Median | Sigma |
| A | 12 | 3 | 1408989 | 8751.99 | 658 | 644 | 160.9 |
| A | 15 | 174 | 249361 | 1545.62 | 658 | 644 | 160.9 |
| A | 11 | 14 | 193692 | 1199.67 | 658 | 644 | 160.9 |
| B | 10 | 128 | 3485626 | 30501.73 | 530 | 512 | 114.3 |
| B | 10 | 44 | 601468 | 5259.57 | 530 | 512 | 114.3 |
| B | 4 | 206 | 193540 | 1689.38 | 530 | 512 | 114.3 |
| C | 13 | 3 | 387478 | 2206.58 | 641 | 636 | 175.3 |
| C | 15 | 218 | 272404 | 1550.19 | 641 | 636 | 175.3 |
| C | 12 | 254 | 212361 | 1207.7 | 641 | 636 | 175.3 |
| D | 11 | 129 | 2805605 | 16375.86 | 616 | 594 | 171.3 |
| D | 3 | 12 | 434566 | 2533.56 | 616 | 594 | 171.3 |
| D | 8 | 176 | 87913 | 509.77 | 616 | 594 | 171.3 |
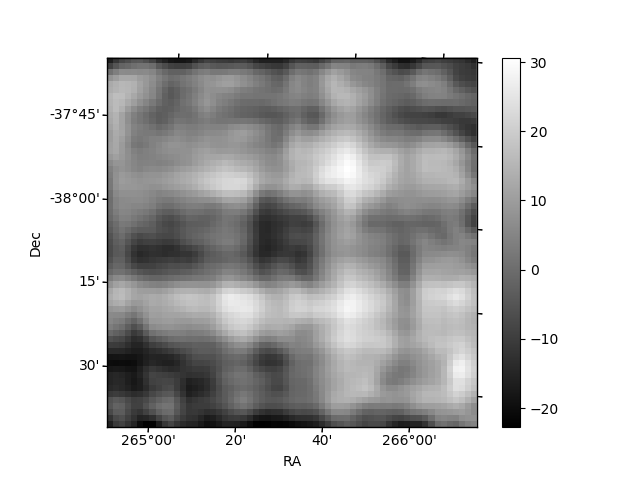
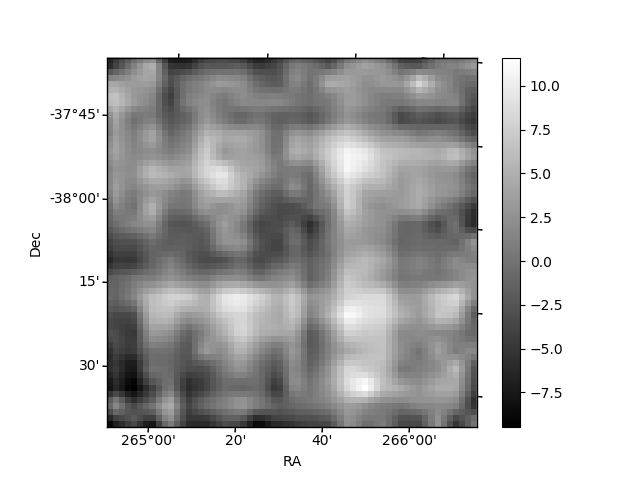
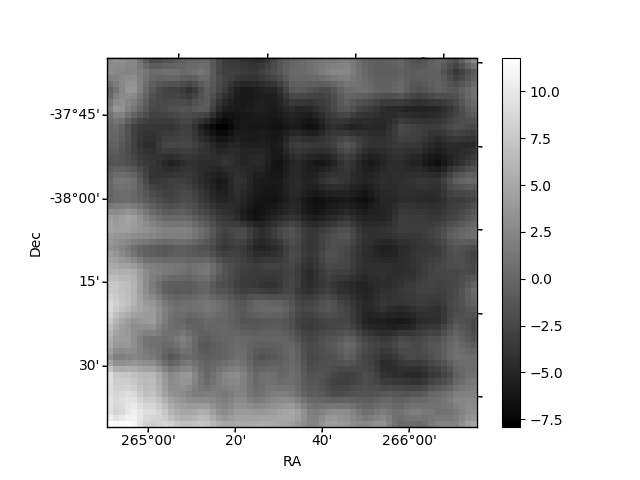
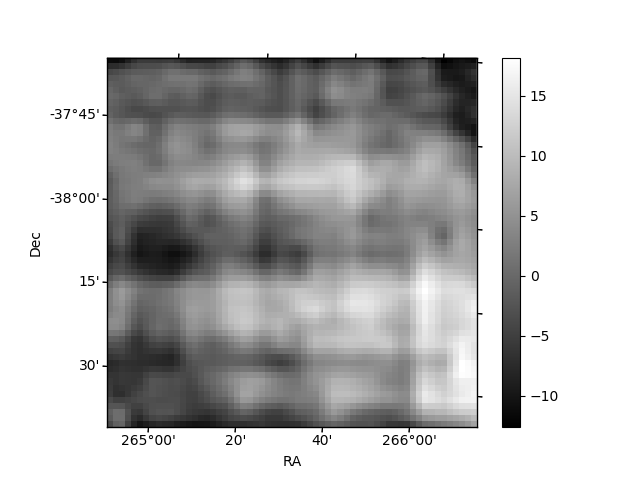
Histogram calculated using DETX and DETY for each event in the final _common_clean file
| Quadrant A | 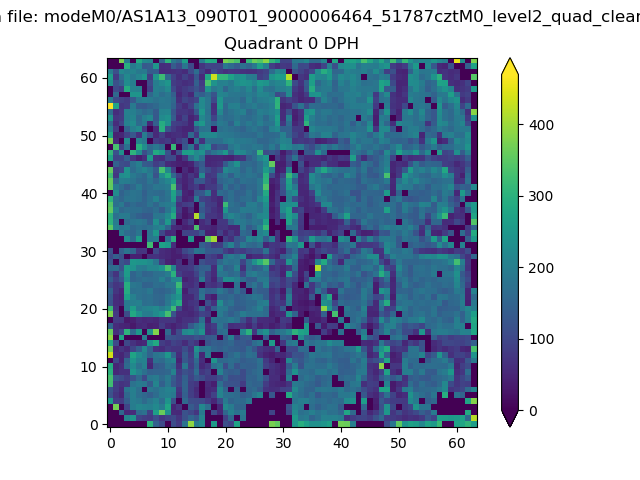 |
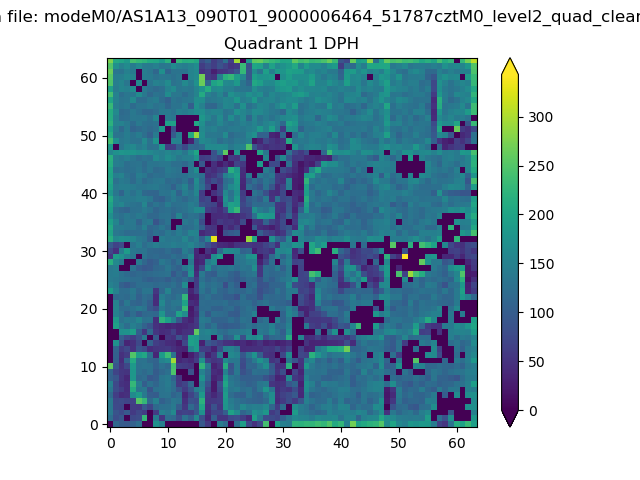 |
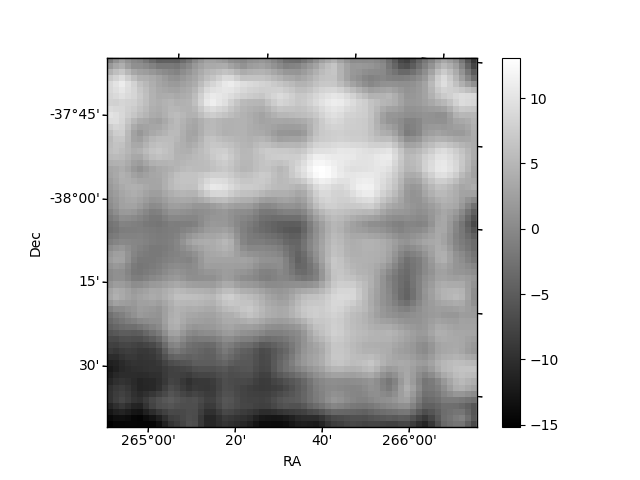
Quadrant B |
|---|---|---|---|
| Quadrant D | 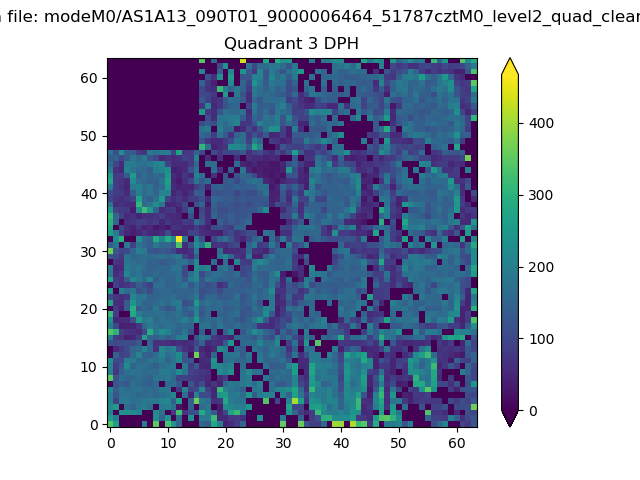 |
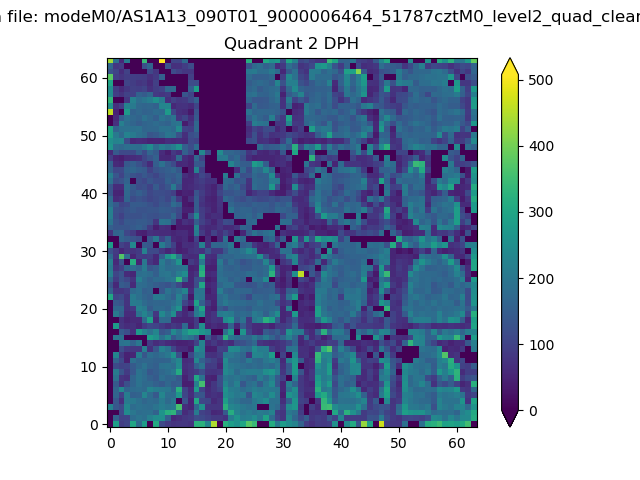 |
Quadrant C |
| Plot type | Count rate plots | Images |
|---|---|---|
| Comparison with Poisson distribution Blue bars denote a histogram of data divided into 1 sec bins. Red curve is a Poisson curve with rate = median count rate of data. |
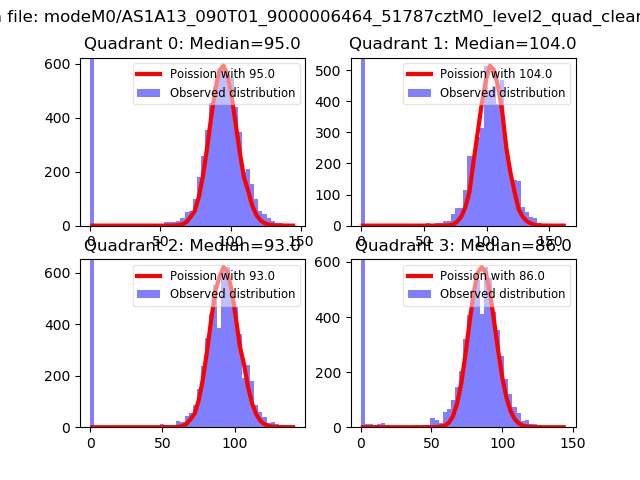 |
 |
| Quadrant-wise count rates Data is divided into 100 sec bins |
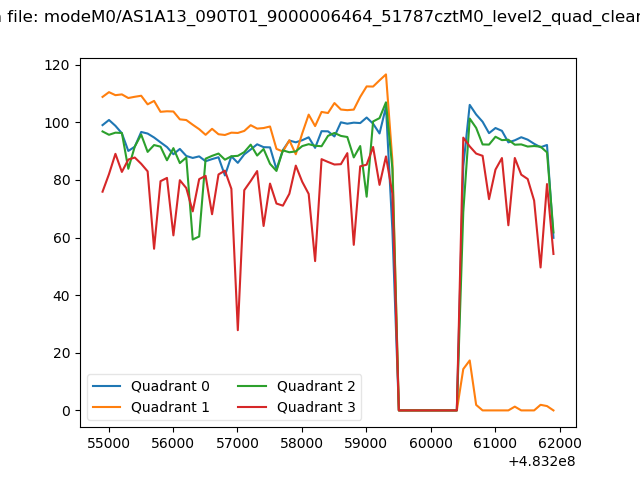 |
|
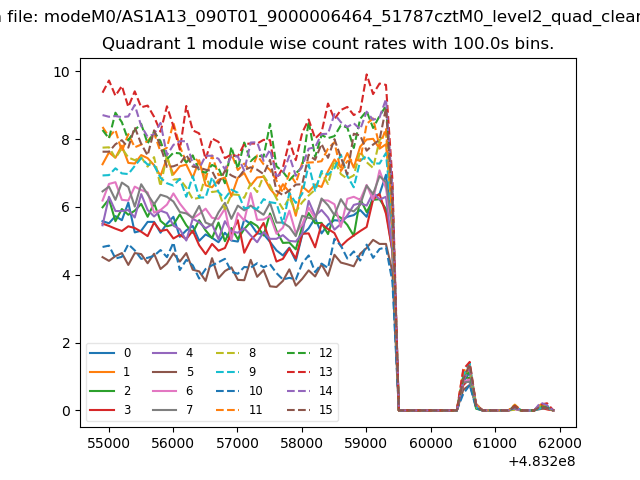
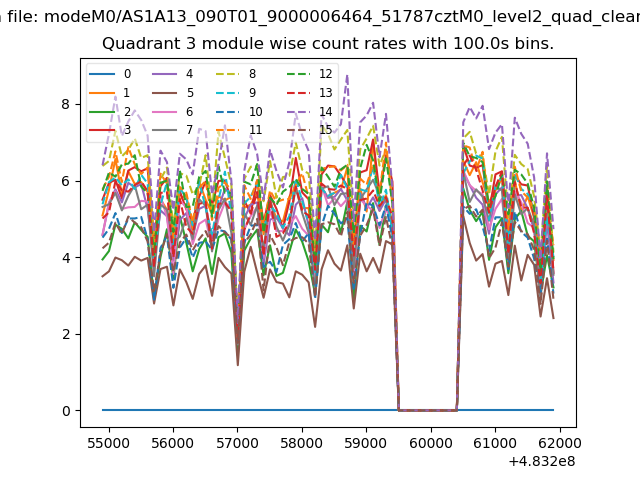
| Module-wise count rates for Quadrant A Data is divided into 100 sec bins |
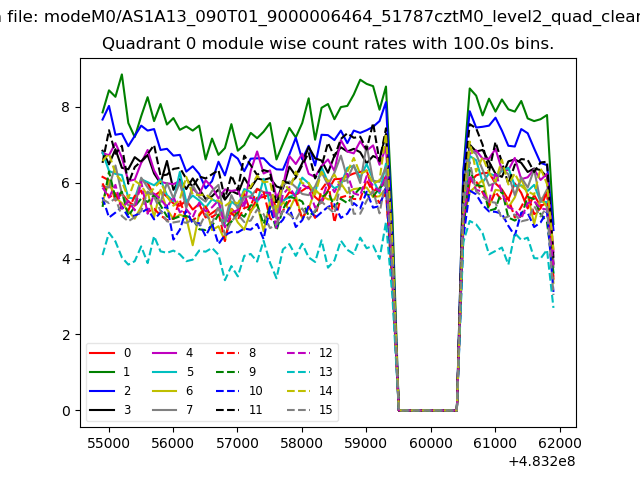 |
 |
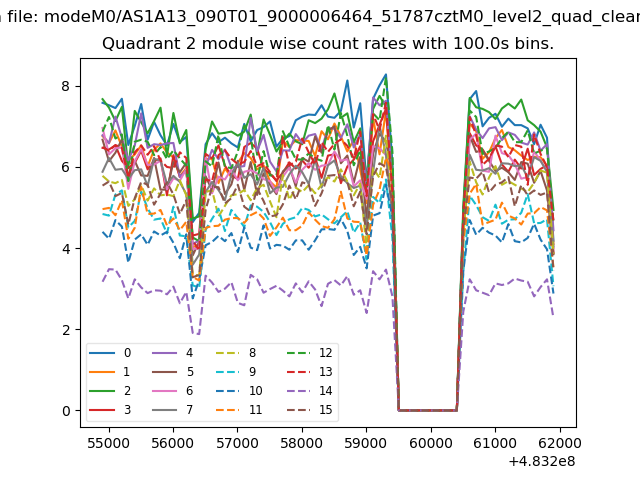
| Module-wise count rates for Quadrant B Data is divided into 100 sec bins |
 |
 |
| Module-wise count rates for Quadrant C Data is divided into 100 sec bins |
 |
 |
| Module-wise count rates for Quadrant D Data is divided into 100 sec bins |
 |
 |
| Parameter | Plot |
|---|---|
| CZT HV Monitor | 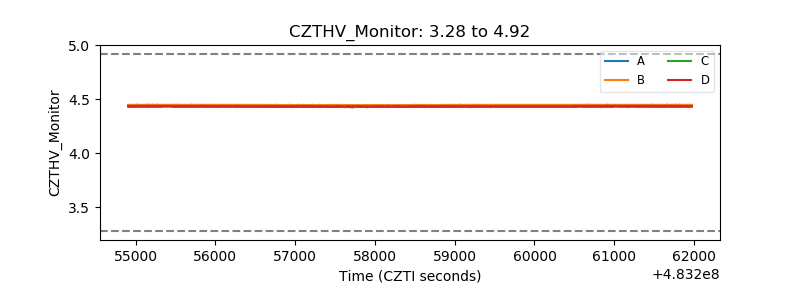 |
| D_VDD | 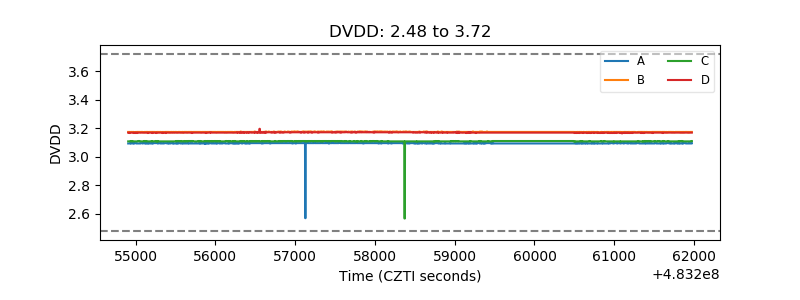 |
| Temperature 1 | 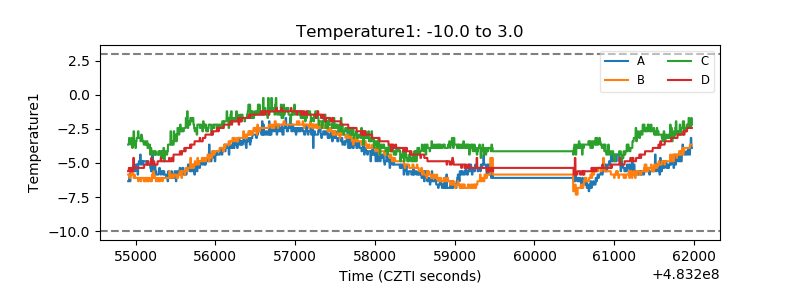 |
| Veto HV Monitor | 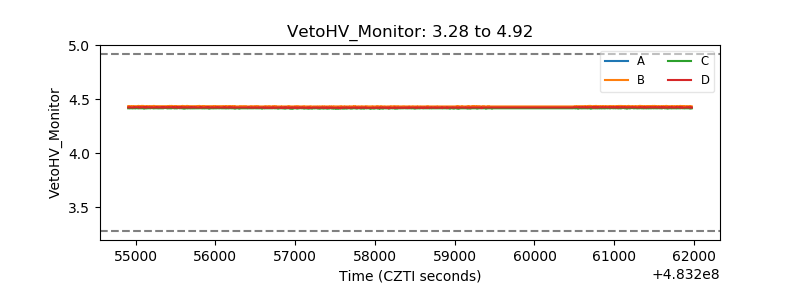 |
| Veto LLD | 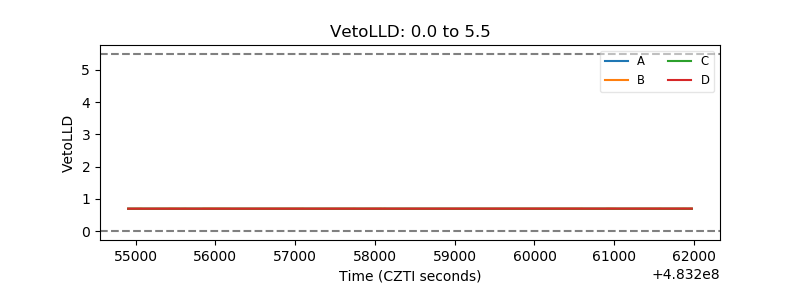 |
| Alpha Counter | 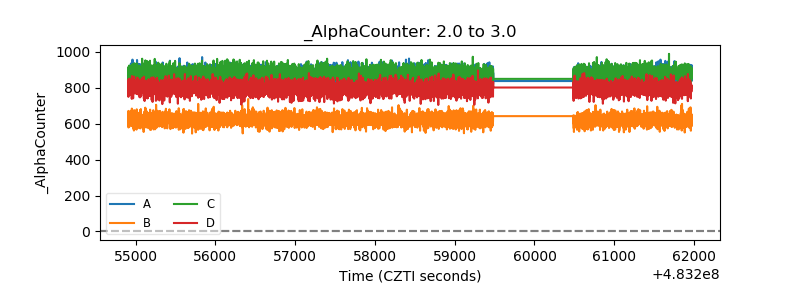 |
| _CPM_Rate | 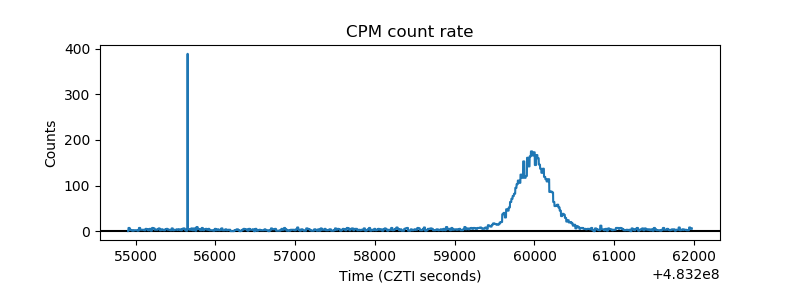 |
| CZT Counter | 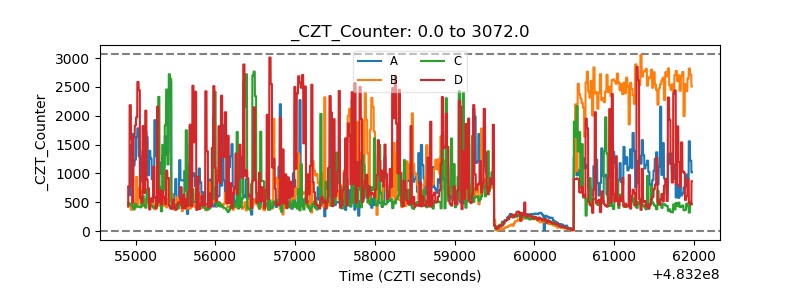 |
| +2.5 Volts monitor | 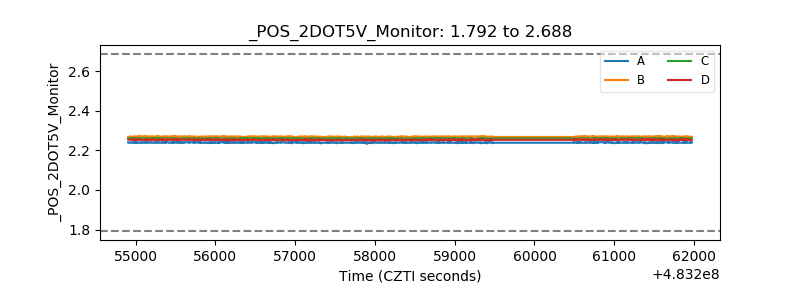 |
| +5 Volts monitor | 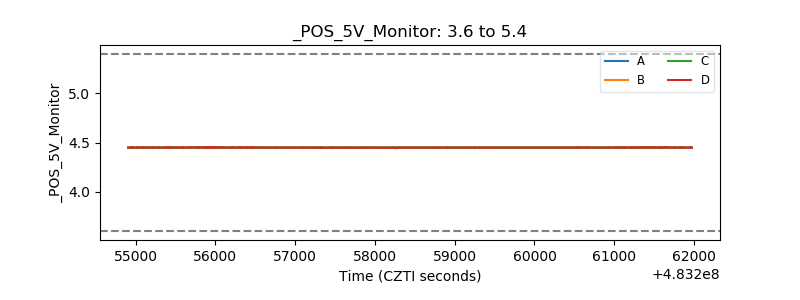 |
| _ROLL_ROT | 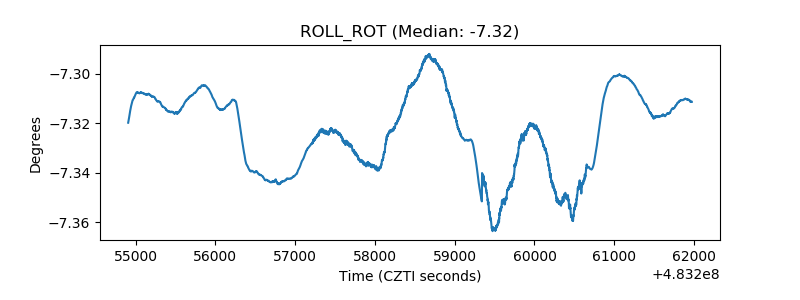 |
| _Roll_DEC |  |
| _Roll_RA | 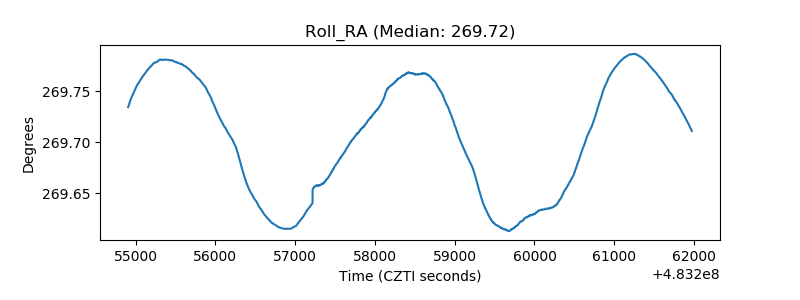 |
| Veto Counter | 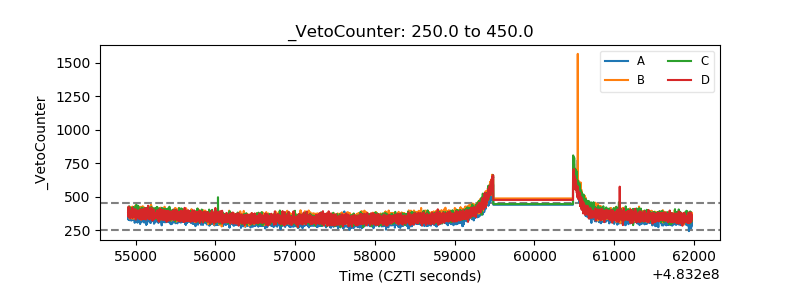 |