| Param | Original file | Final file |
|---|---|---|
| Filename | modeM0/AS1A13_090T01_9000006464_51788cztM0_level2.fits | modeM0/AS1A13_090T01_9000006464_51788cztM0_level2_quad_clean.evt |
| Size (bytes) | 899,251,200 | 73,794,240 |
| Size | 857.6 MB | 70.4 MB |
| Events in quadrant A | 8,688,168 | 490,088 |
| Events in quadrant B | 12,066,336 | 273,648 |
| Events in quadrant C | 3,982,232 | 577,722 |
| Events in quadrant D | 8,047,997 | 438,973 |
| Mode M9 | |||
|---|---|---|---|
| Quadrant | BADHDUFLAG | Total packets | Discarded packets |
| A | 0 | 7 | 0 |
| B | 0 | 7 | 0 |
| C | 0 | 7 | 0 |
| D | 0 | 7 | 0 |
| Mode SS | |||
|---|---|---|---|
| Quadrant | BADHDUFLAG | Total packets | Discarded packets |
| A | 0 | 132 | 0 |
| B | 0 | 132 | 0 |
| C | 0 | 132 | 0 |
| D | 0 | 132 | 0 |
| Mode M0 | |||
|---|---|---|---|
| Quadrant | BADHDUFLAG | Total packets | Discarded packets |
| A | 0 | 30348 | 1 |
| B | 0 | 40308 | 1 |
| C | 0 | 16327 | 1 |
| D | 0 | 28349 | 1 |
| Quadrant | Total seconds | Saturated seconds | Saturation percentage |
|---|---|---|---|
| A | 6503 | 1394 | 21.436260% |
| B | 6504 | 4117 | 63.299508% |
| C | 6504 | 273 | 4.197417% |
| D | 6504 | 1615 | 24.830873% |
Noise dominated data is calculated using 1-second bins in cleaned event files. If a bin has >2000 counts, and if more than 50% of those come from <1% of pixels, then it is considered to be noise-dominated and hence unusable.
| Quadrant | # 1 sec bins | Bins with >0 counts | Bins with >2000 counts | High rate bins dominated by noise | Noise dominated (total time) | Noise dominated (detector-on time) | Marked lightcurve |
|---|---|---|---|---|---|---|---|
| A | 7163 | 6503 | 1155 | 1155 | 16.12% | 17.76% | 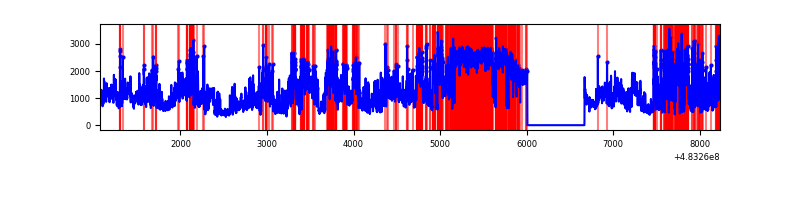 |
| B | 7164 | 6504 | 3567 | 3567 | 49.79% | 54.84% | 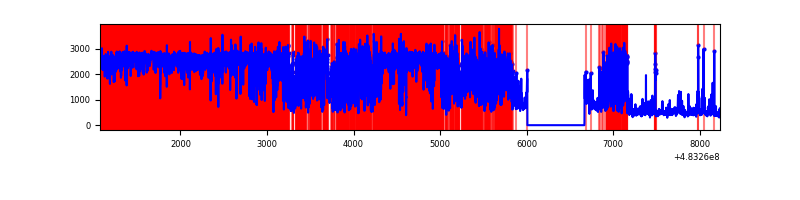 |
| C | 7164 | 6504 | 145 | 145 | 2.02% | 2.23% | 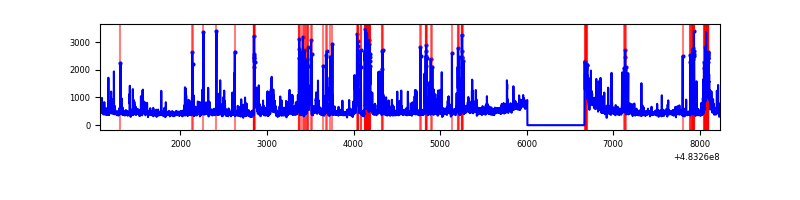 |
| D | 7164 | 6504 | 1395 | 1395 | 19.47% | 21.45% | 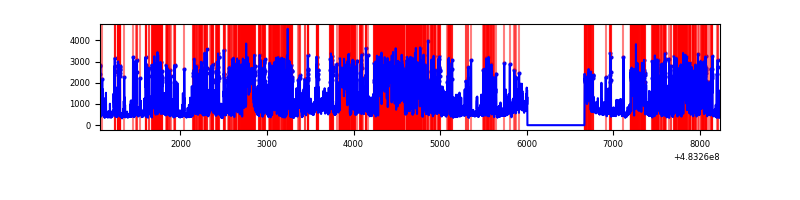 |
Top three noisy pixels from each quadrant. If the there are fewer than three noisy pixels in the level2.evt file, extra rows are filled as -1
| Pixel properties | Quadrant properties | ||||||
|---|---|---|---|---|---|---|---|
| Quadrant | DetID | PixID | Counts | Sigma | Mean | Median | Sigma |
| A | 12 | 3 | 1904919 | 11872.77 | 649 | 631 | 160.4 |
| A | 4 | 249 | 1719191 | 10714.8 | 649 | 631 | 160.4 |
| A | 15 | 174 | 764780 | 4764.28 | 649 | 631 | 160.4 |
| B | 10 | 128 | 9123941 | 94350.33 | 445 | 429 | 96.7 |
| B | 4 | 206 | 305444 | 3154.3 | 445 | 429 | 96.7 |
| B | 4 | 81 | 244575 | 2524.82 | 445 | 429 | 96.7 |
| C | 15 | 218 | 178465 | 948.8 | 690 | 682 | 187.4 |
| C | 13 | 3 | 167293 | 889.17 | 690 | 682 | 187.4 |
| C | 14 | 245 | 164696 | 875.31 | 690 | 682 | 187.4 |
| D | 11 | 129 | 4446614 | 25667.52 | 619 | 597 | 173.2 |
| D | 8 | 176 | 403918 | 2328.43 | 619 | 597 | 173.2 |
| D | 3 | 12 | 310237 | 1787.6 | 619 | 597 | 173.2 |
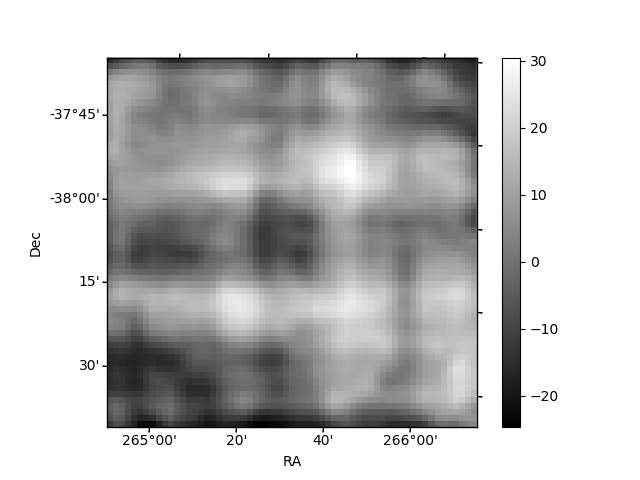
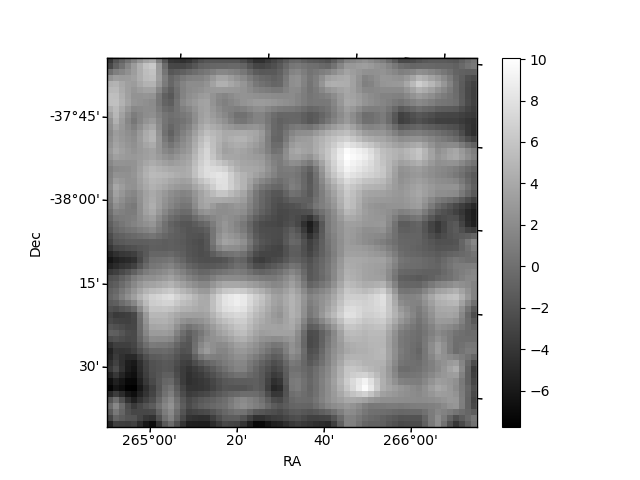
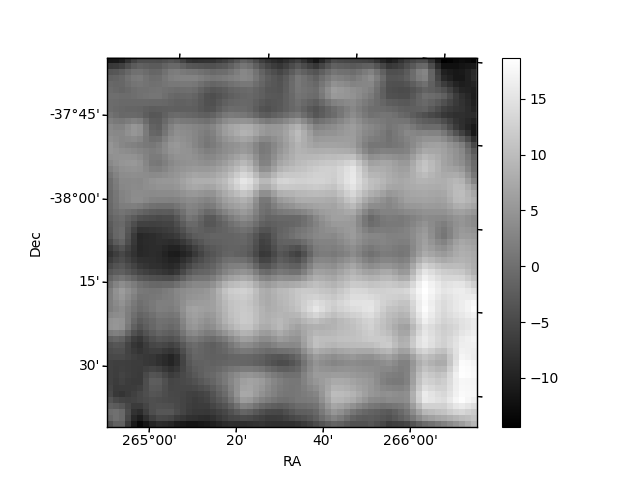
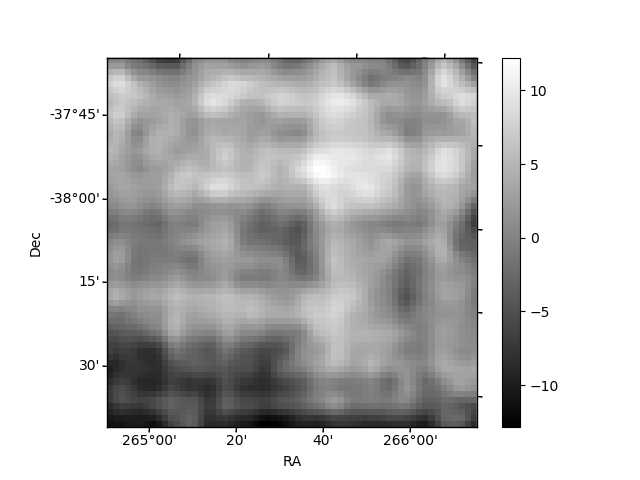
Histogram calculated using DETX and DETY for each event in the final _common_clean file
| Quadrant A | 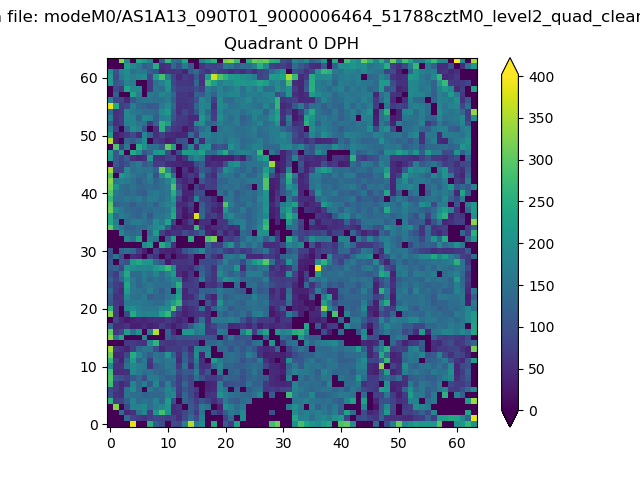 |
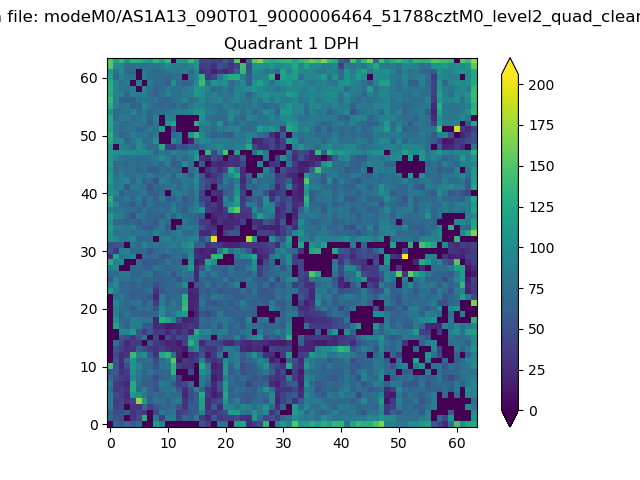 |
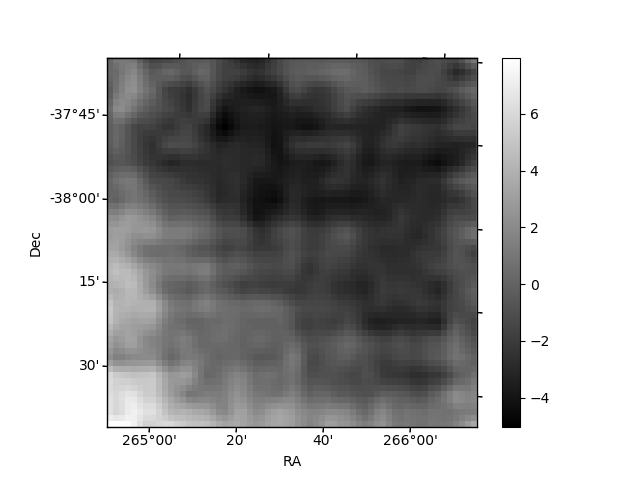
Quadrant B |
|---|---|---|---|
| Quadrant D | 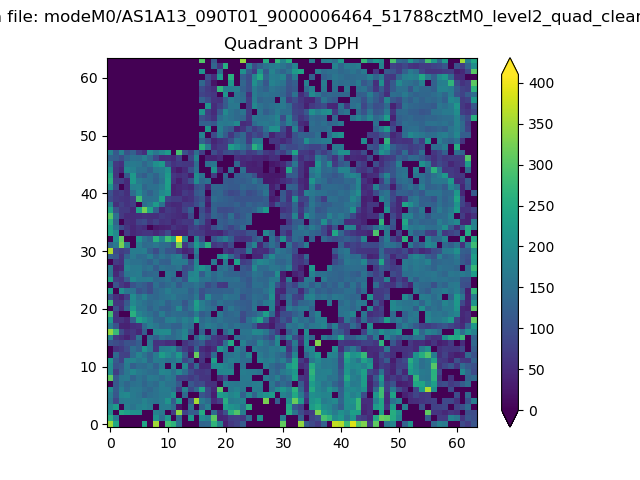 |
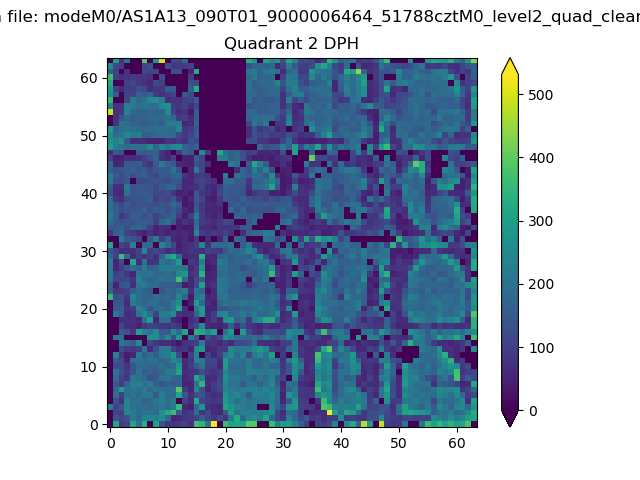 |
Quadrant C |
| Plot type | Count rate plots | Images |
|---|---|---|
| Comparison with Poisson distribution Blue bars denote a histogram of data divided into 1 sec bins. Red curve is a Poisson curve with rate = median count rate of data. |
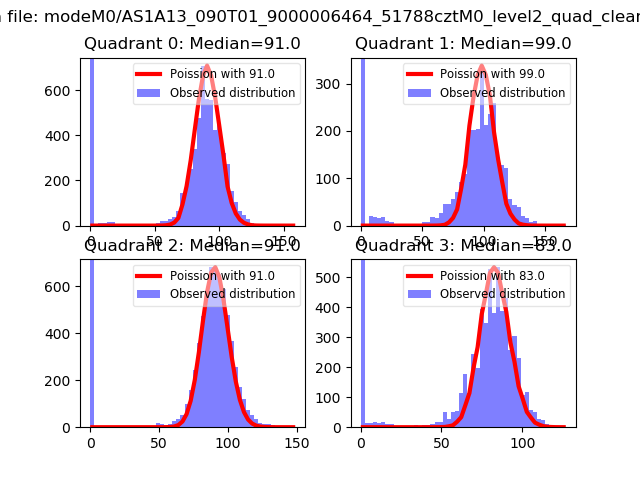 |
 |
| Quadrant-wise count rates Data is divided into 100 sec bins |
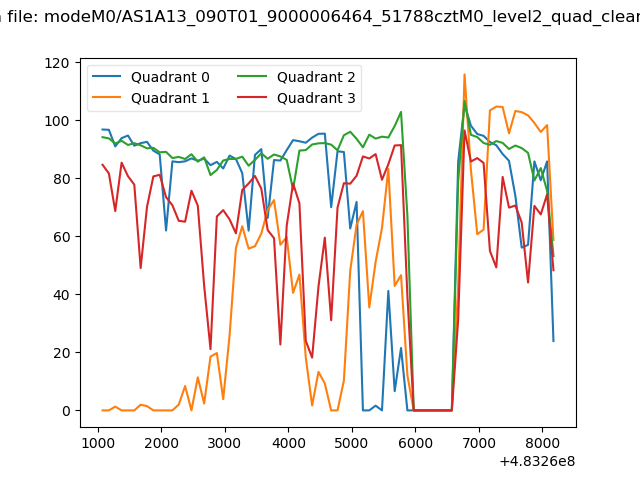 |
|
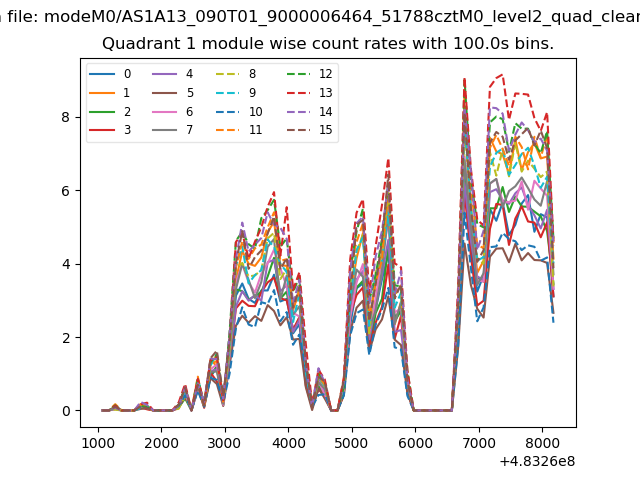
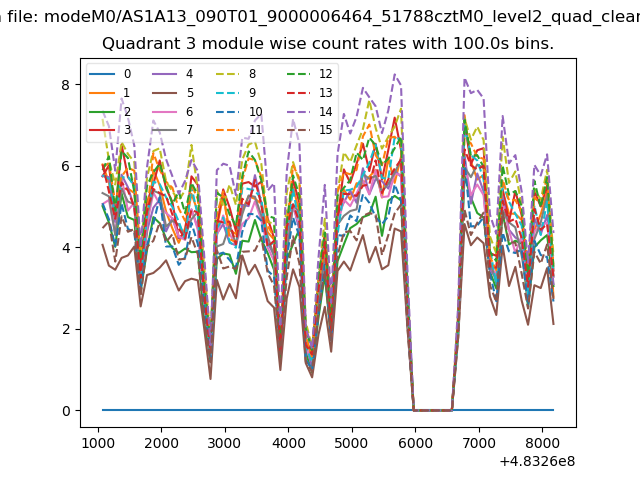
| Module-wise count rates for Quadrant A Data is divided into 100 sec bins |
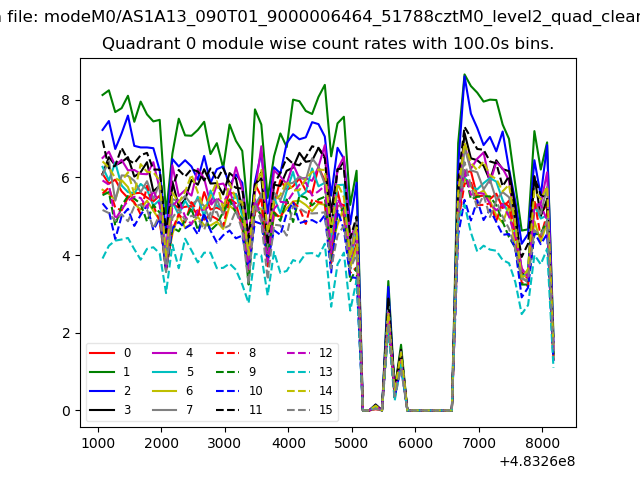 |
 |
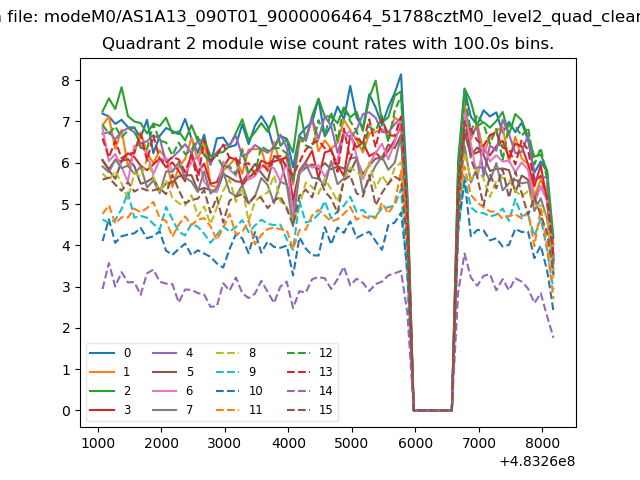
| Module-wise count rates for Quadrant B Data is divided into 100 sec bins |
 |
 |
| Module-wise count rates for Quadrant C Data is divided into 100 sec bins |
 |
 |
| Module-wise count rates for Quadrant D Data is divided into 100 sec bins |
 |
 |
| Parameter | Plot |
|---|---|
| CZT HV Monitor | 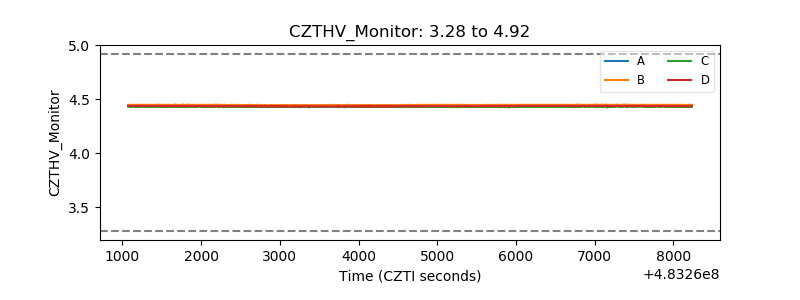 |
| D_VDD | 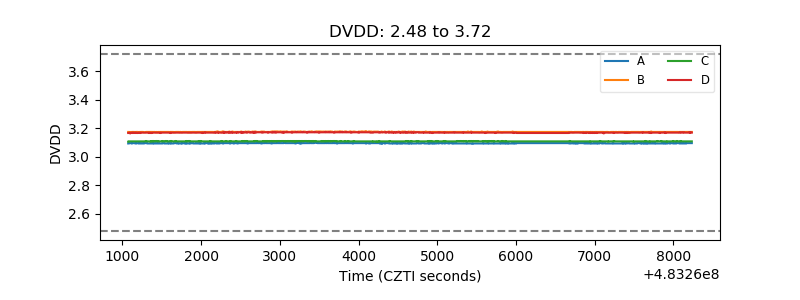 |
| Temperature 1 | 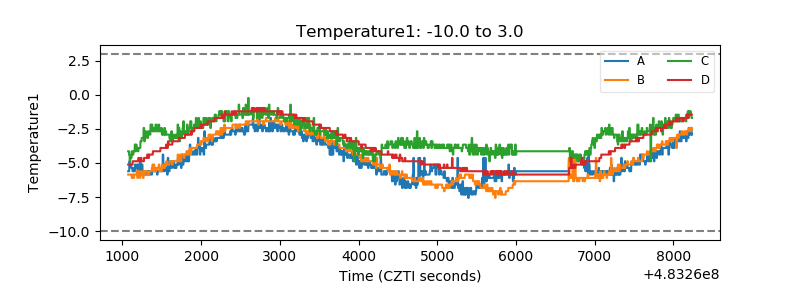 |
| Veto HV Monitor |  |
| Veto LLD | 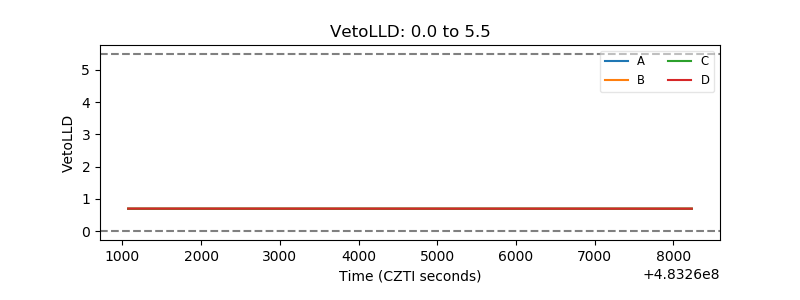 |
| Alpha Counter | 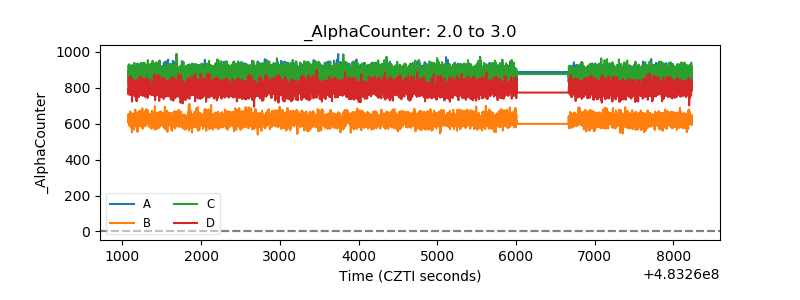 |
| _CPM_Rate | 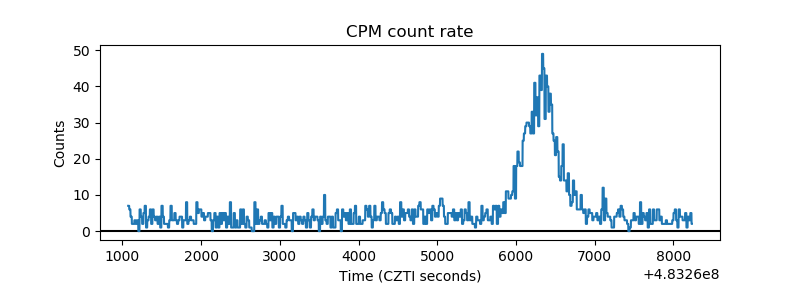 |
| CZT Counter | 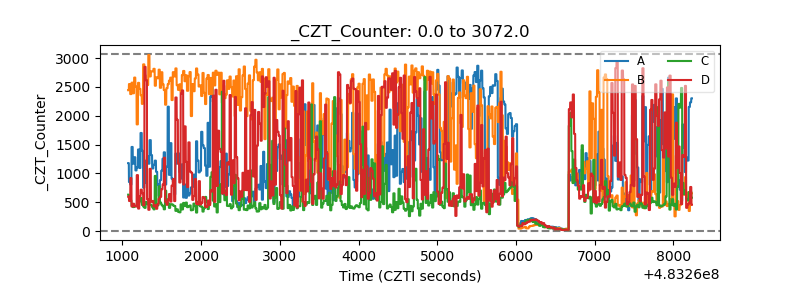 |
| +2.5 Volts monitor | 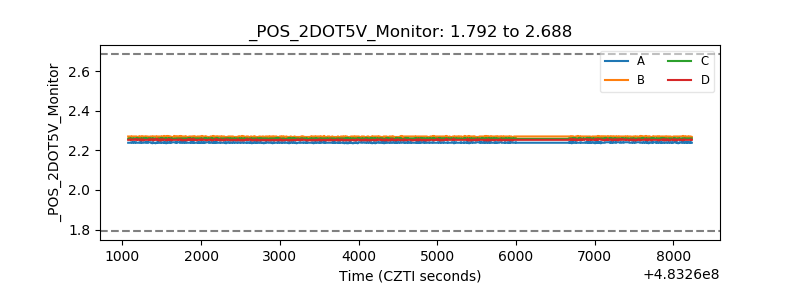 |
| +5 Volts monitor | 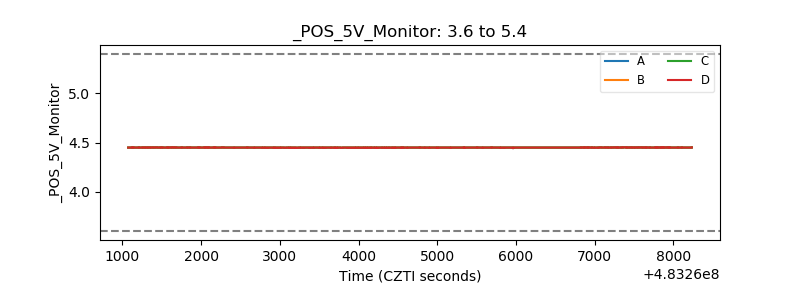 |
| _ROLL_ROT | 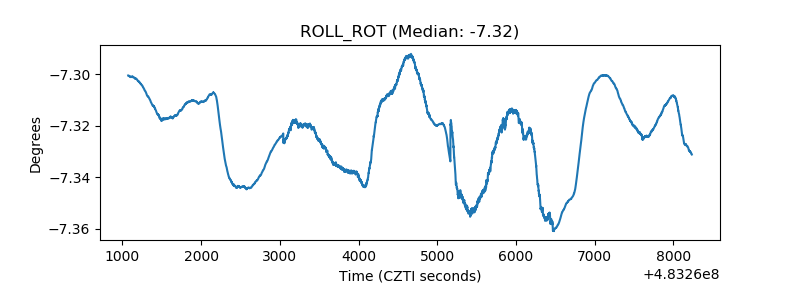 |
| _Roll_DEC | 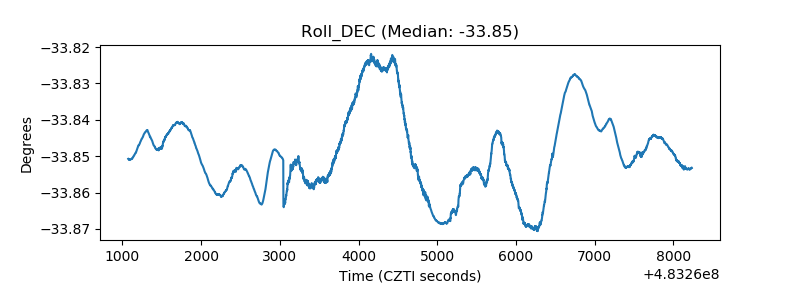 |
| _Roll_RA | 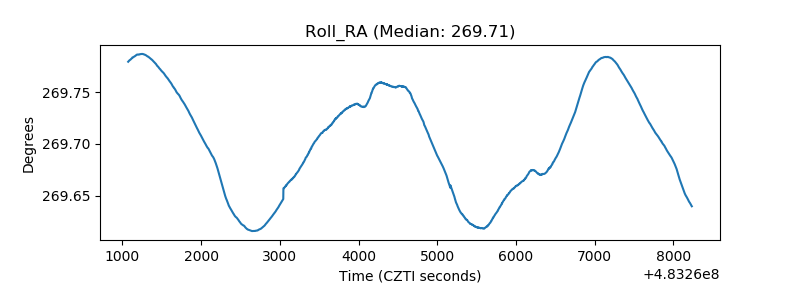 |
| Veto Counter | 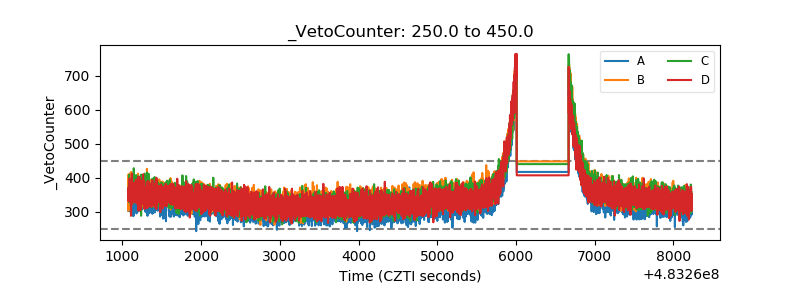 |