| Param | Original file | Final file |
|---|---|---|
| Filename | modeM0/AS1A13_090T01_9000006464_51789cztM0_level2.fits | modeM0/AS1A13_090T01_9000006464_51789cztM0_level2_quad_clean.evt |
| Size (bytes) | 869,834,880 | 95,244,480 |
| Size | 829.5 MB | 90.8 MB |
| Events in quadrant A | 7,758,584 | 623,216 |
| Events in quadrant B | 8,226,062 | 593,959 |
| Events in quadrant C | 5,527,662 | 650,692 |
| Events in quadrant D | 10,097,926 | 486,236 |
| Mode SS | |||
|---|---|---|---|
| Quadrant | BADHDUFLAG | Total packets | Discarded packets |
| A | 0 | 152 | 0 |
| B | 0 | 152 | 0 |
| C | 0 | 152 | 0 |
| D | 0 | 152 | 0 |
| Mode M0 | |||
|---|---|---|---|
| Quadrant | BADHDUFLAG | Total packets | Discarded packets |
| A | 0 | 28280 | 0 |
| B | 0 | 29593 | 0 |
| C | 0 | 21648 | 0 |
| D | 0 | 35280 | 0 |
| Quadrant | Total seconds | Saturated seconds | Saturation percentage |
|---|---|---|---|
| A | 7608 | 1143 | 15.023659% |
| B | 7608 | 1904 | 25.026288% |
| C | 7608 | 642 | 8.438486% |
| D | 7608 | 2248 | 29.547844% |
Noise dominated data is calculated using 1-second bins in cleaned event files. If a bin has >2000 counts, and if more than 50% of those come from <1% of pixels, then it is considered to be noise-dominated and hence unusable.
| Quadrant | # 1 sec bins | Bins with >0 counts | Bins with >2000 counts | High rate bins dominated by noise | Noise dominated (total time) | Noise dominated (detector-on time) | Marked lightcurve |
|---|---|---|---|---|---|---|---|
| A | 7608 | 7608 | 580 | 580 | 7.62% | 7.62% | 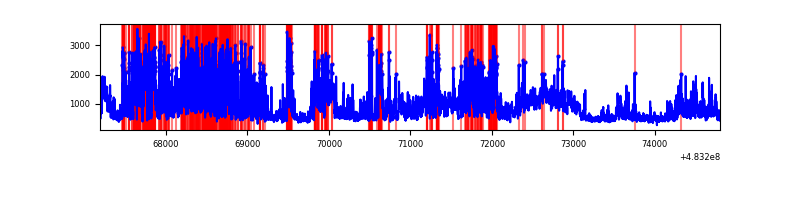 |
| B | 7608 | 7608 | 1339 | 1339 | 17.60% | 17.60% | 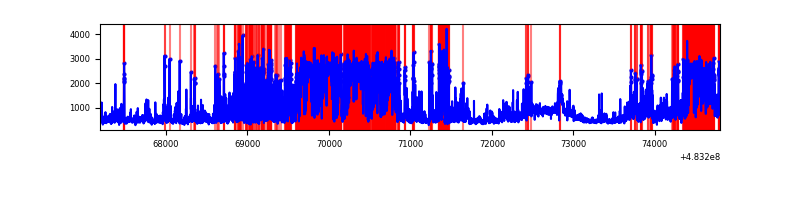 |
| C | 7608 | 7608 | 373 | 373 | 4.90% | 4.90% | 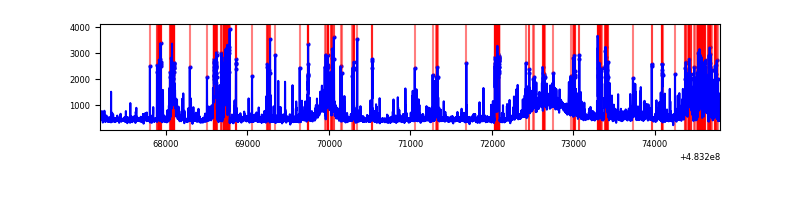 |
| D | 7607 | 7607 | 1915 | 1915 | 25.17% | 25.17% | 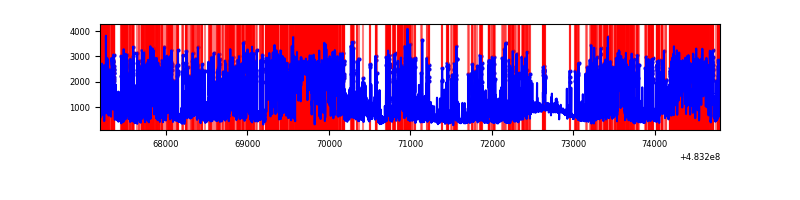 |
Top three noisy pixels from each quadrant. If the there are fewer than three noisy pixels in the level2.evt file, extra rows are filled as -1
| Pixel properties | Quadrant properties | ||||||
|---|---|---|---|---|---|---|---|
| Quadrant | DetID | PixID | Counts | Sigma | Mean | Median | Sigma |
| A | 2 | 143 | 2076590 | 10213.29 | 827 | 806 | 203.2 |
| A | 4 | 175 | 1346020 | 6618.74 | 827 | 806 | 203.2 |
| A | 12 | 3 | 149004 | 729.17 | 827 | 806 | 203.2 |
| B | 10 | 128 | 4016023 | 23765.21 | 777 | 748 | 169.0 |
| B | 4 | 206 | 490366 | 2897.9 | 777 | 748 | 169.0 |
| B | 0 | 171 | 152500 | 898.17 | 777 | 748 | 169.0 |
| C | 13 | 3 | 811037 | 3627.03 | 822 | 816 | 223.4 |
| C | 12 | 252 | 205088 | 914.44 | 822 | 816 | 223.4 |
| C | 0 | 209 | 188970 | 842.29 | 822 | 816 | 223.4 |
| D | 11 | 129 | 5740828 | 27919.49 | 747 | 721 | 205.6 |
| D | 3 | 12 | 353533 | 1716.05 | 747 | 721 | 205.6 |
| D | 8 | 176 | 326709 | 1585.58 | 747 | 721 | 205.6 |
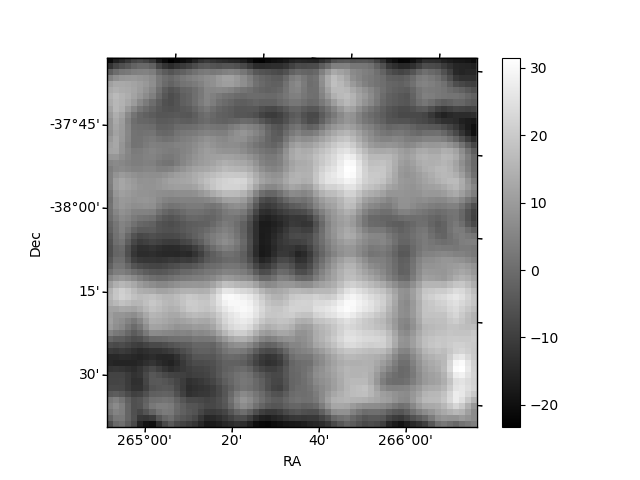
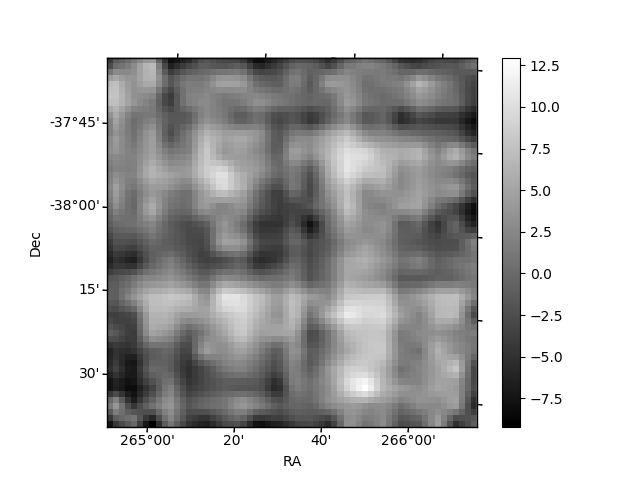
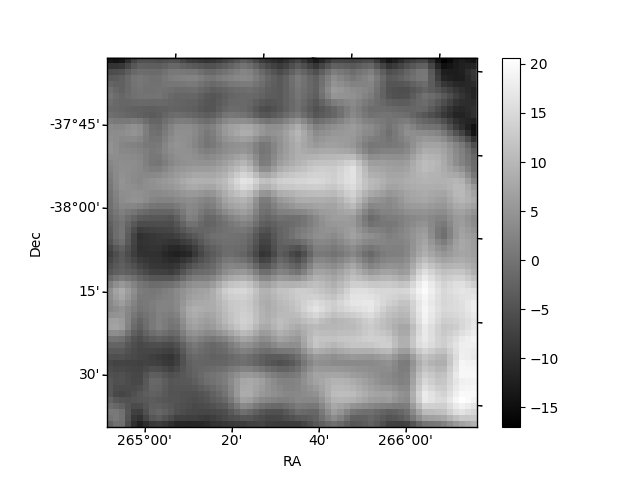
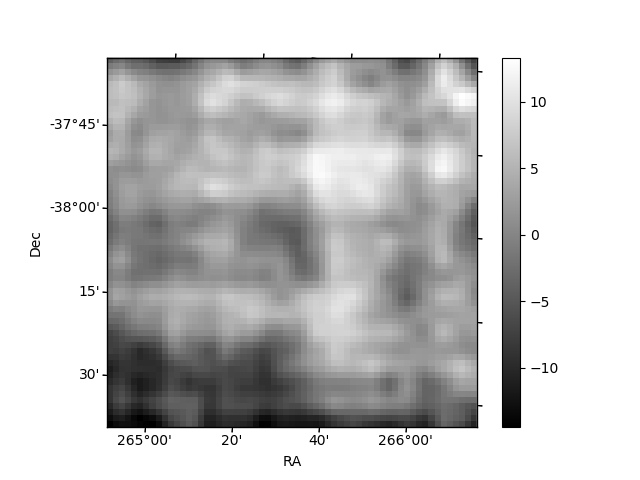
Histogram calculated using DETX and DETY for each event in the final _common_clean file
| Quadrant A | 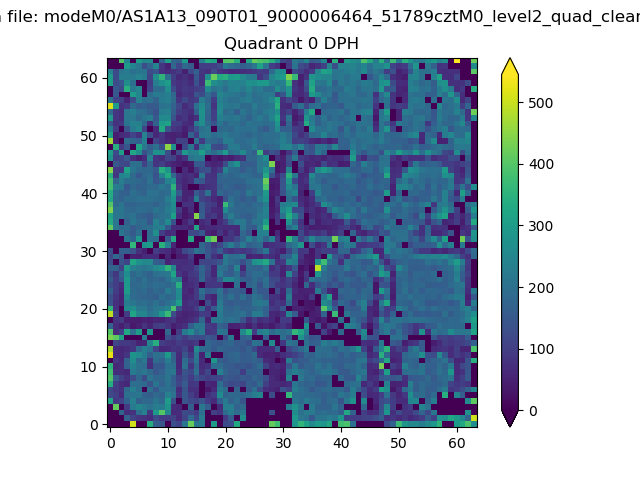 |
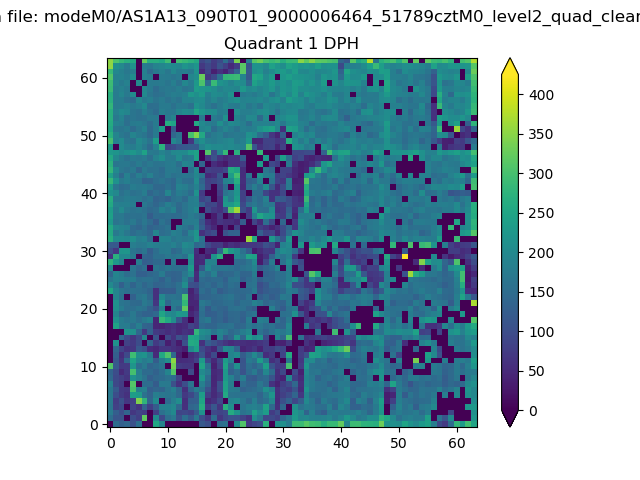 |
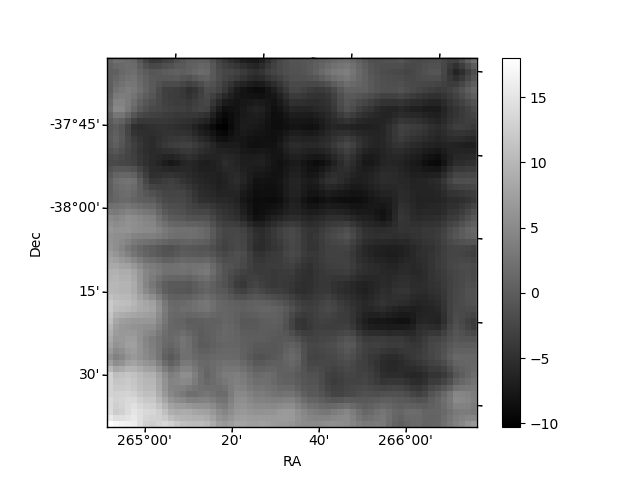
Quadrant B |
|---|---|---|---|
| Quadrant D | 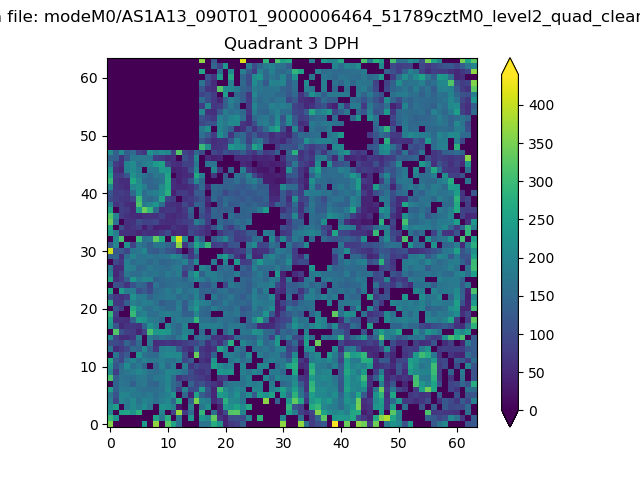 |
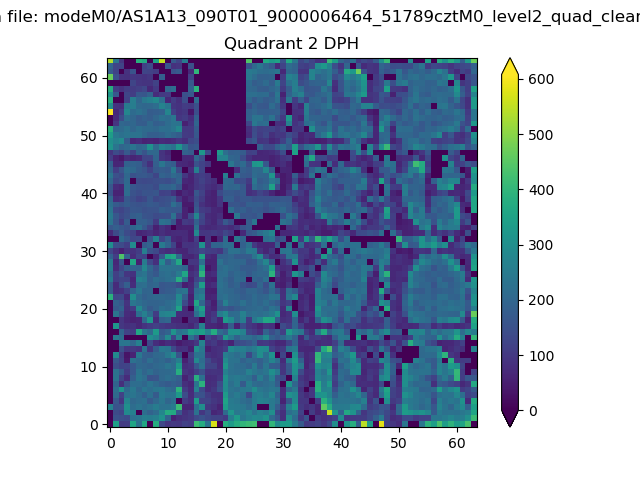 |
Quadrant C |
| Plot type | Count rate plots | Images |
|---|---|---|
| Comparison with Poisson distribution Blue bars denote a histogram of data divided into 1 sec bins. Red curve is a Poisson curve with rate = median count rate of data. |
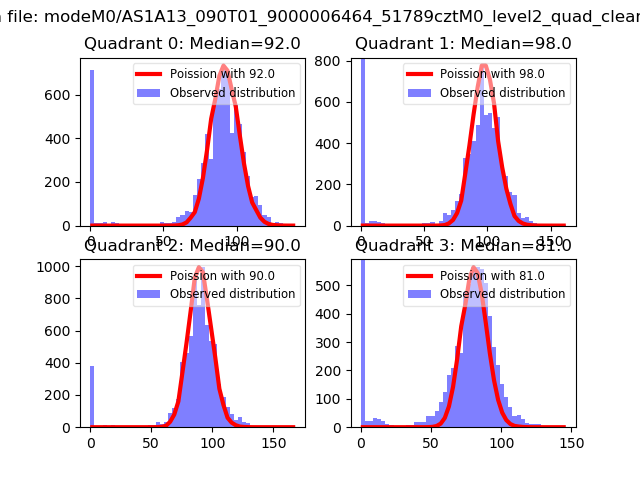 |
 |
| Quadrant-wise count rates Data is divided into 100 sec bins |
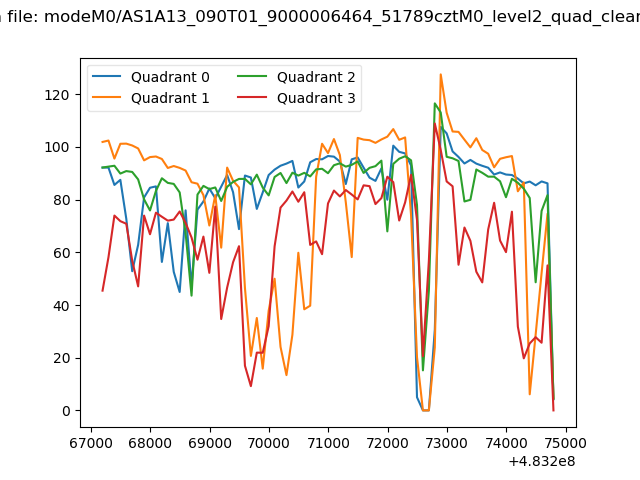 |
|
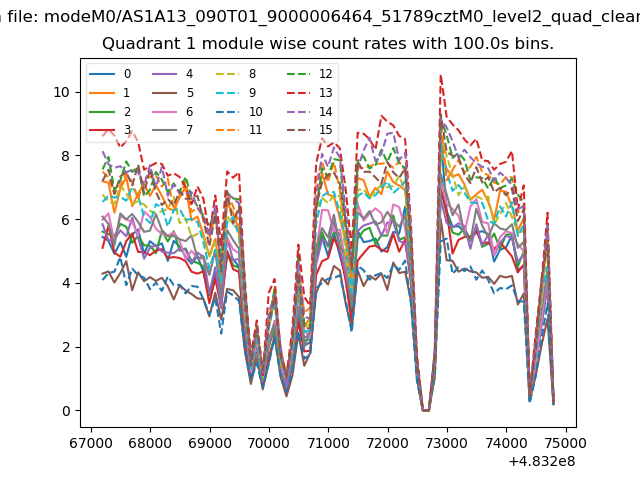
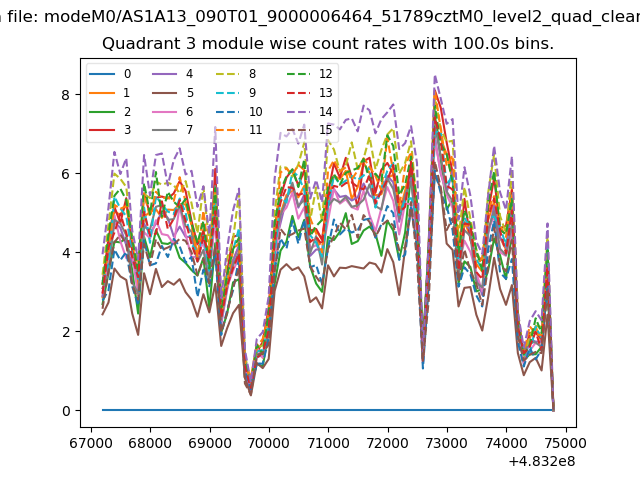
| Module-wise count rates for Quadrant A Data is divided into 100 sec bins |
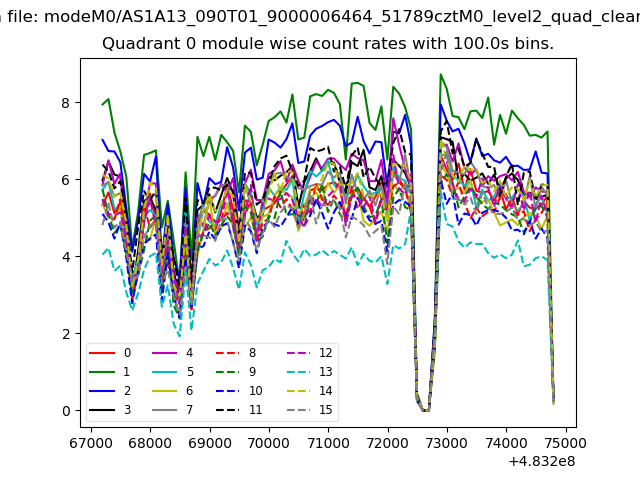 |
 |
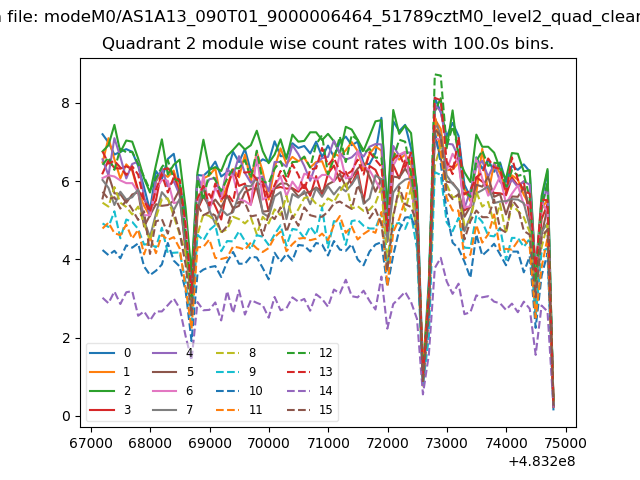
| Module-wise count rates for Quadrant B Data is divided into 100 sec bins |
 |
 |
| Module-wise count rates for Quadrant C Data is divided into 100 sec bins |
 |
 |
| Module-wise count rates for Quadrant D Data is divided into 100 sec bins |
 |
 |
| Parameter | Plot |
|---|---|
| CZT HV Monitor | 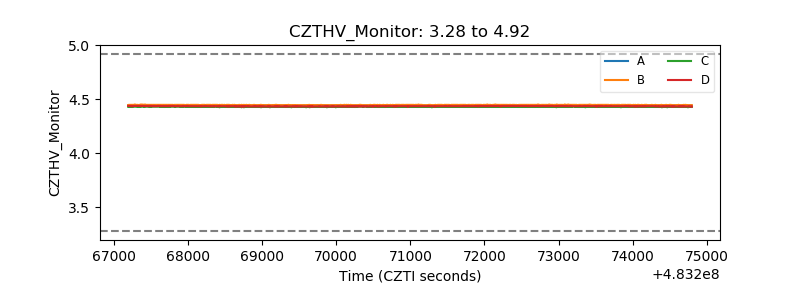 |
| D_VDD | 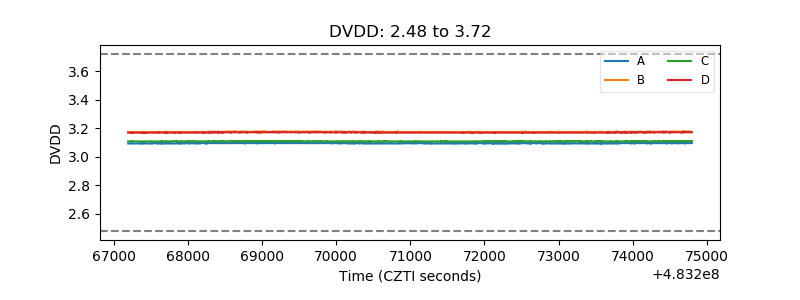 |
| Temperature 1 | 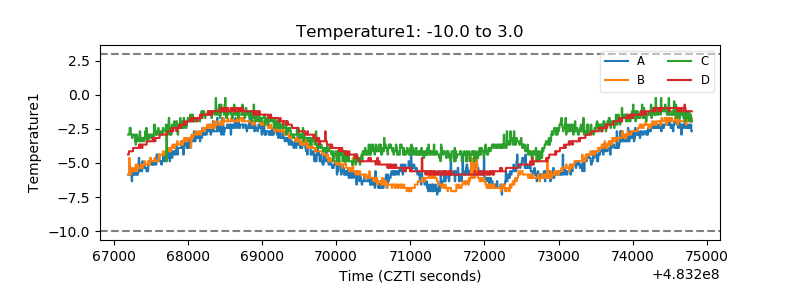 |
| Veto HV Monitor | 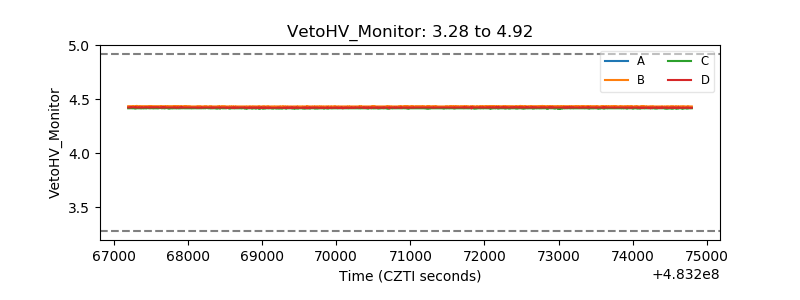 |
| Veto LLD | 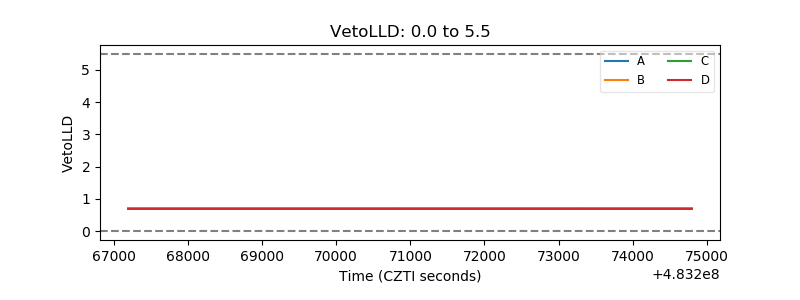 |
| Alpha Counter | 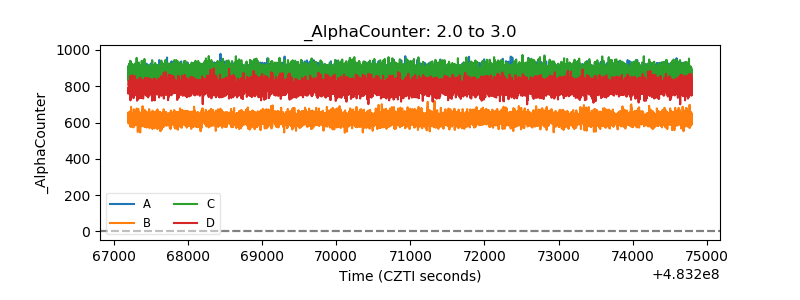 |
| _CPM_Rate | 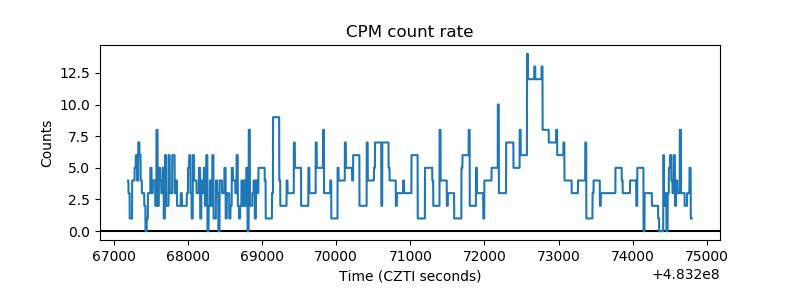 |
| CZT Counter | 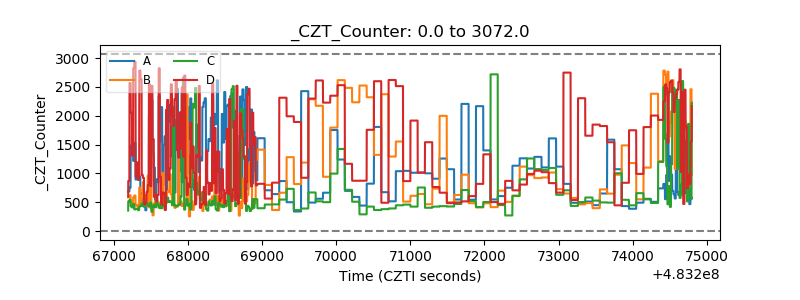 |
| +2.5 Volts monitor | 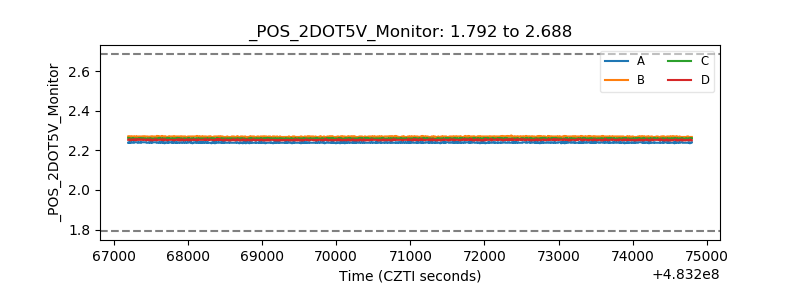 |
| +5 Volts monitor | 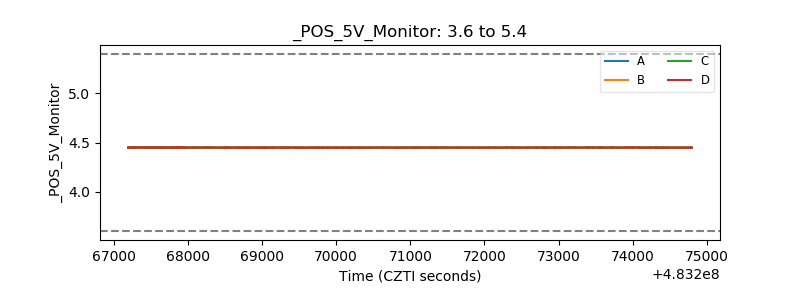 |
| _ROLL_ROT | 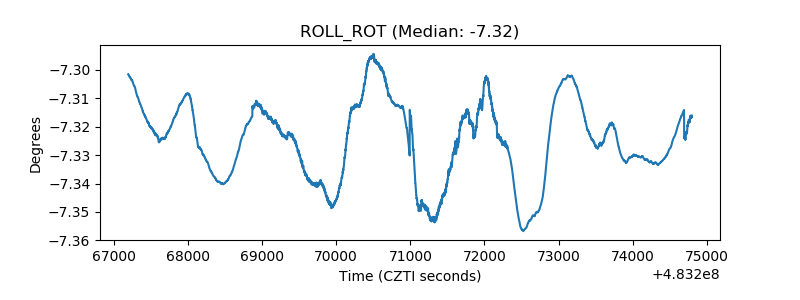 |
| _Roll_DEC | 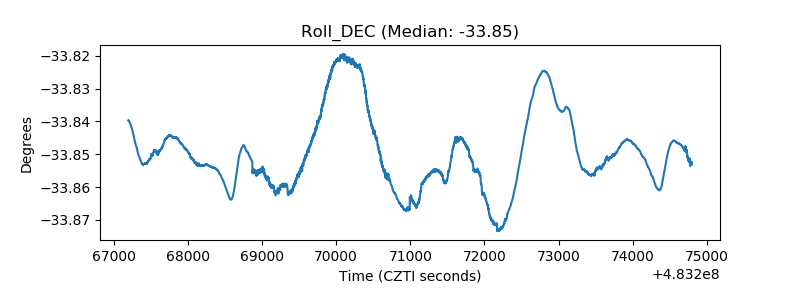 |
| _Roll_RA | 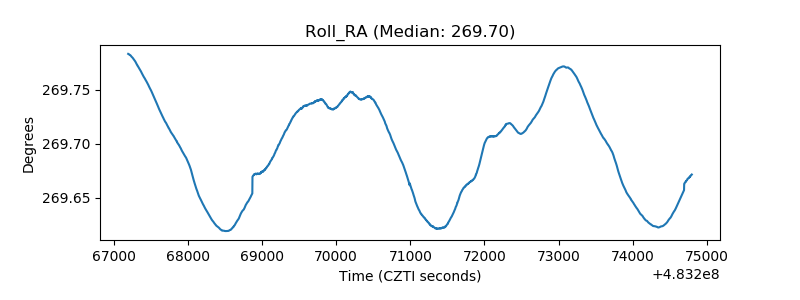 |
| Veto Counter | 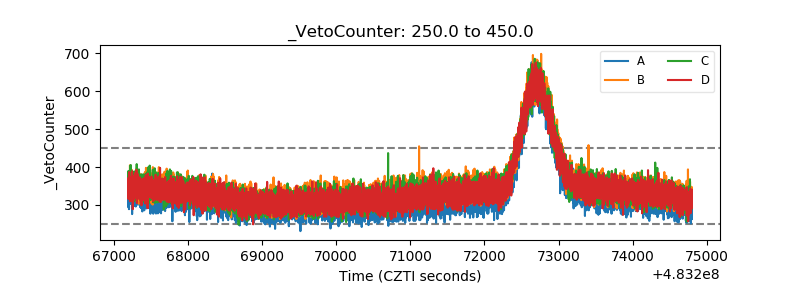 |