| Param | Original file | Final file |
|---|---|---|
| Filename | modeM0/AS1A13_090T01_9000006464_51790cztM0_level2.fits | modeM0/AS1A13_090T01_9000006464_51790cztM0_level2_quad_clean.evt |
| Size (bytes) | 915,410,880 | 92,090,880 |
| Size | 873.0 MB | 87.8 MB |
| Events in quadrant A | 6,178,467 | 650,170 |
| Events in quadrant B | 9,952,570 | 565,737 |
| Events in quadrant C | 5,971,078 | 624,760 |
| Events in quadrant D | 11,203,362 | 424,958 |
| Mode SS | |||
|---|---|---|---|
| Quadrant | BADHDUFLAG | Total packets | Discarded packets |
| A | 0 | 150 | 0 |
| B | 0 | 150 | 0 |
| C | 0 | 150 | 0 |
| D | 0 | 152 | 0 |
| Mode M0 | |||
|---|---|---|---|
| Quadrant | BADHDUFLAG | Total packets | Discarded packets |
| A | 0 | 23400 | 0 |
| B | 0 | 34742 | 2 |
| C | 0 | 22805 | 0 |
| D | 0 | 38472 | 0 |
| Quadrant | Total seconds | Saturated seconds | Saturation percentage |
|---|---|---|---|
| A | 7506 | 508 | 6.767919% |
| B | 7505 | 2129 | 28.367755% |
| C | 7505 | 664 | 8.847435% |
| D | 7505 | 2776 | 36.988674% |
Noise dominated data is calculated using 1-second bins in cleaned event files. If a bin has >2000 counts, and if more than 50% of those come from <1% of pixels, then it is considered to be noise-dominated and hence unusable.
| Quadrant | # 1 sec bins | Bins with >0 counts | Bins with >2000 counts | High rate bins dominated by noise | Noise dominated (total time) | Noise dominated (detector-on time) | Marked lightcurve |
|---|---|---|---|---|---|---|---|
| A | 7506 | 7506 | 416 | 416 | 5.54% | 5.54% | 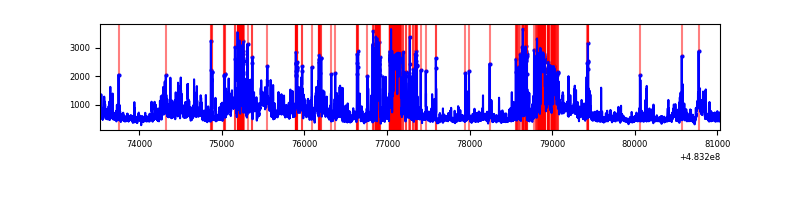 |
| B | 7505 | 7505 | 1893 | 1893 | 25.22% | 25.22% | 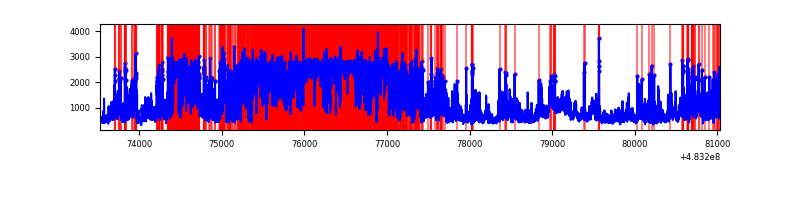 |
| C | 7505 | 7505 | 571 | 571 | 7.61% | 7.61% | 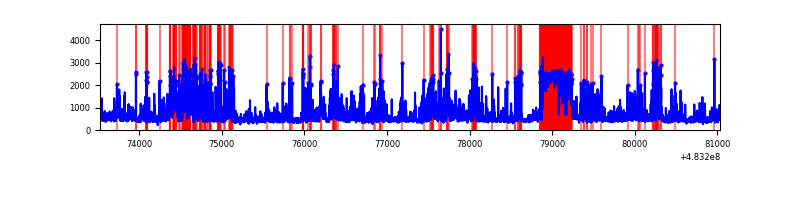 |
| D | 7505 | 7505 | 2534 | 2534 | 33.76% | 33.76% | 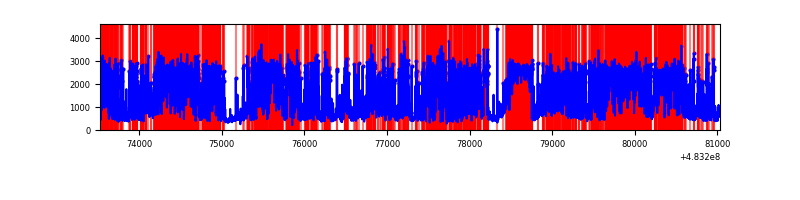 |
Top three noisy pixels from each quadrant. If the there are fewer than three noisy pixels in the level2.evt file, extra rows are filled as -1
| Pixel properties | Quadrant properties | ||||||
|---|---|---|---|---|---|---|---|
| Quadrant | DetID | PixID | Counts | Sigma | Mean | Median | Sigma |
| A | 15 | 174 | 926167 | 4839.69 | 783 | 765 | 191.2 |
| A | 4 | 175 | 567599 | 2964.45 | 783 | 765 | 191.2 |
| A | 5 | 243 | 226891 | 1182.6 | 783 | 765 | 191.2 |
| B | 10 | 128 | 6370920 | 41298.8 | 716 | 690 | 154.2 |
| B | 5 | 32 | 145452 | 938.51 | 716 | 690 | 154.2 |
| B | 0 | 171 | 88695 | 570.54 | 716 | 690 | 154.2 |
| C | 3 | 233 | 791120 | 3934.57 | 739 | 732 | 200.9 |
| C | 13 | 3 | 702689 | 3494.36 | 739 | 732 | 200.9 |
| C | 15 | 178 | 447747 | 2225.25 | 739 | 732 | 200.9 |
| D | 11 | 129 | 7097344 | 40015.06 | 640 | 618 | 177.4 |
| D | 8 | 176 | 436088 | 2455.41 | 640 | 618 | 177.4 |
| D | 2 | 249 | 219977 | 1236.86 | 640 | 618 | 177.4 |
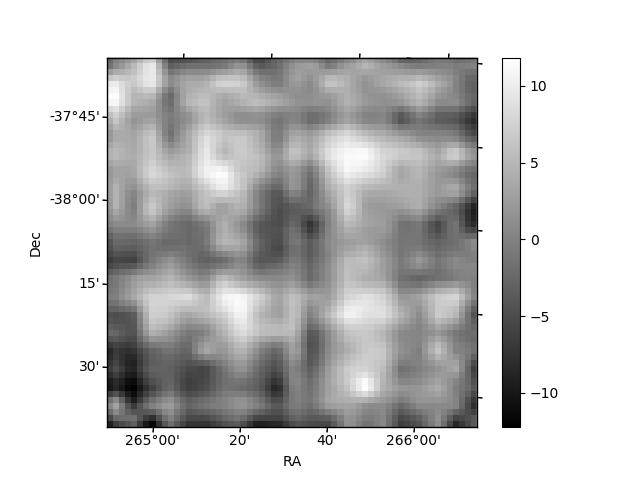
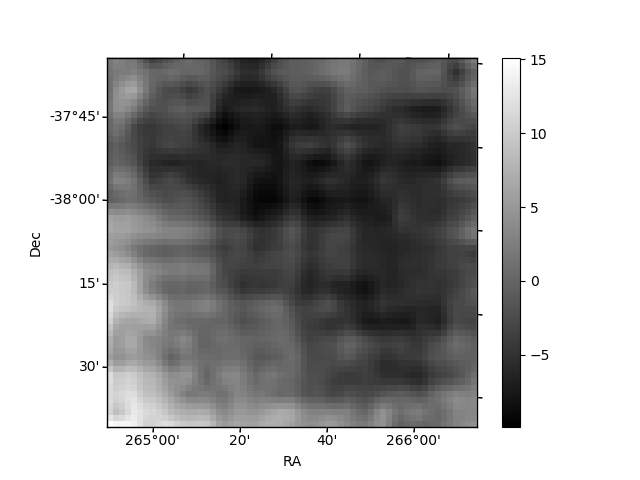
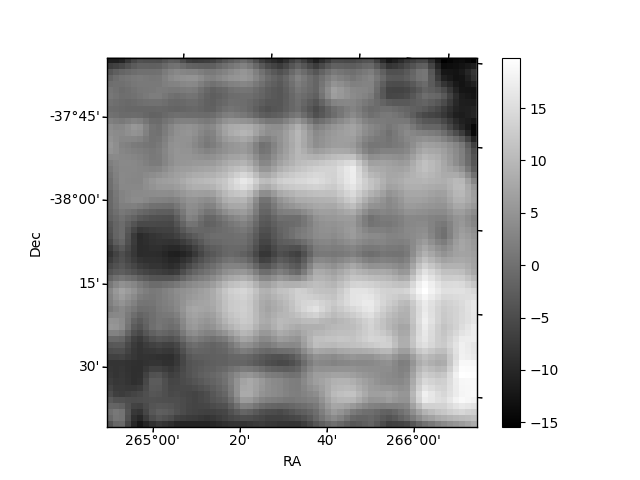
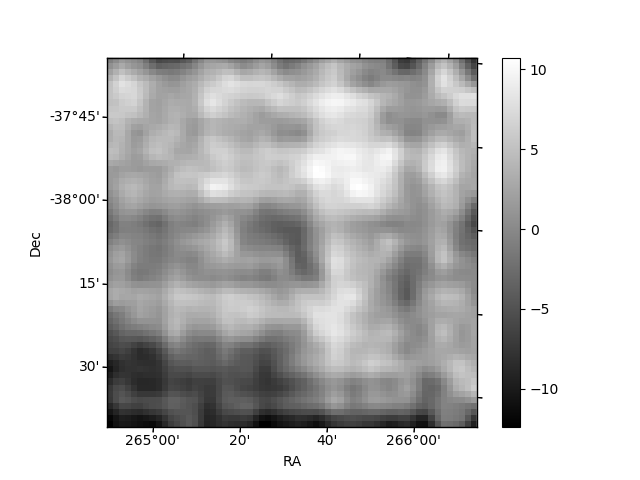
Histogram calculated using DETX and DETY for each event in the final _common_clean file
| Quadrant A | 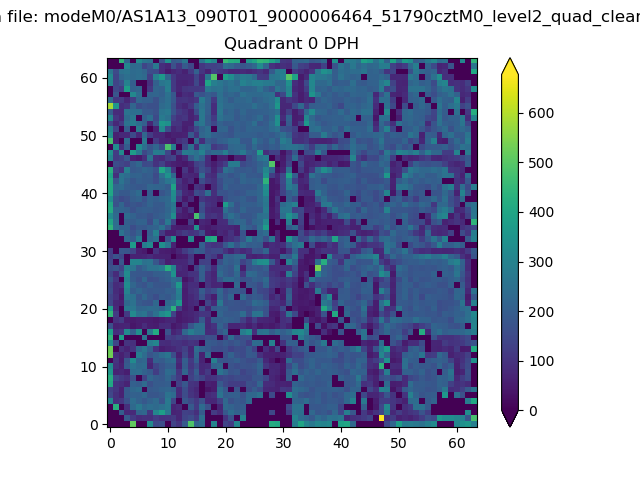 |
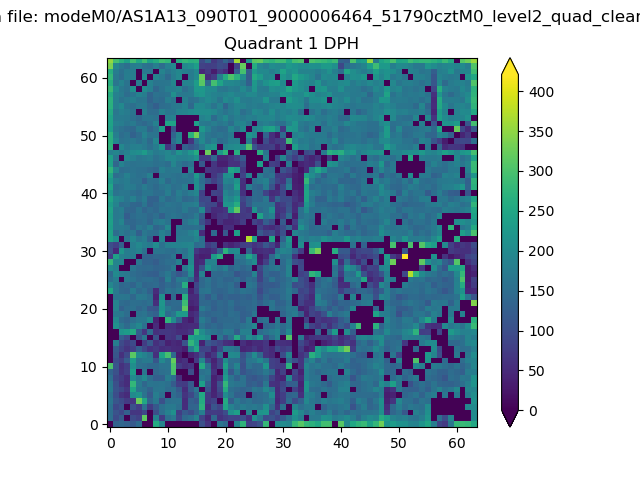 |
Quadrant B |
|---|---|---|---|
| Quadrant D | 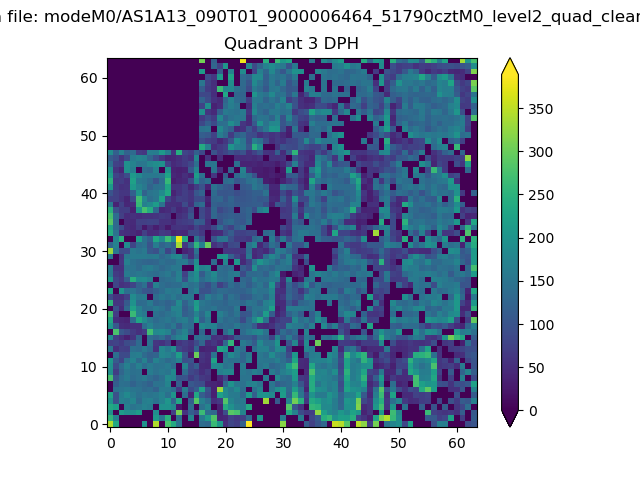 |
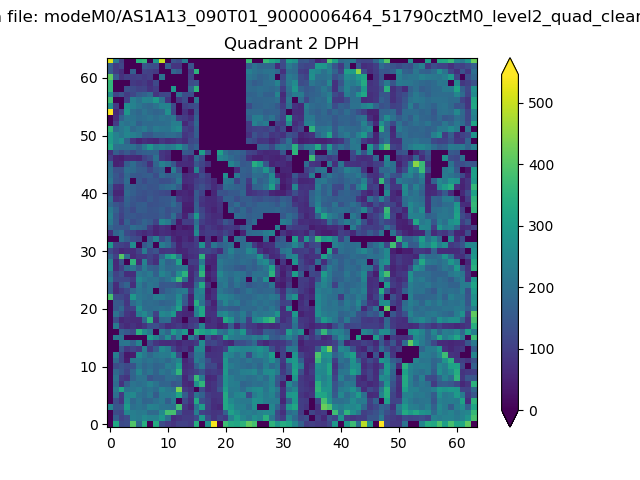 |
Quadrant C |
| Plot type | Count rate plots | Images |
|---|---|---|
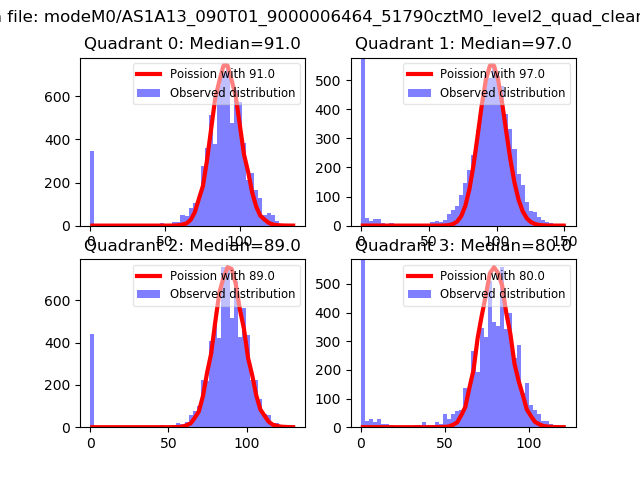
| Comparison with Poisson distribution Blue bars denote a histogram of data divided into 1 sec bins. Red curve is a Poisson curve with rate = median count rate of data. |
 |
 |
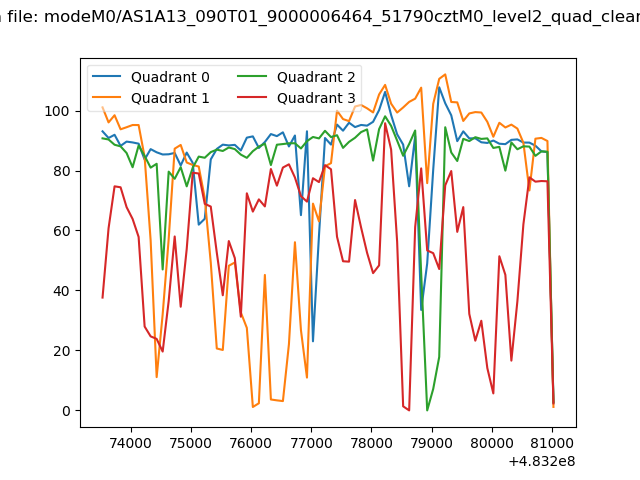
| Quadrant-wise count rates Data is divided into 100 sec bins |
 |
|
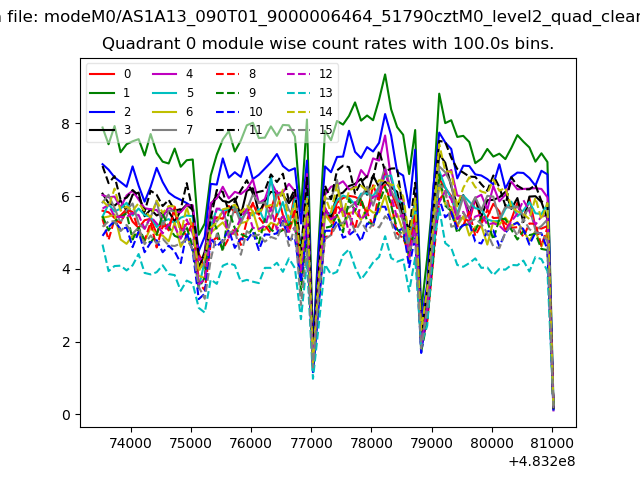
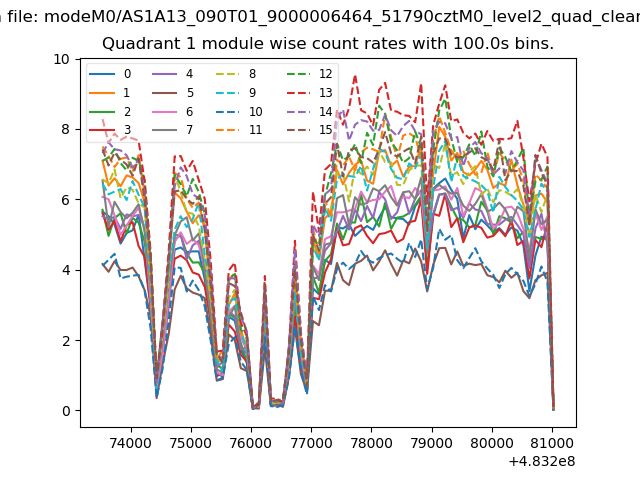
| Module-wise count rates for Quadrant A Data is divided into 100 sec bins |
 |
 |
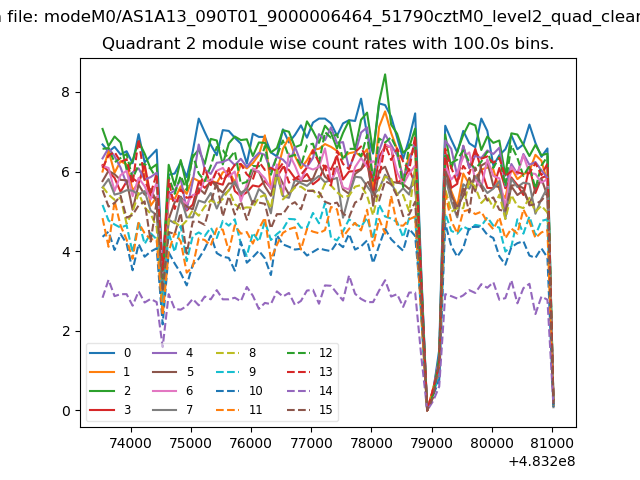
| Module-wise count rates for Quadrant B Data is divided into 100 sec bins |
 |
 |
| Module-wise count rates for Quadrant C Data is divided into 100 sec bins |
 |
 |
| Module-wise count rates for Quadrant D Data is divided into 100 sec bins |
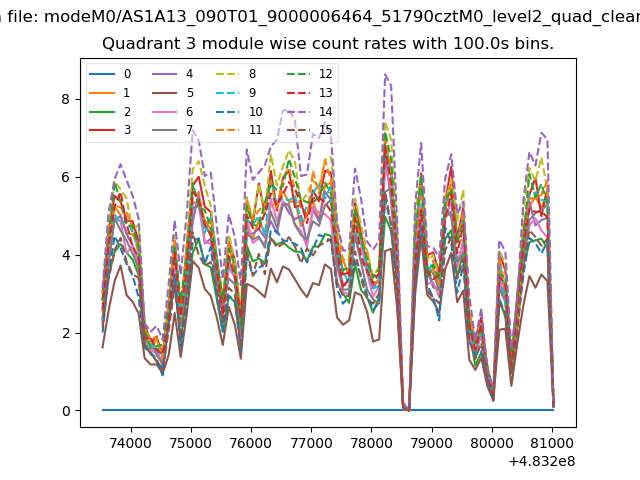 |
 |
| Parameter | Plot |
|---|---|
| CZT HV Monitor | 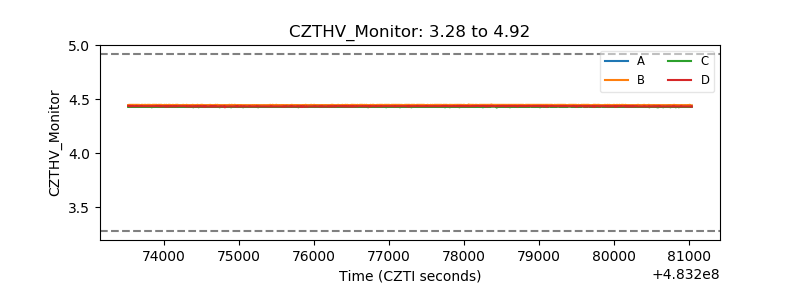 |
| D_VDD | 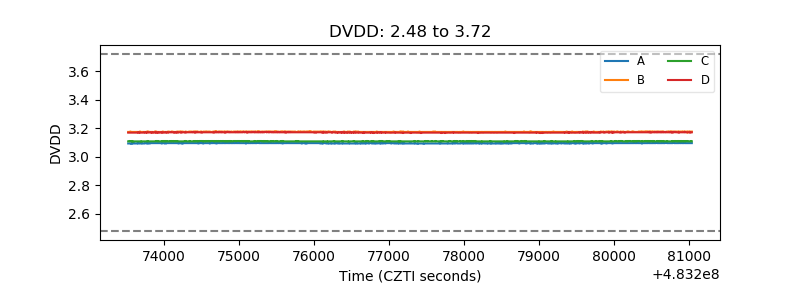 |
| Temperature 1 | 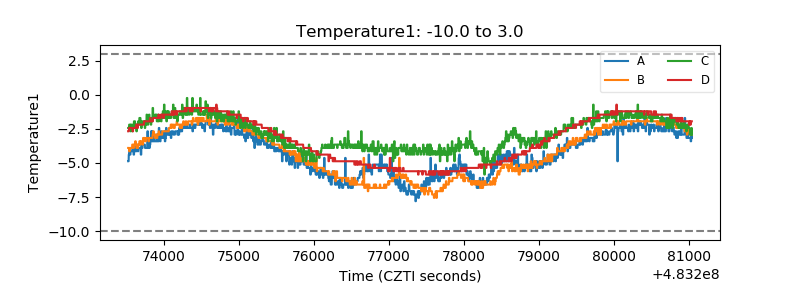 |
| Veto HV Monitor | 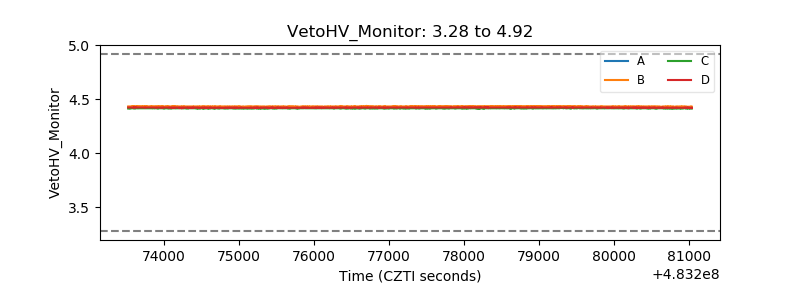 |
| Veto LLD | 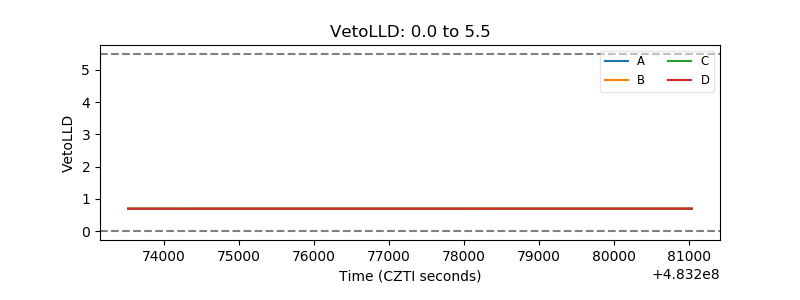 |
| Alpha Counter | 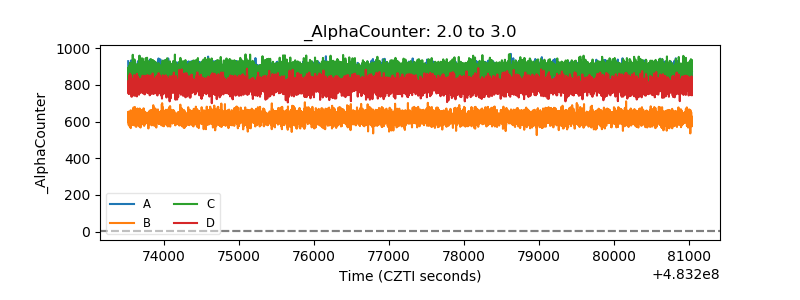 |
| _CPM_Rate | 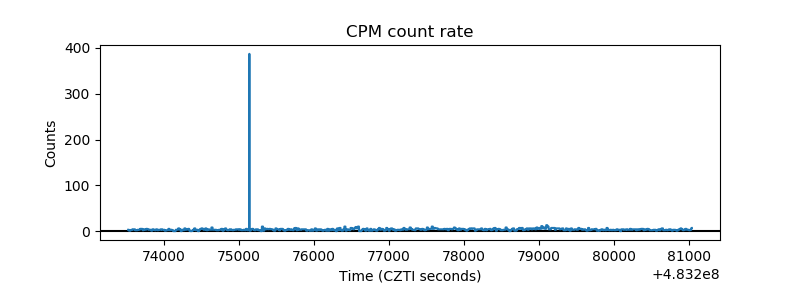 |
| CZT Counter | 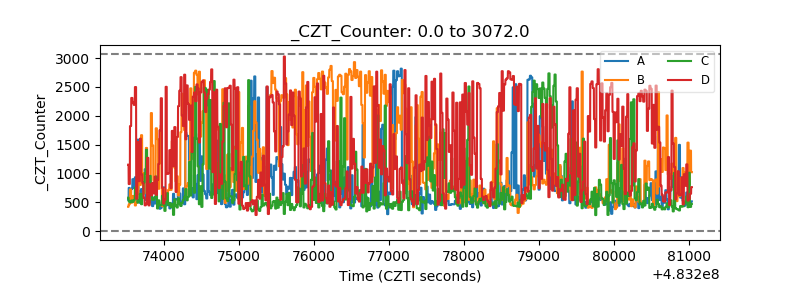 |
| +2.5 Volts monitor | 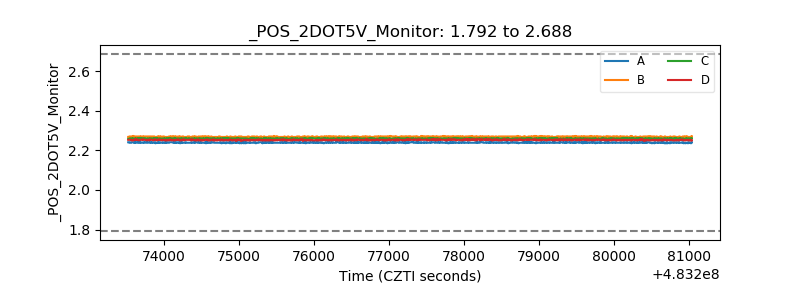 |
| +5 Volts monitor | 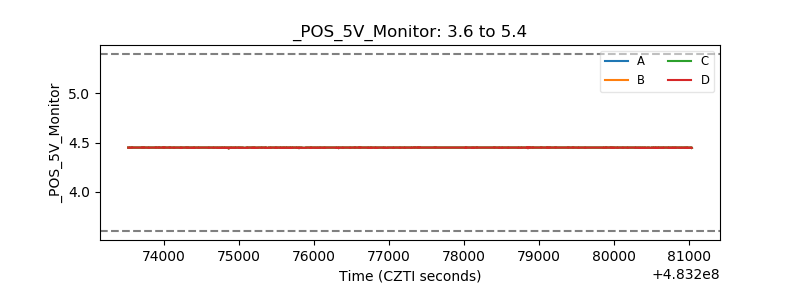 |
| _ROLL_ROT | 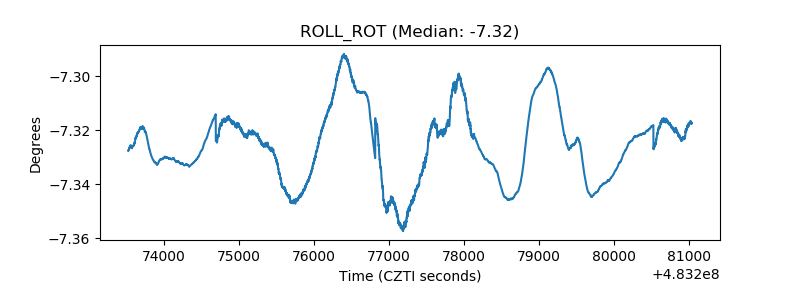 |
| _Roll_DEC | 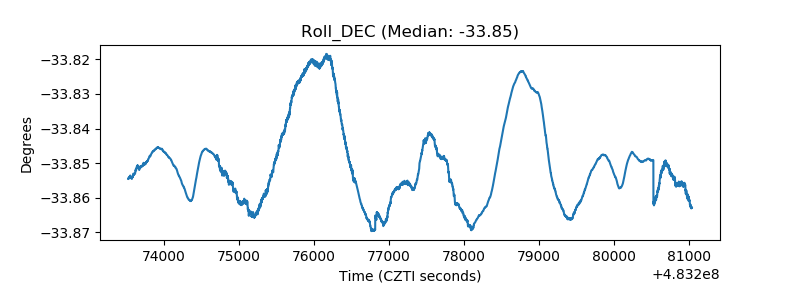 |
| _Roll_RA | 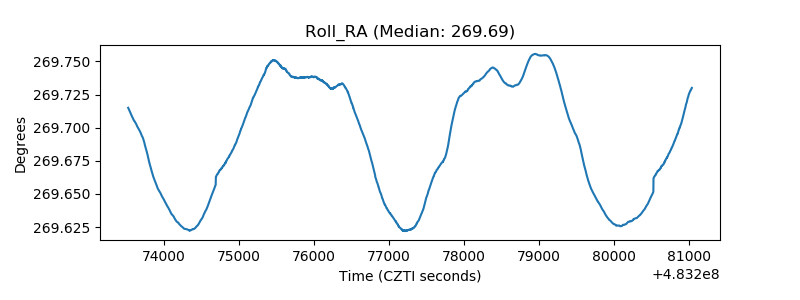 |
| Veto Counter | 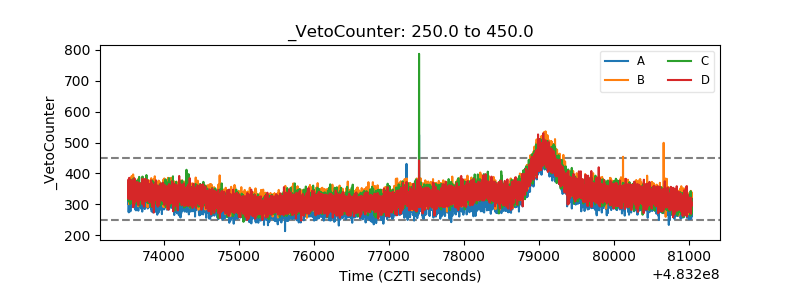 |