| Param | Original file | Final file |
|---|---|---|
| Filename | modeM0/AS1A13_090T01_9000006464_51791cztM0_level2.fits | modeM0/AS1A13_090T01_9000006464_51791cztM0_level2_quad_clean.evt |
| Size (bytes) | 948,237,120 | 105,554,880 |
| Size | 904.3 MB | 100.7 MB |
| Events in quadrant A | 6,748,331 | 728,853 |
| Events in quadrant B | 9,367,705 | 715,897 |
| Events in quadrant C | 6,870,095 | 689,763 |
| Events in quadrant D | 11,478,265 | 488,376 |
| Mode SS | |||
|---|---|---|---|
| Quadrant | BADHDUFLAG | Total packets | Discarded packets |
| A | 0 | 166 | 0 |
| B | 0 | 166 | 0 |
| C | 0 | 166 | 0 |
| D | 0 | 166 | 0 |
| Mode M0 | |||
|---|---|---|---|
| Quadrant | BADHDUFLAG | Total packets | Discarded packets |
| A | 0 | 25621 | 0 |
| B | 0 | 33606 | 0 |
| C | 0 | 26048 | 1 |
| D | 0 | 39842 | 0 |
| Quadrant | Total seconds | Saturated seconds | Saturation percentage |
|---|---|---|---|
| A | 8237 | 527 | 6.397960% |
| B | 8238 | 1476 | 17.916970% |
| C | 8237 | 737 | 8.947432% |
| D | 8237 | 2827 | 34.320748% |
Noise dominated data is calculated using 1-second bins in cleaned event files. If a bin has >2000 counts, and if more than 50% of those come from <1% of pixels, then it is considered to be noise-dominated and hence unusable.
| Quadrant | # 1 sec bins | Bins with >0 counts | Bins with >2000 counts | High rate bins dominated by noise | Noise dominated (total time) | Noise dominated (detector-on time) | Marked lightcurve |
|---|---|---|---|---|---|---|---|
| A | 8237 | 8237 | 344 | 344 | 4.18% | 4.18% | 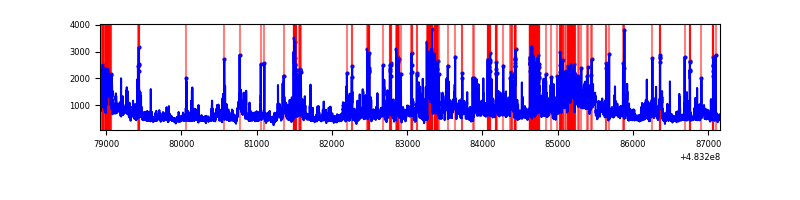 |
| B | 8238 | 8238 | 1073 | 1073 | 13.03% | 13.03% | 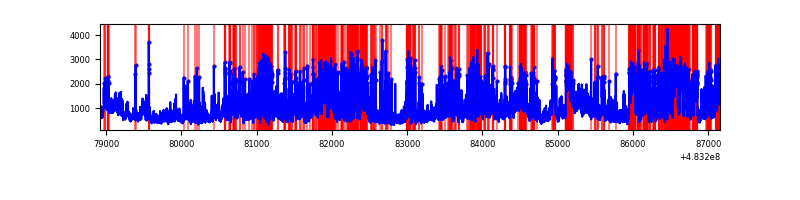 |
| C | 8237 | 8237 | 597 | 597 | 7.25% | 7.25% | 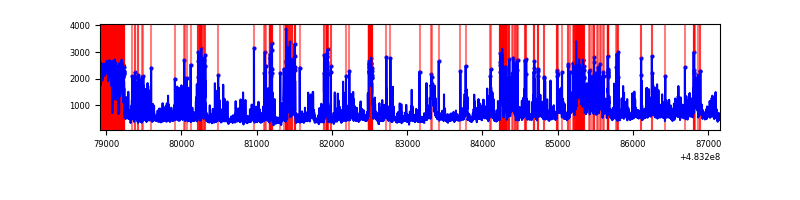 |
| D | 8237 | 8237 | 2472 | 2472 | 30.01% | 30.01% | 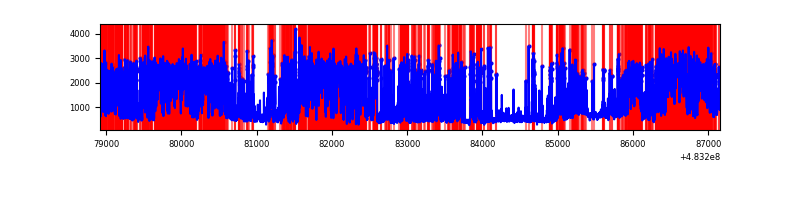 |
Top three noisy pixels from each quadrant. If the there are fewer than three noisy pixels in the level2.evt file, extra rows are filled as -1
| Pixel properties | Quadrant properties | ||||||
|---|---|---|---|---|---|---|---|
| Quadrant | DetID | PixID | Counts | Sigma | Mean | Median | Sigma |
| A | 15 | 174 | 996994 | 4522.28 | 896 | 872 | 220.3 |
| A | 12 | 3 | 865318 | 3924.48 | 896 | 872 | 220.3 |
| A | 11 | 3 | 236453 | 1069.51 | 896 | 872 | 220.3 |
| B | 10 | 128 | 3715037 | 20107.75 | 854 | 823 | 184.7 |
| B | 10 | 44 | 551339 | 2980.34 | 854 | 823 | 184.7 |
| B | 5 | 185 | 277857 | 1499.79 | 854 | 823 | 184.7 |
| C | 3 | 233 | 646965 | 2831.15 | 838 | 830 | 228.2 |
| C | 15 | 192 | 389109 | 1701.31 | 838 | 830 | 228.2 |
| C | 0 | 209 | 382167 | 1670.89 | 838 | 830 | 228.2 |
| D | 11 | 129 | 6797863 | 32861.17 | 746 | 719 | 206.8 |
| D | 3 | 12 | 472907 | 2282.82 | 746 | 719 | 206.8 |
| D | 7 | 60 | 324863 | 1567.09 | 746 | 719 | 206.8 |
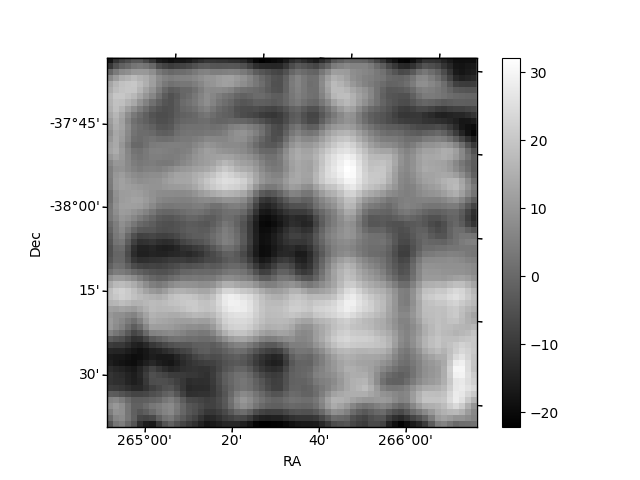
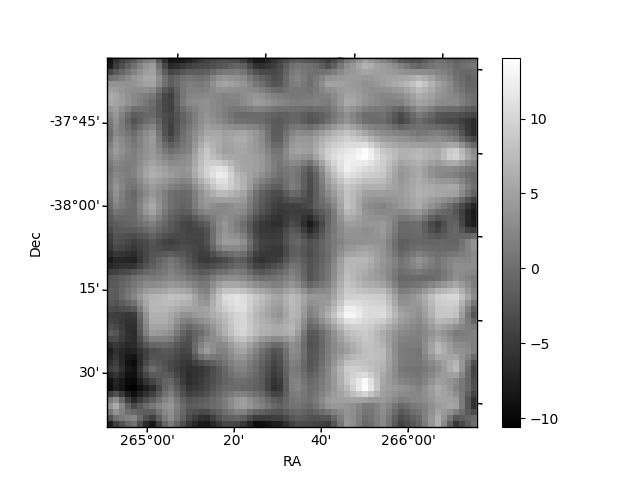
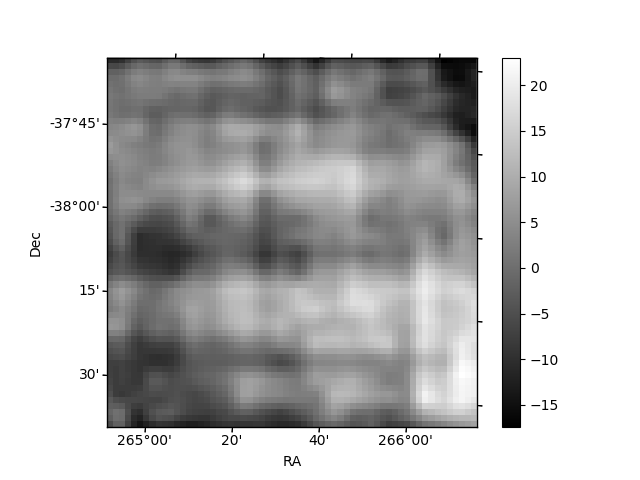
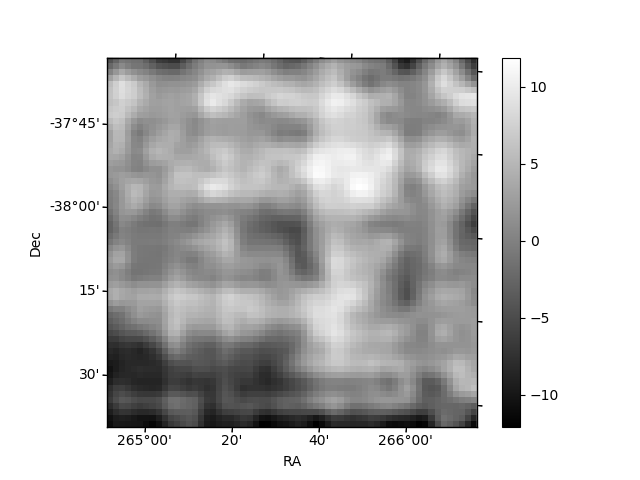
Histogram calculated using DETX and DETY for each event in the final _common_clean file
| Quadrant A | 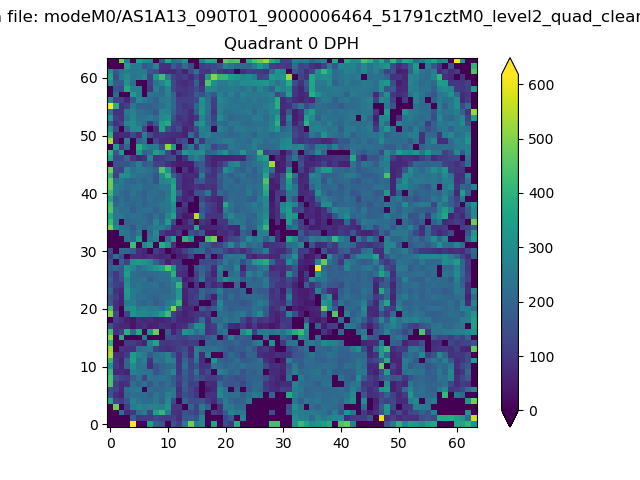 |
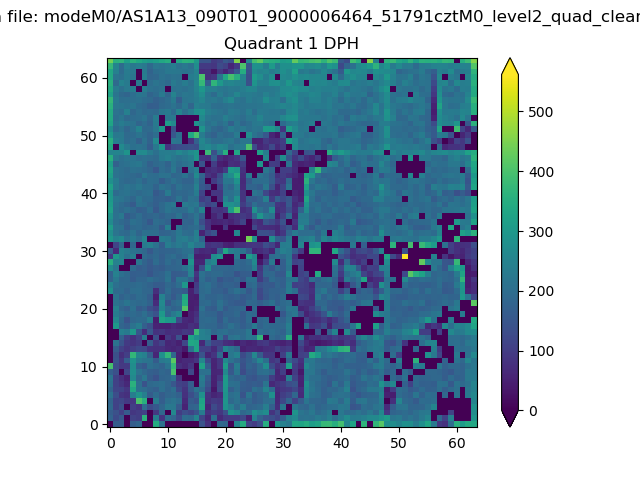 |
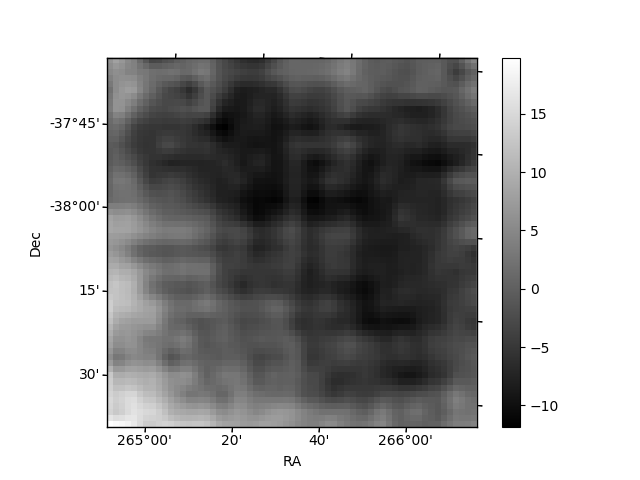
Quadrant B |
|---|---|---|---|
| Quadrant D | 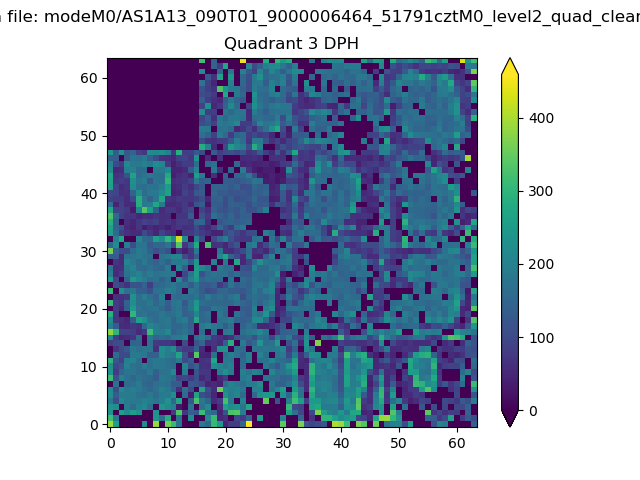 |
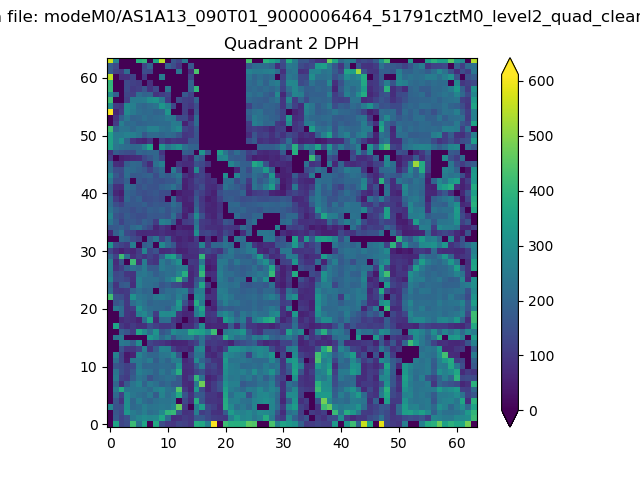 |
Quadrant C |
| Plot type | Count rate plots | Images |
|---|---|---|
| Comparison with Poisson distribution Blue bars denote a histogram of data divided into 1 sec bins. Red curve is a Poisson curve with rate = median count rate of data. |
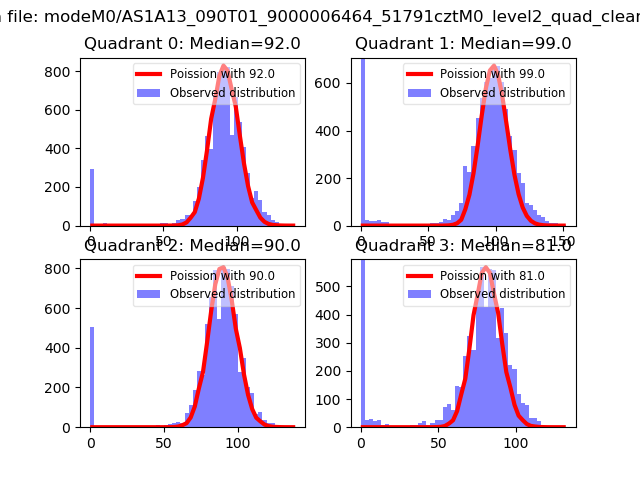 |
 |
| Quadrant-wise count rates Data is divided into 100 sec bins |
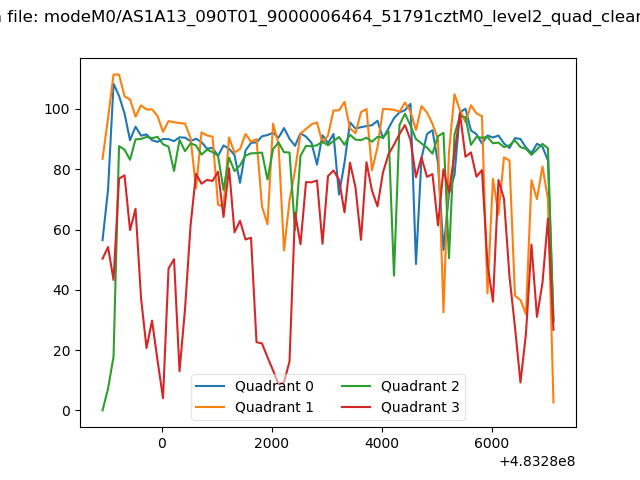 |
|
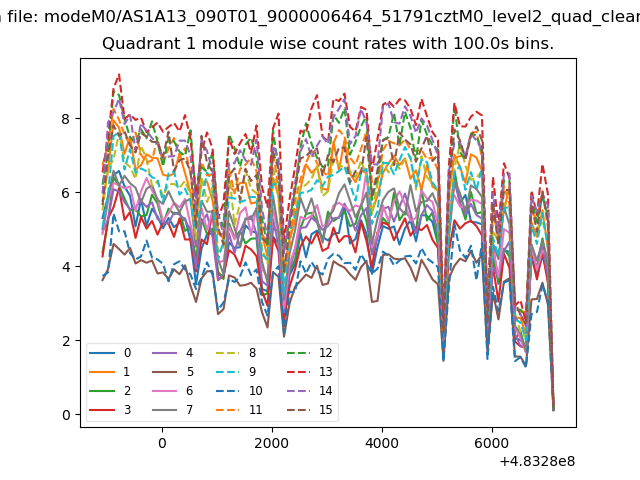
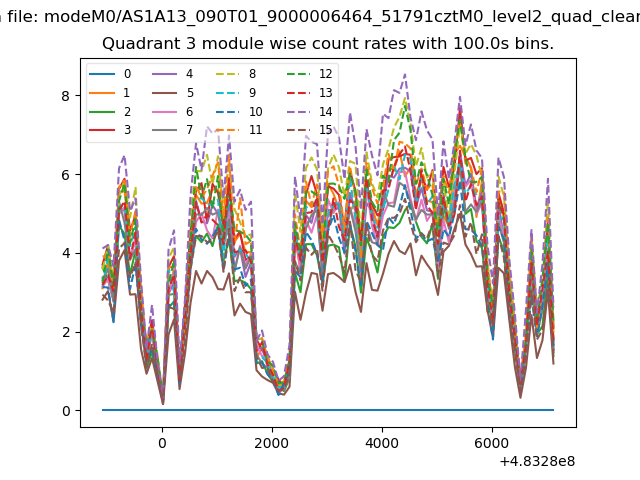
| Module-wise count rates for Quadrant A Data is divided into 100 sec bins |
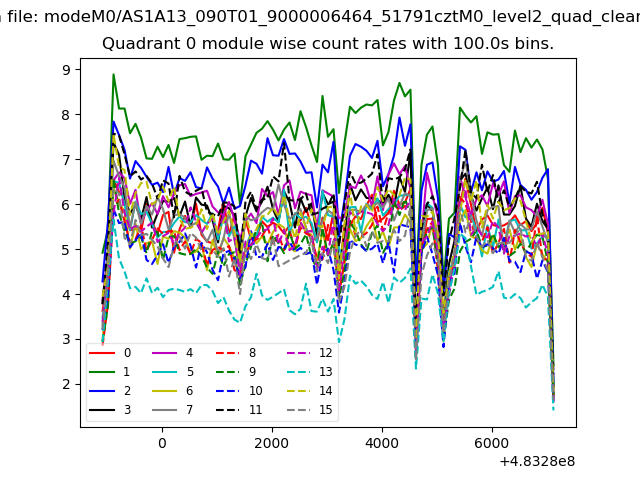 |
 |
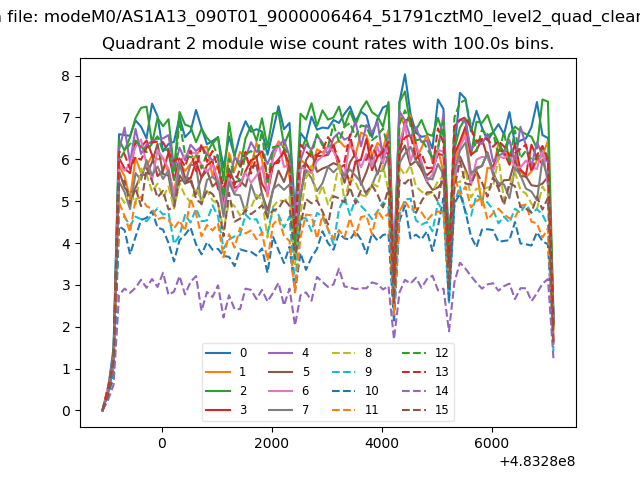
| Module-wise count rates for Quadrant B Data is divided into 100 sec bins |
 |
 |
| Module-wise count rates for Quadrant C Data is divided into 100 sec bins |
 |
 |
| Module-wise count rates for Quadrant D Data is divided into 100 sec bins |
 |
 |
| Parameter | Plot |
|---|---|
| CZT HV Monitor | 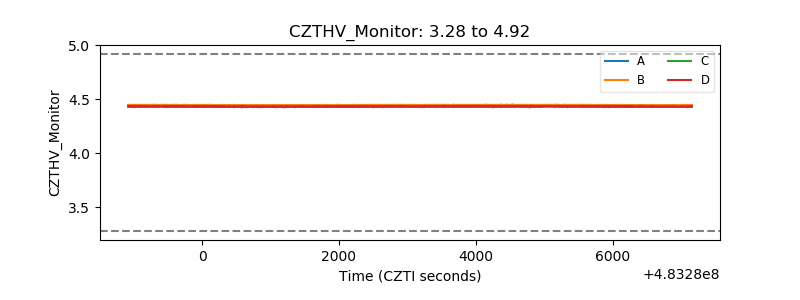 |
| D_VDD | 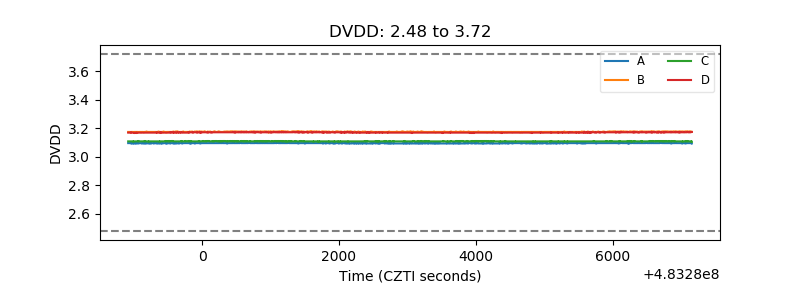 |
| Temperature 1 | 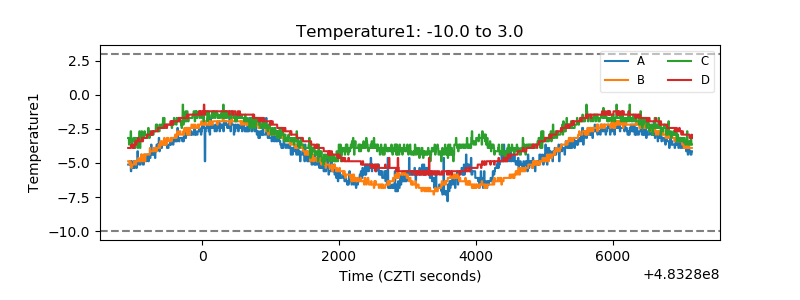 |
| Veto HV Monitor |  |
| Veto LLD | 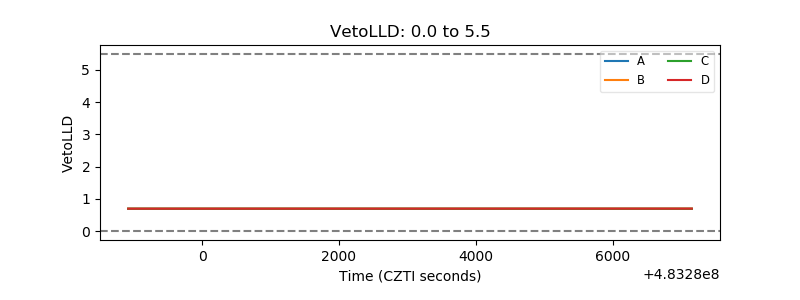 |
| Alpha Counter | 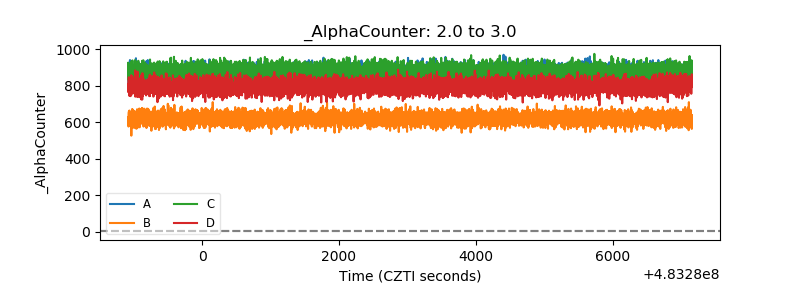 |
| _CPM_Rate | 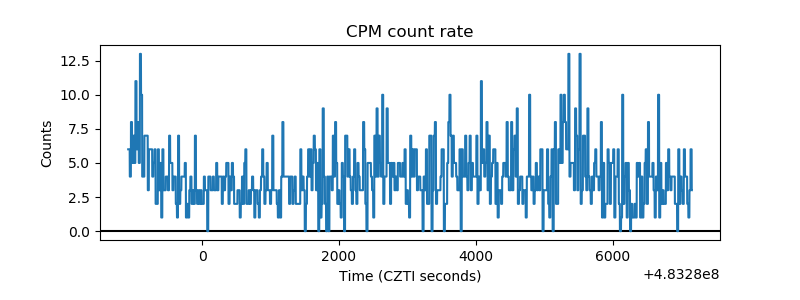 |
| CZT Counter | 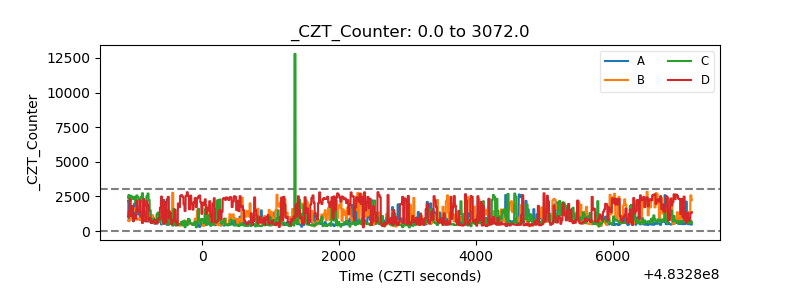 |
| +2.5 Volts monitor | 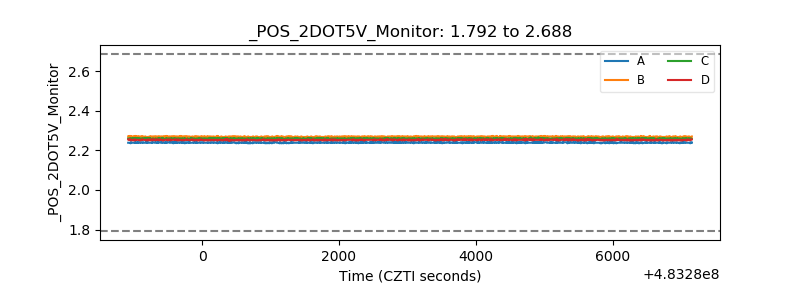 |
| +5 Volts monitor | 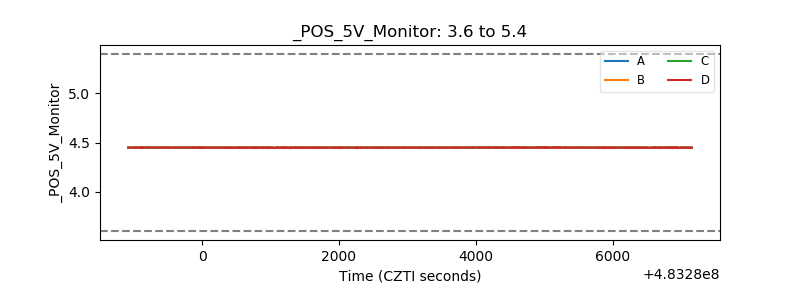 |
| _ROLL_ROT | 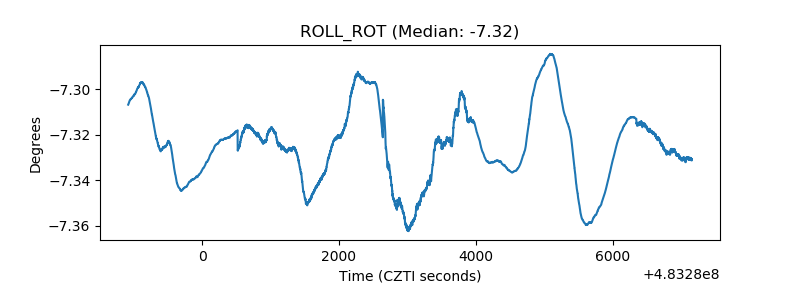 |
| _Roll_DEC | 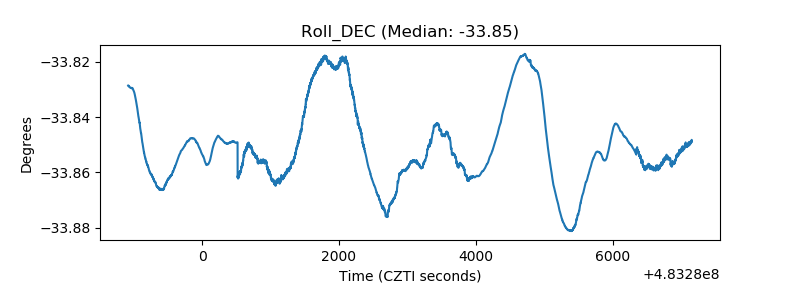 |
| _Roll_RA | 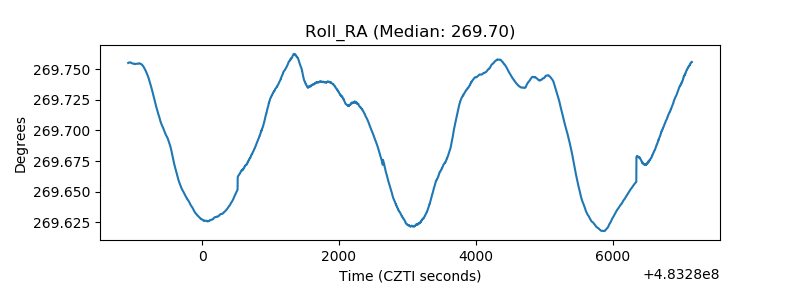 |
| Veto Counter | 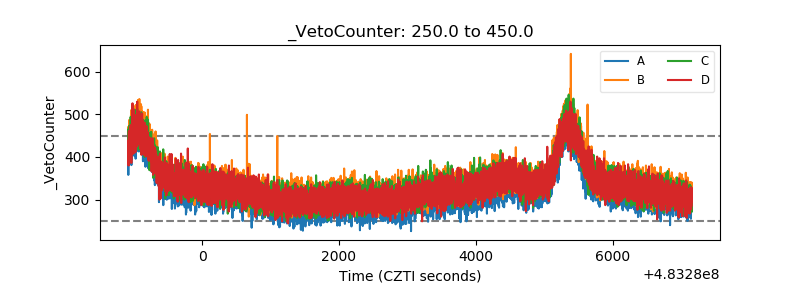 |