| Param | Original file | Final file |
|---|---|---|
| Filename | modeM0/AS1A13_090T01_9000006464_51794cztM0_level2.fits | modeM0/AS1A13_090T01_9000006464_51794cztM0_level2_quad_clean.evt |
| Size (bytes) | 2,256,759,360 | 242,726,400 |
| Size | 2.1 GB | 231.5 MB |
| Events in quadrant A | 19,547,819 | 1,565,865 |
| Events in quadrant B | 23,525,776 | 1,467,084 |
| Events in quadrant C | 14,424,814 | 1,667,135 |
| Events in quadrant D | 24,529,205 | 1,295,792 |
| Mode M9 | |||
|---|---|---|---|
| Quadrant | BADHDUFLAG | Total packets | Discarded packets |
| A | 0 | 11 | 0 |
| B | 0 | 11 | 0 |
| C | 0 | 11 | 0 |
| D | 0 | 11 | 0 |
| Mode SS | |||
|---|---|---|---|
| Quadrant | BADHDUFLAG | Total packets | Discarded packets |
| A | 0 | 396 | 0 |
| B | 0 | 396 | 0 |
| C | 0 | 396 | 0 |
| D | 0 | 396 | 0 |
| Mode M0 | |||
|---|---|---|---|
| Quadrant | BADHDUFLAG | Total packets | Discarded packets |
| A | 0 | 71669 | 4 |
| B | 0 | 83466 | 4 |
| C | 0 | 56143 | 4 |
| D | 0 | 86575 | 5 |
| Quadrant | Total seconds | Saturated seconds | Saturation percentage |
|---|---|---|---|
| A | 19623 | 2741 | 13.968303% |
| B | 19623 | 5158 | 26.285481% |
| C | 19623 | 1050 | 5.350864% |
| D | 19622 | 4575 | 23.315666% |
Noise dominated data is calculated using 1-second bins in cleaned event files. If a bin has >2000 counts, and if more than 50% of those come from <1% of pixels, then it is considered to be noise-dominated and hence unusable.
| Quadrant | # 1 sec bins | Bins with >0 counts | Bins with >2000 counts | High rate bins dominated by noise | Noise dominated (total time) | Noise dominated (detector-on time) | Marked lightcurve |
|---|---|---|---|---|---|---|---|
| A | 20717 | 19623 | 1997 | 1997 | 9.64% | 10.18% | 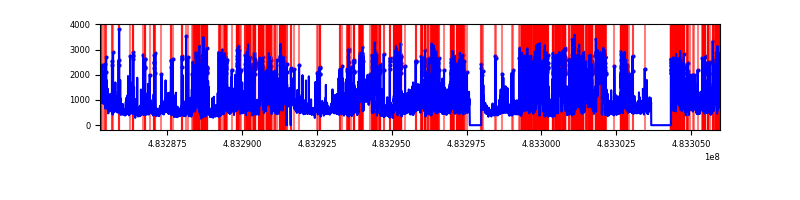 |
| B | 20718 | 19623 | 4030 | 4030 | 19.45% | 20.54% | 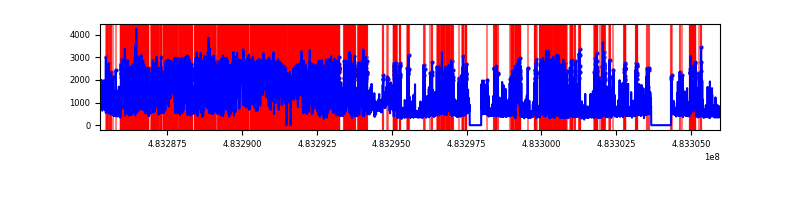 |
| C | 20718 | 19626 | 733 | 733 | 3.54% | 3.73% | 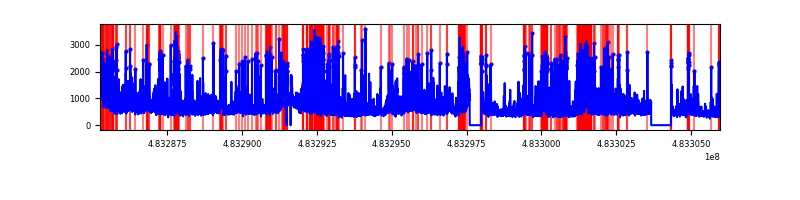 |
| D | 20717 | 19626 | 4291 | 4291 | 20.71% | 21.86% | 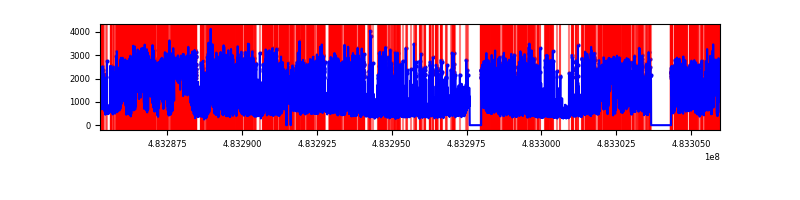 |
Top three noisy pixels from each quadrant. If the there are fewer than three noisy pixels in the level2.evt file, extra rows are filled as -1
| Pixel properties | Quadrant properties | ||||||
|---|---|---|---|---|---|---|---|
| Quadrant | DetID | PixID | Counts | Sigma | Mean | Median | Sigma |
| A | 15 | 174 | 6170681 | 12391.32 | 2029 | 1976 | 497.8 |
| A | 12 | 3 | 1369688 | 2747.38 | 2029 | 1976 | 497.8 |
| A | 4 | 175 | 604766 | 1210.85 | 2029 | 1976 | 497.8 |
| B | 10 | 128 | 9904273 | 24247.23 | 1894 | 1824 | 408.4 |
| B | 4 | 81 | 3183722 | 7791.23 | 1894 | 1824 | 408.4 |
| B | 7 | 252 | 679484 | 1659.32 | 1894 | 1824 | 408.4 |
| C | 15 | 218 | 1485976 | 2655.91 | 2052 | 2039 | 558.7 |
| C | 10 | 22 | 783654 | 1398.91 | 2052 | 2039 | 558.7 |
| C | 13 | 3 | 631864 | 1127.24 | 2052 | 2039 | 558.7 |
| D | 11 | 129 | 11810404 | 22480.35 | 1874 | 1808 | 525.3 |
| D | 3 | 12 | 1213535 | 2306.8 | 1874 | 1808 | 525.3 |
| D | 7 | 60 | 896746 | 1703.72 | 1874 | 1808 | 525.3 |
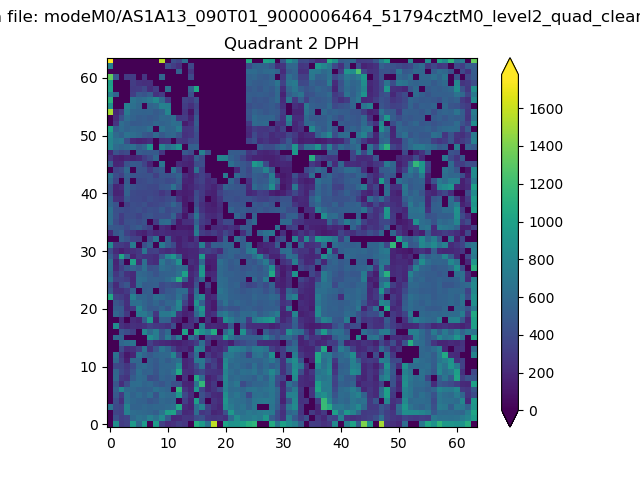
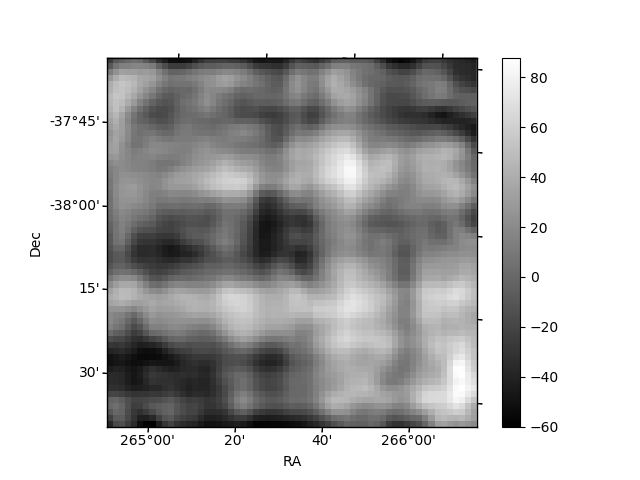
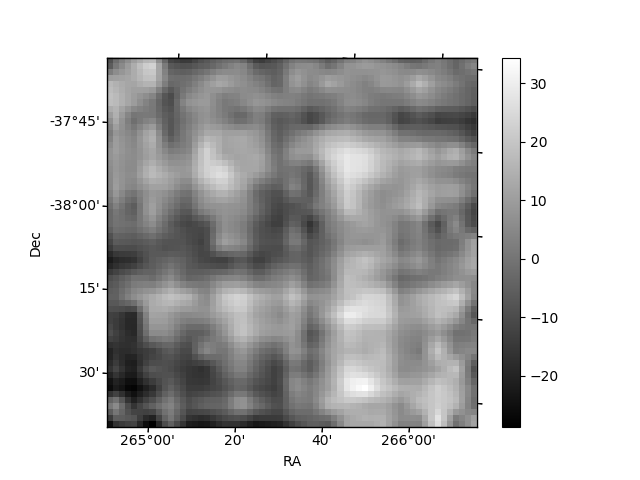
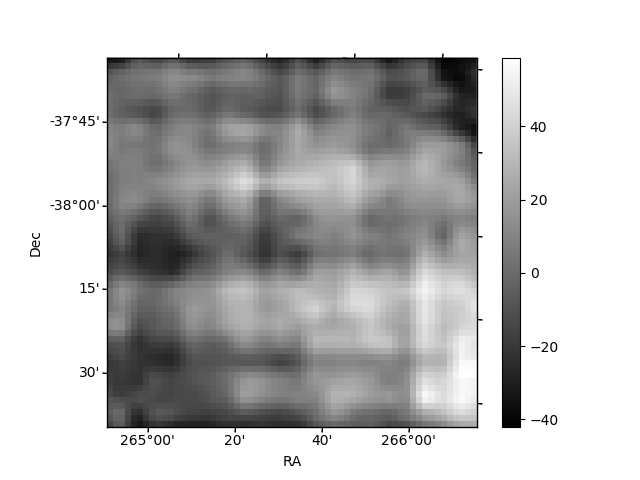
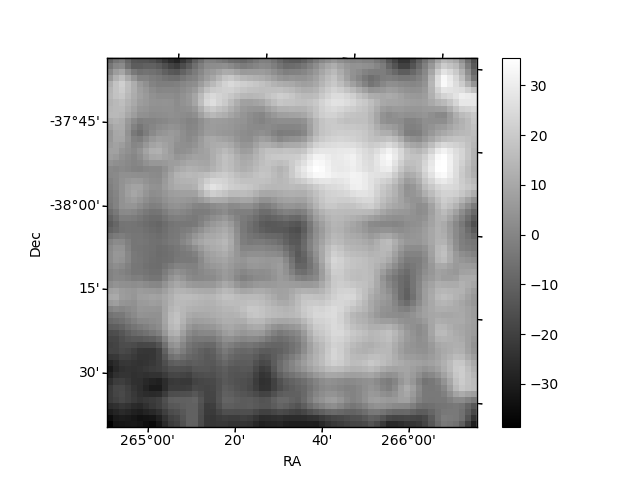
Histogram calculated using DETX and DETY for each event in the final _common_clean file
| Quadrant A | 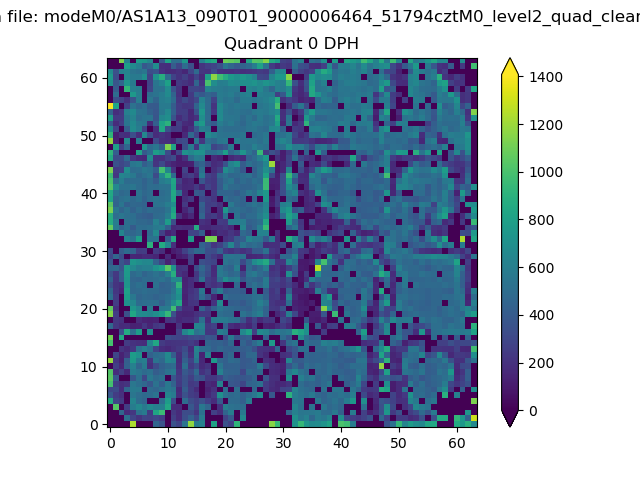 |
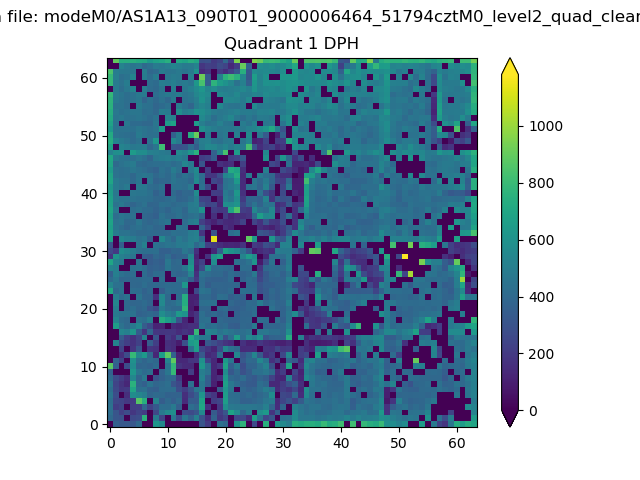 |
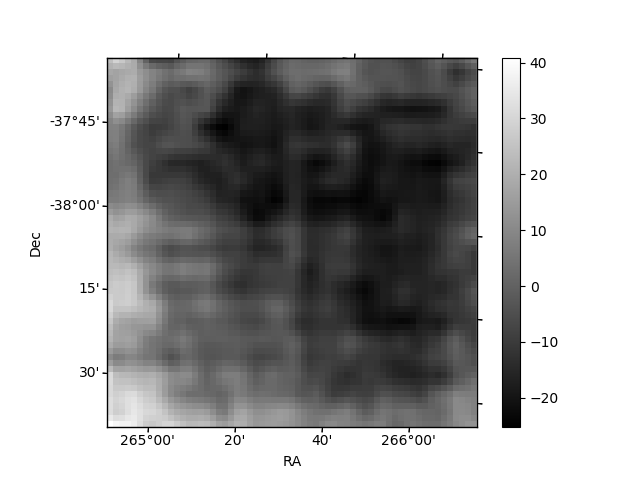
Quadrant B |
|---|---|---|---|
| Quadrant D | 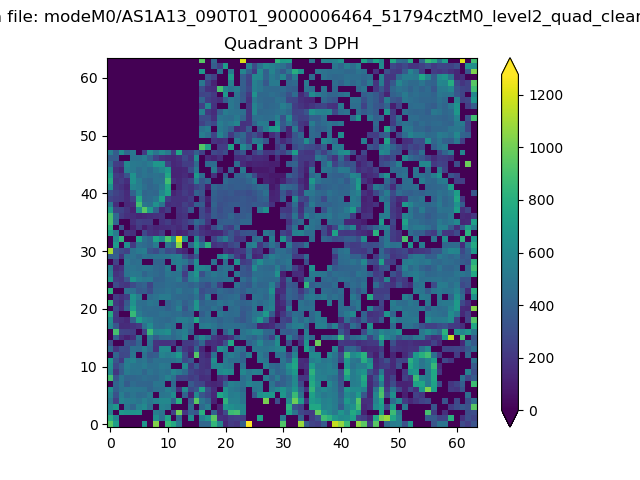 |
 |
Quadrant C |
| Plot type | Count rate plots | Images |
|---|---|---|
| Comparison with Poisson distribution Blue bars denote a histogram of data divided into 1 sec bins. Red curve is a Poisson curve with rate = median count rate of data. |
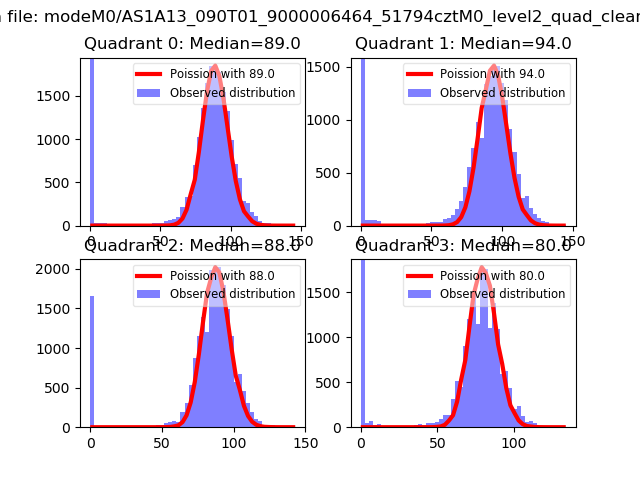 |
 |
| Quadrant-wise count rates Data is divided into 100 sec bins |
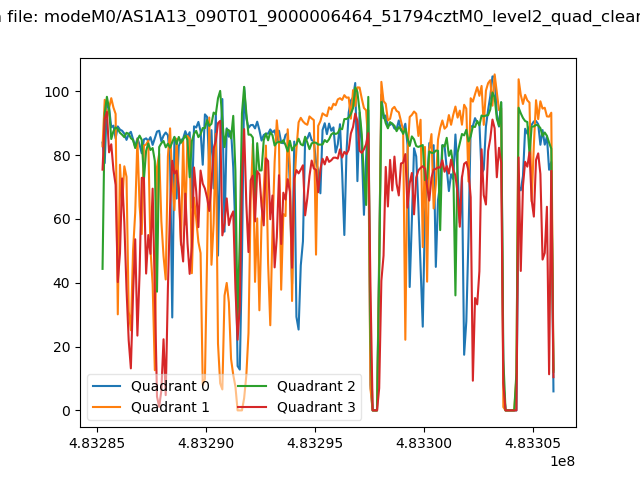 |
|
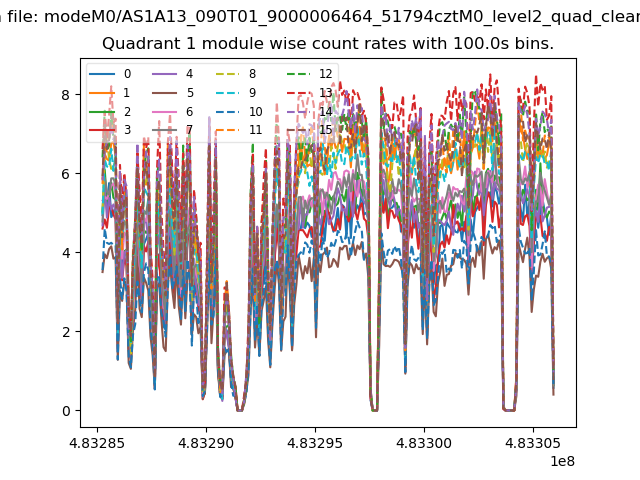
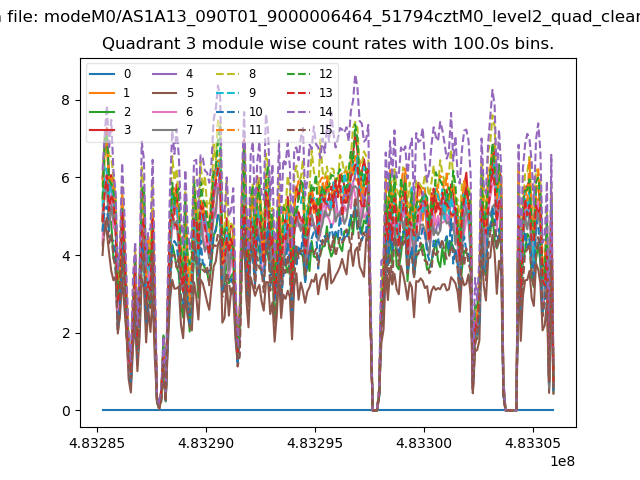
| Module-wise count rates for Quadrant A Data is divided into 100 sec bins |
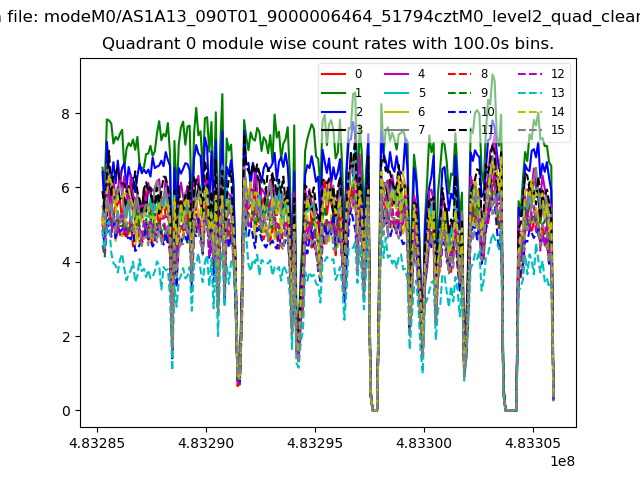 |
 |
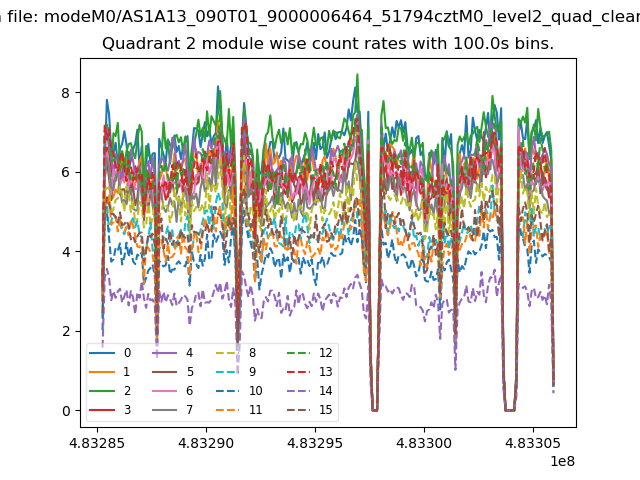
| Module-wise count rates for Quadrant B Data is divided into 100 sec bins |
 |
 |
| Module-wise count rates for Quadrant C Data is divided into 100 sec bins |
 |
 |
| Module-wise count rates for Quadrant D Data is divided into 100 sec bins |
 |
 |
| Parameter | Plot |
|---|---|
| CZT HV Monitor | 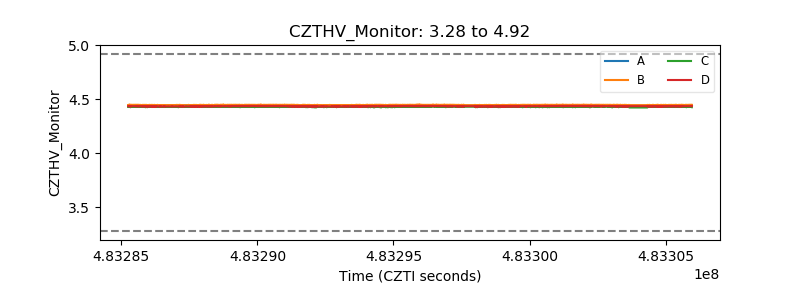 |
| D_VDD | 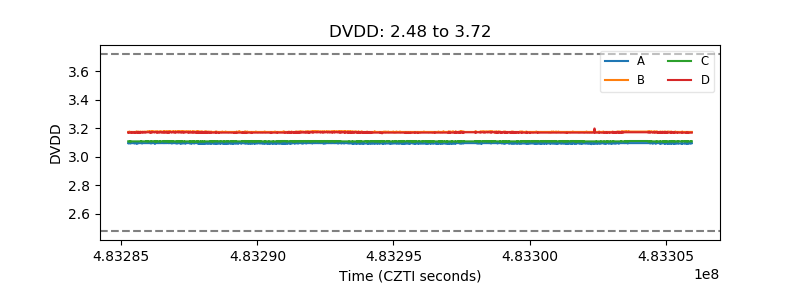 |
| Temperature 1 | 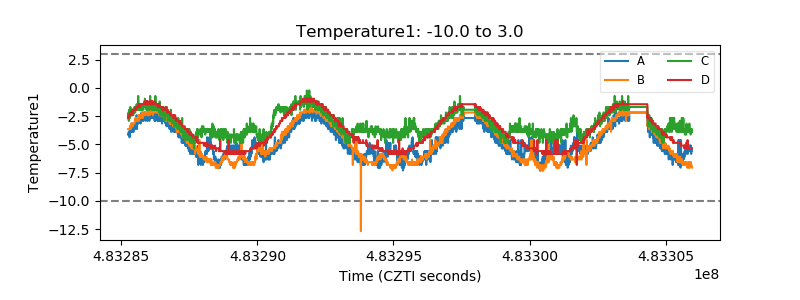 |
| Veto HV Monitor | 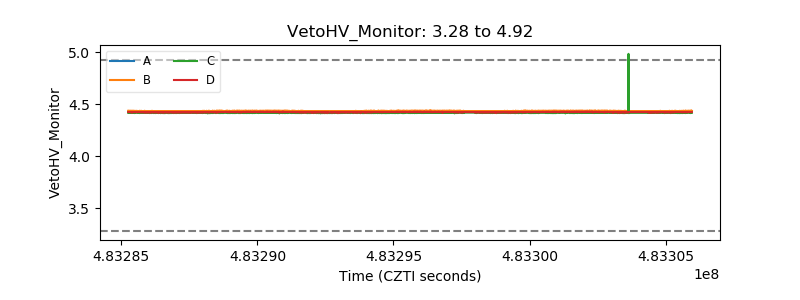 |
| Veto LLD | 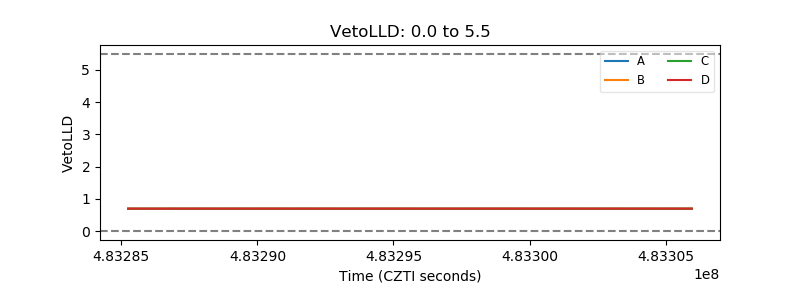 |
| Alpha Counter | 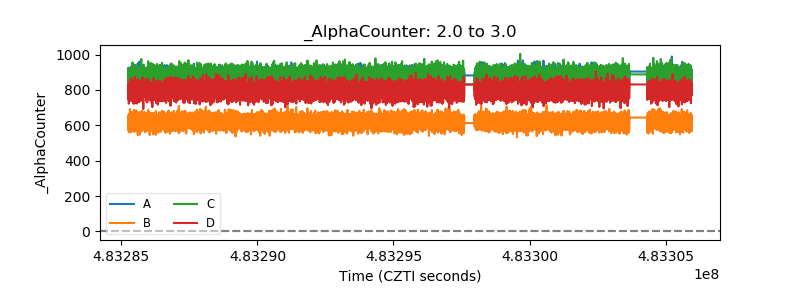 |
| _CPM_Rate | 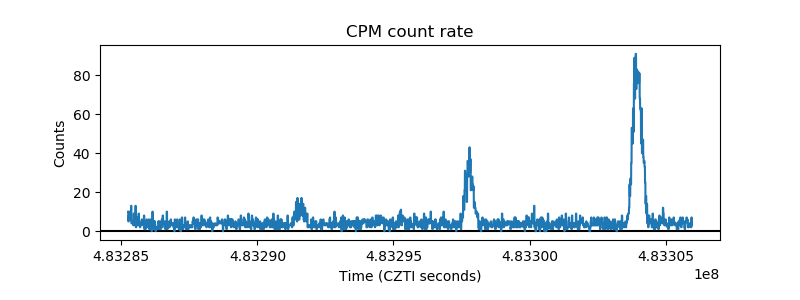 |
| CZT Counter | 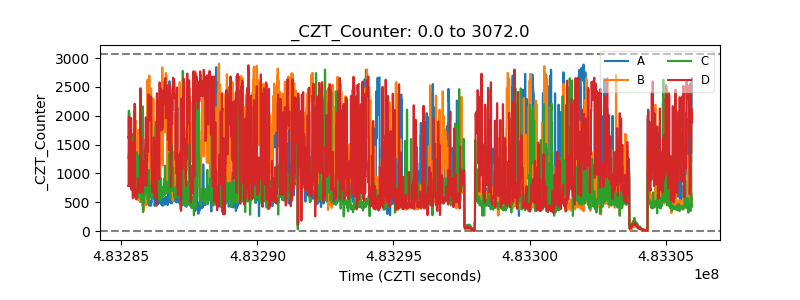 |
| +2.5 Volts monitor | 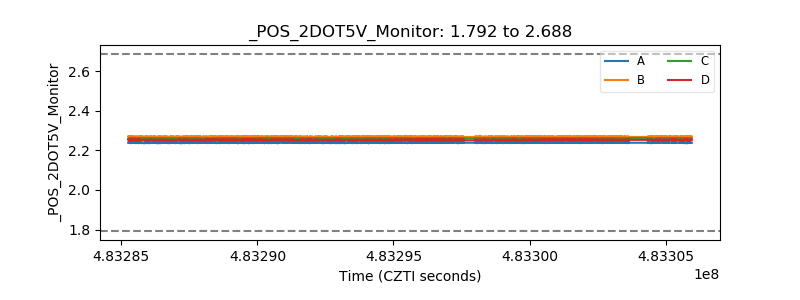 |
| +5 Volts monitor | 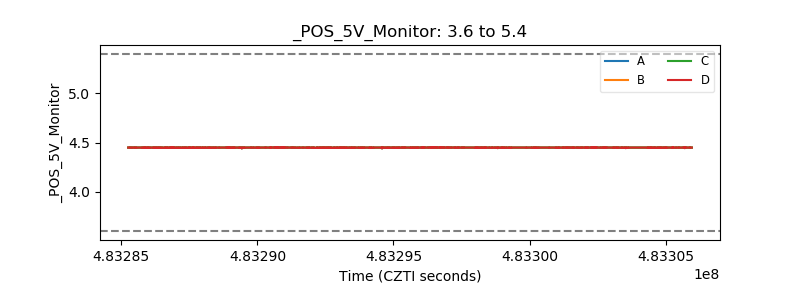 |
| _ROLL_ROT | 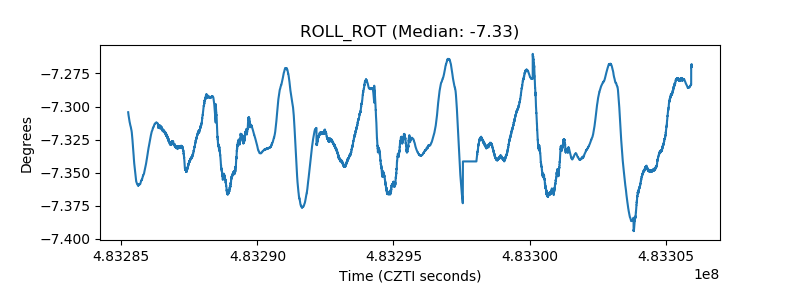 |
| _Roll_DEC | 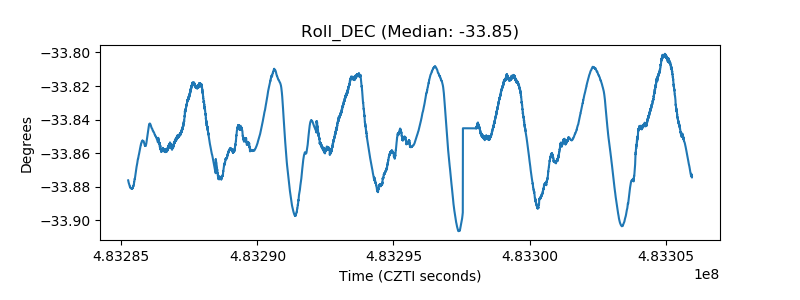 |
| _Roll_RA | 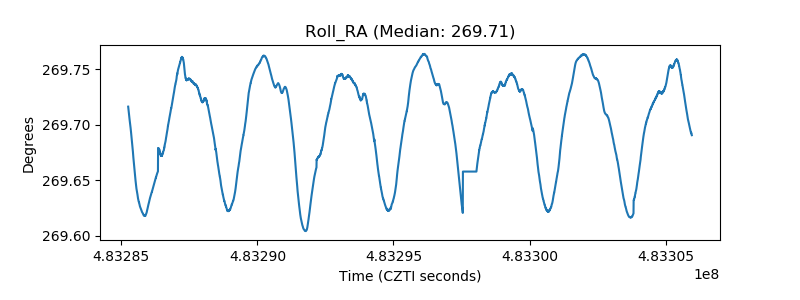 |
| Veto Counter | 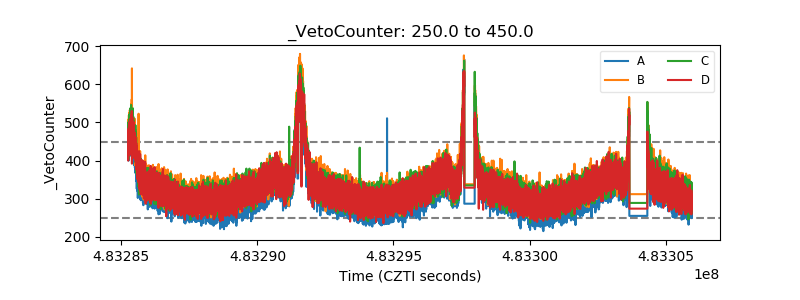 |