| Param | Original file | Final file |
|---|---|---|
| Filename | modeM0/AS1A13_090T01_9000006464_51797cztM0_level2.fits | modeM0/AS1A13_090T01_9000006464_51797cztM0_level2_quad_clean.evt |
| Size (bytes) | 800,352,000 | 82,615,680 |
| Size | 763.3 MB | 78.8 MB |
| Events in quadrant A | 8,381,841 | 470,583 |
| Events in quadrant B | 4,586,528 | 651,383 |
| Events in quadrant C | 6,186,612 | 538,408 |
| Events in quadrant D | 9,960,024 | 379,933 |
| Mode M9 | |||
|---|---|---|---|
| Quadrant | BADHDUFLAG | Total packets | Discarded packets |
| A | 0 | 12 | 0 |
| B | 0 | 13 | 0 |
| C | 0 | 13 | 0 |
| D | 0 | 13 | 0 |
| Mode SS | |||
|---|---|---|---|
| Quadrant | BADHDUFLAG | Total packets | Discarded packets |
| A | 0 | 134 | 0 |
| B | 0 | 134 | 0 |
| C | 0 | 134 | 0 |
| D | 0 | 134 | 0 |
| Mode M0 | |||
|---|---|---|---|
| Quadrant | BADHDUFLAG | Total packets | Discarded packets |
| A | 0 | 29403 | 3 |
| B | 0 | 18214 | 2 |
| C | 0 | 22869 | 2 |
| D | 0 | 34171 | 2 |
| Quadrant | Total seconds | Saturated seconds | Saturation percentage |
|---|---|---|---|
| A | 6610 | 1721 | 26.036309% |
| B | 6610 | 375 | 5.673222% |
| C | 6610 | 855 | 12.934947% |
| D | 6610 | 2433 | 36.807867% |
Noise dominated data is calculated using 1-second bins in cleaned event files. If a bin has >2000 counts, and if more than 50% of those come from <1% of pixels, then it is considered to be noise-dominated and hence unusable.
| Quadrant | # 1 sec bins | Bins with >0 counts | Bins with >2000 counts | High rate bins dominated by noise | Noise dominated (total time) | Noise dominated (detector-on time) | Marked lightcurve |
|---|---|---|---|---|---|---|---|
| A | 7604 | 6610 | 1672 | 1672 | 21.99% | 25.30% | 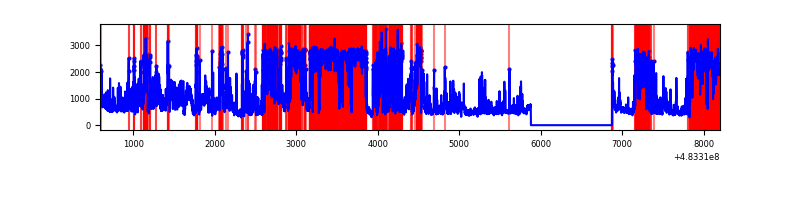 |
| B | 7605 | 6610 | 230 | 230 | 3.02% | 3.48% | 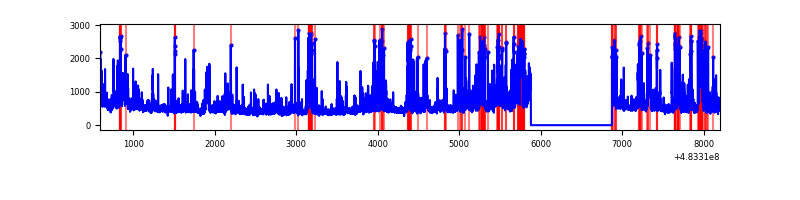 |
| C | 7605 | 6611 | 829 | 829 | 10.90% | 12.54% | 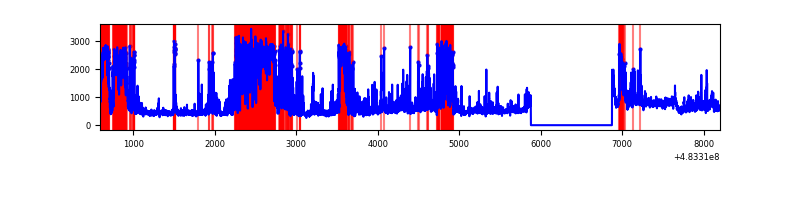 |
| D | 7605 | 6610 | 2358 | 2358 | 31.01% | 35.67% | 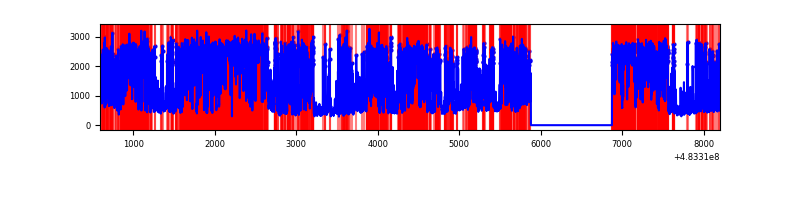 |
Top three noisy pixels from each quadrant. If the there are fewer than three noisy pixels in the level2.evt file, extra rows are filled as -1
| Pixel properties | Quadrant properties | ||||||
|---|---|---|---|---|---|---|---|
| Quadrant | DetID | PixID | Counts | Sigma | Mean | Median | Sigma |
| A | 15 | 174 | 4224702 | 27463.85 | 612 | 596 | 153.8 |
| A | 12 | 3 | 440457 | 2859.84 | 612 | 596 | 153.8 |
| A | 7 | 64 | 293563 | 1904.78 | 612 | 596 | 153.8 |
| B | 10 | 128 | 807711 | 5417.99 | 692 | 670 | 149.0 |
| B | 4 | 81 | 178075 | 1190.99 | 692 | 670 | 149.0 |
| B | 0 | 171 | 169503 | 1133.44 | 692 | 670 | 149.0 |
| C | 15 | 218 | 2383313 | 13187.8 | 654 | 650 | 180.7 |
| C | 10 | 22 | 456523 | 2523.21 | 654 | 650 | 180.7 |
| C | 15 | 192 | 288332 | 1592.29 | 654 | 650 | 180.7 |
| D | 11 | 129 | 6248893 | 40521.93 | 554 | 533 | 154.2 |
| D | 12 | 6 | 428816 | 2777.51 | 554 | 533 | 154.2 |
| D | 8 | 176 | 409632 | 2653.09 | 554 | 533 | 154.2 |
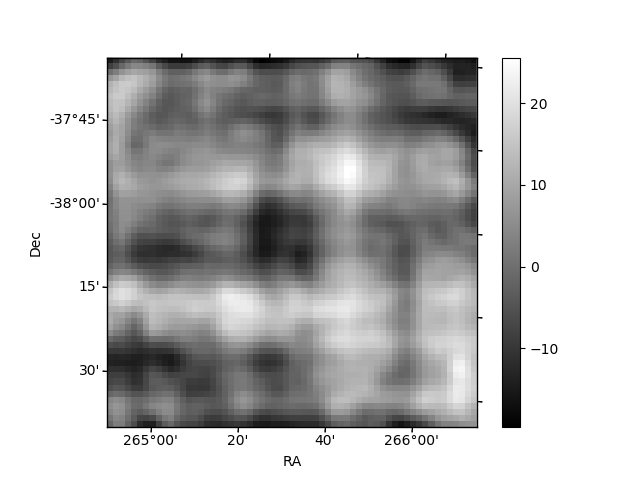
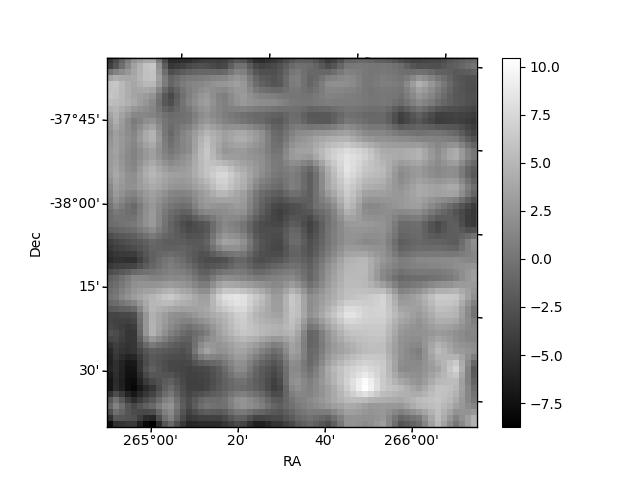
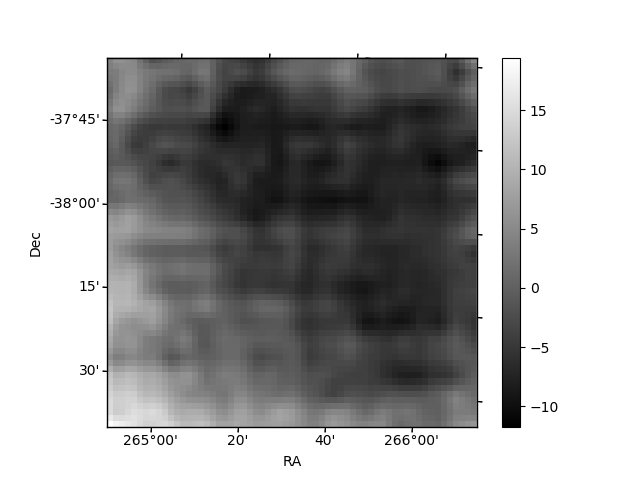
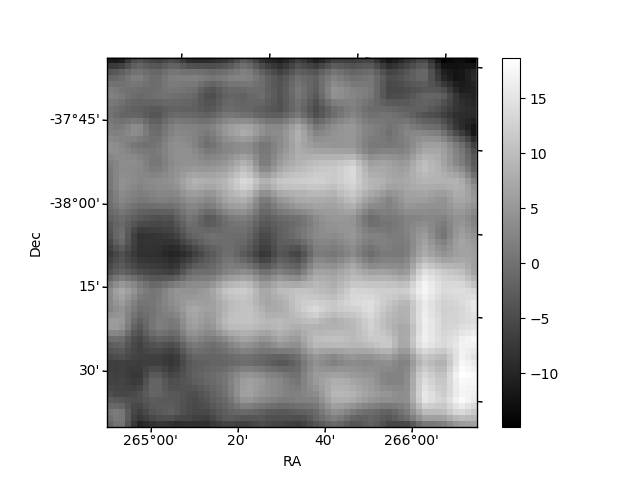
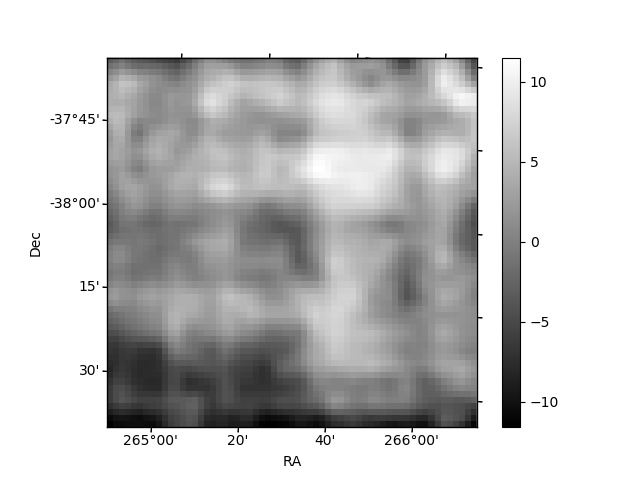
Histogram calculated using DETX and DETY for each event in the final _common_clean file
| Quadrant A | 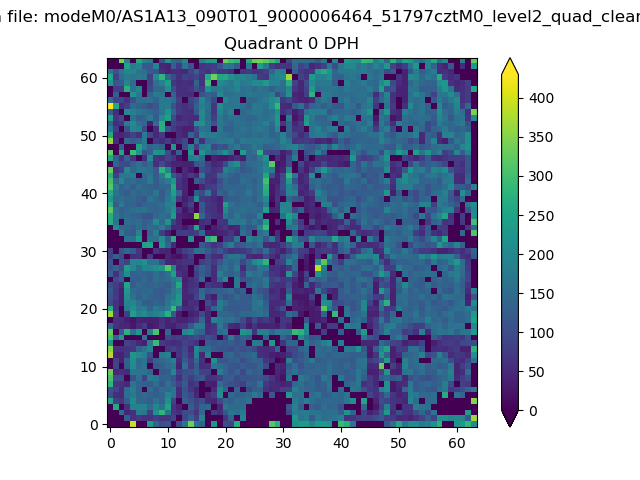 |
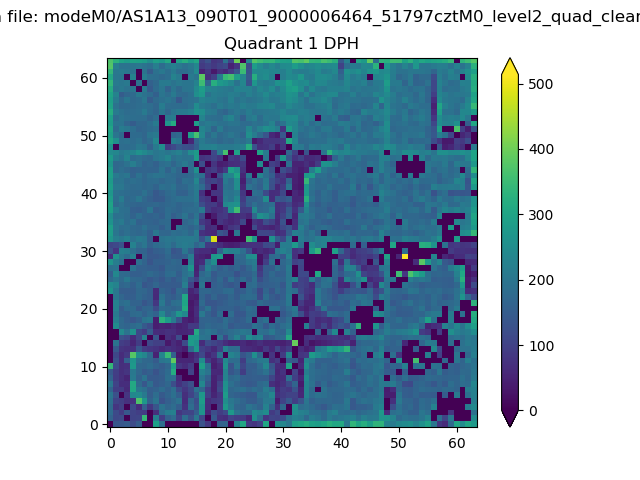 |
Quadrant B |
|---|---|---|---|
| Quadrant D | 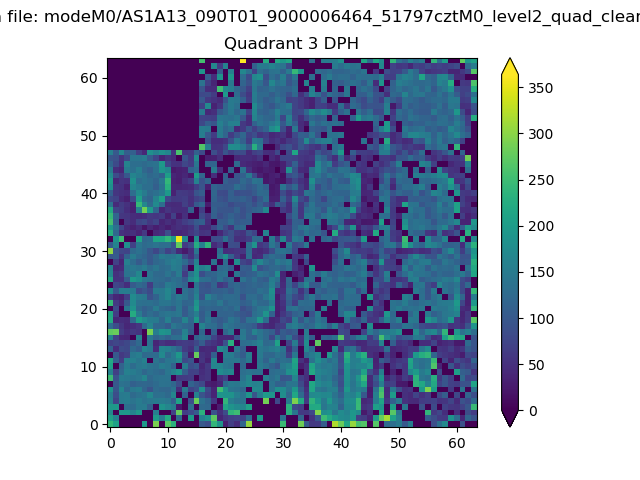 |
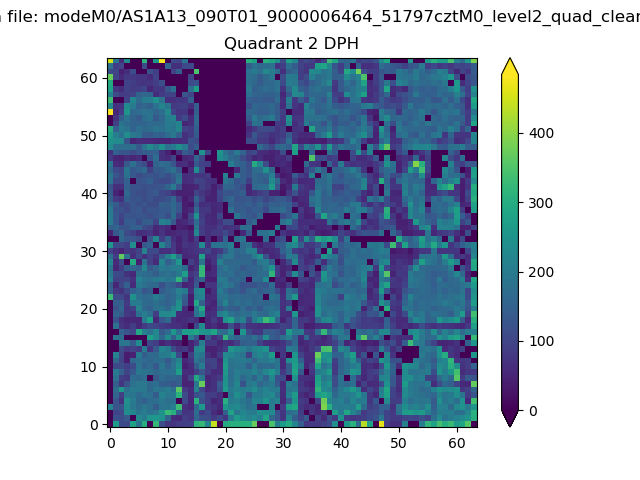 |
Quadrant C |
| Plot type | Count rate plots | Images |
|---|---|---|
| Comparison with Poisson distribution Blue bars denote a histogram of data divided into 1 sec bins. Red curve is a Poisson curve with rate = median count rate of data. |
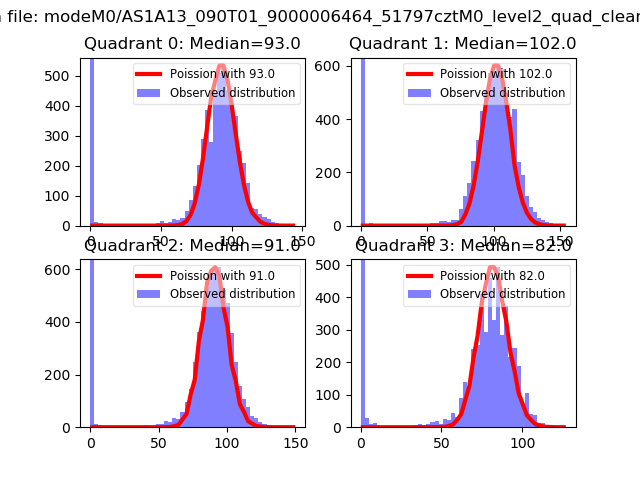 |
 |
| Quadrant-wise count rates Data is divided into 100 sec bins |
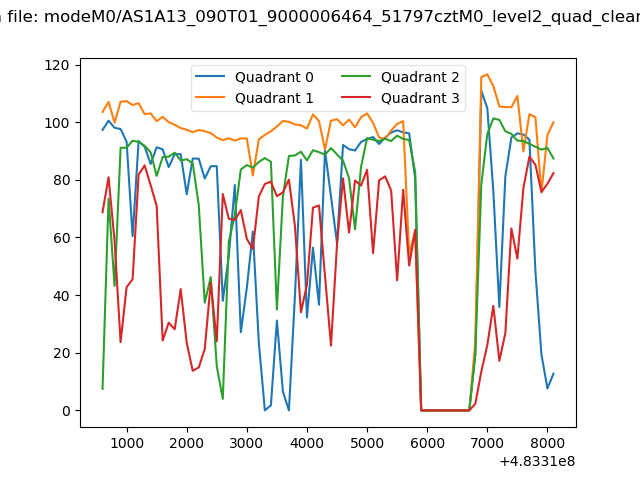 |
|
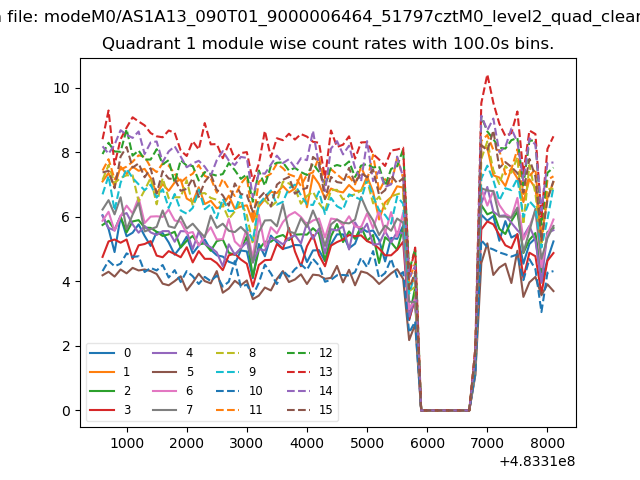
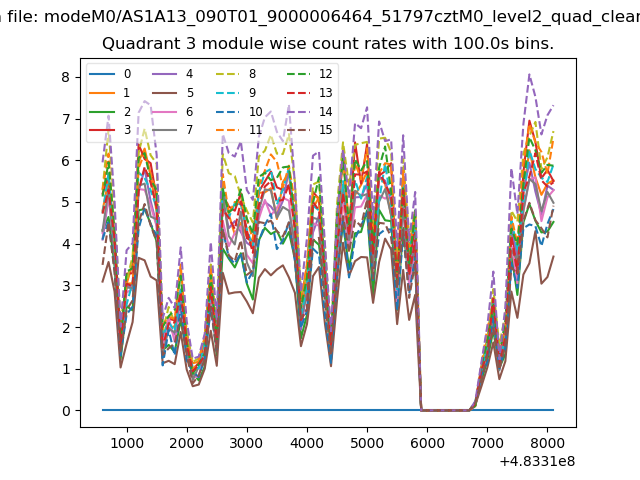
| Module-wise count rates for Quadrant A Data is divided into 100 sec bins |
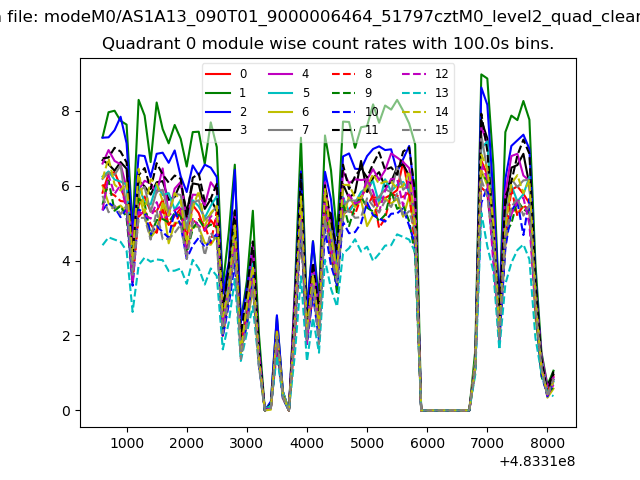 |
 |
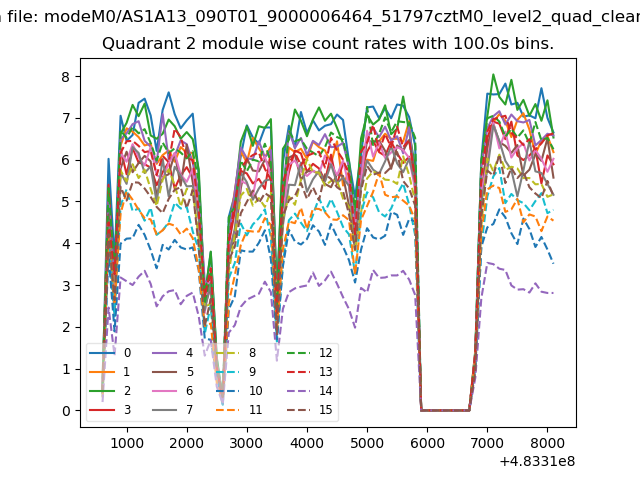
| Module-wise count rates for Quadrant B Data is divided into 100 sec bins |
 |
 |
| Module-wise count rates for Quadrant C Data is divided into 100 sec bins |
 |
 |
| Module-wise count rates for Quadrant D Data is divided into 100 sec bins |
 |
 |
| Parameter | Plot |
|---|---|
| CZT HV Monitor | 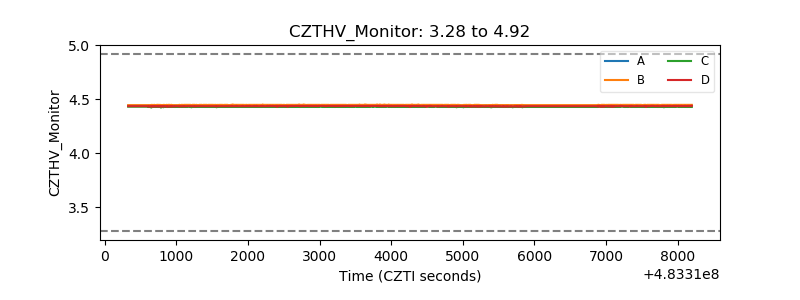 |
| D_VDD | 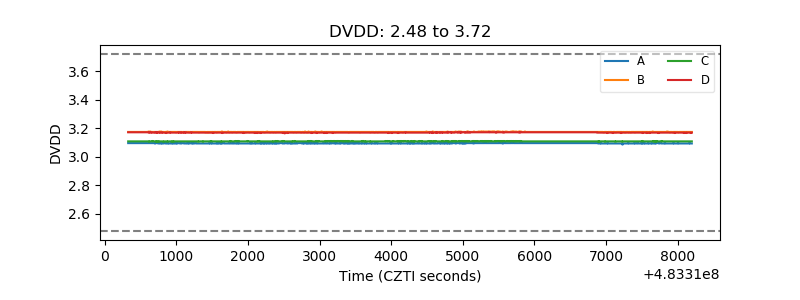 |
| Temperature 1 | 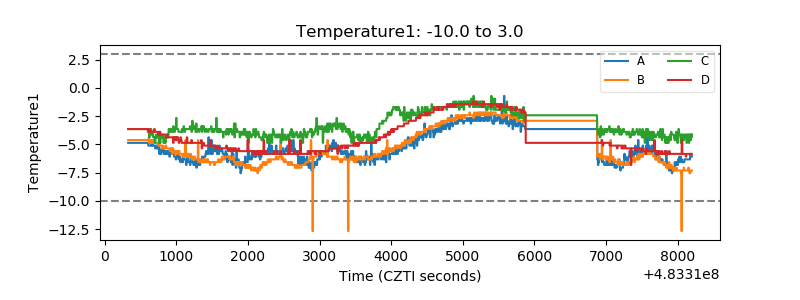 |
| Veto HV Monitor | 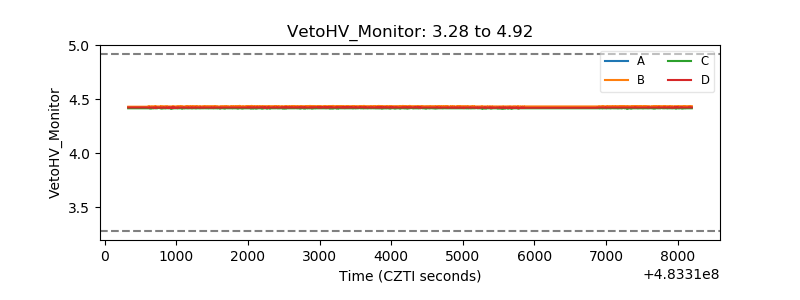 |
| Veto LLD | 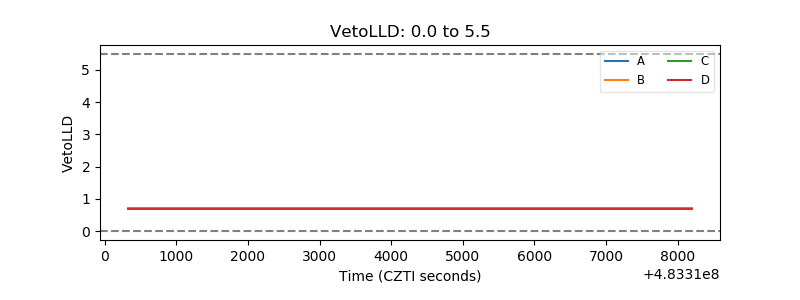 |
| Alpha Counter | 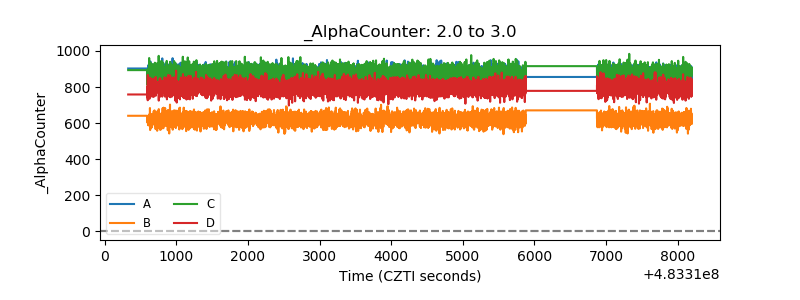 |
| _CPM_Rate | 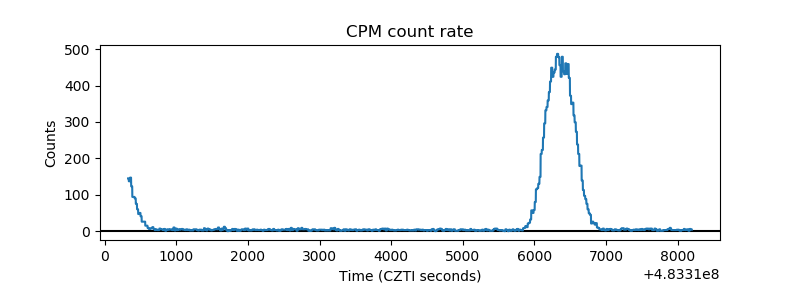 |
| CZT Counter | 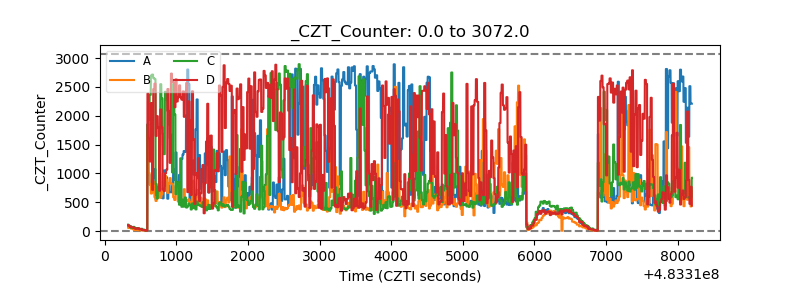 |
| +2.5 Volts monitor | 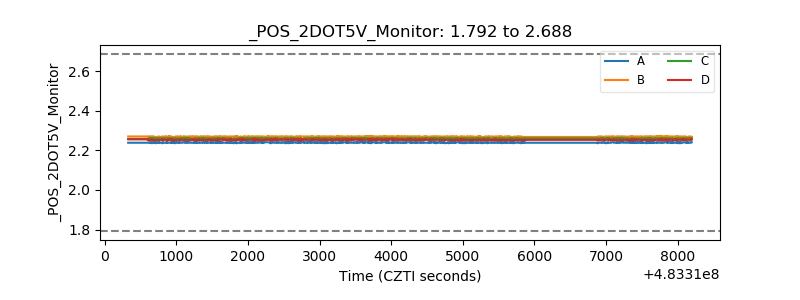 |
| +5 Volts monitor | 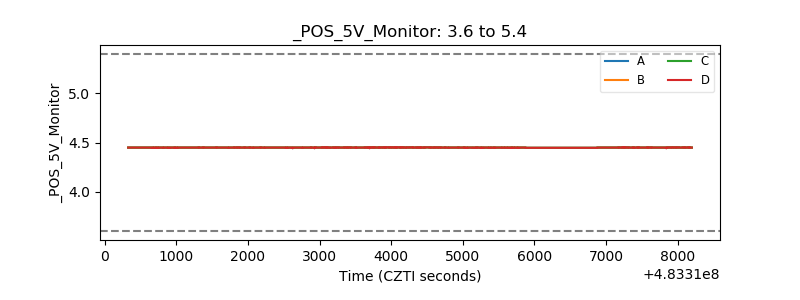 |
| _ROLL_ROT | 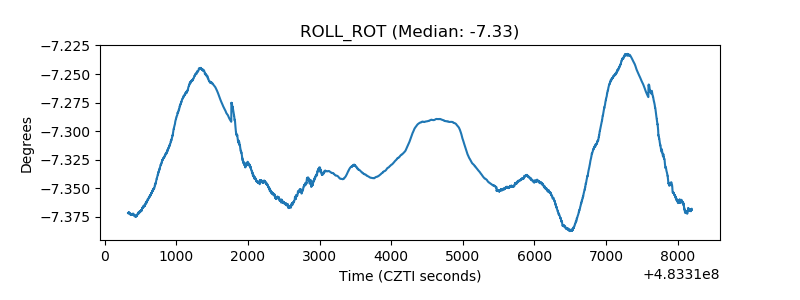 |
| _Roll_DEC |  |
| _Roll_RA | 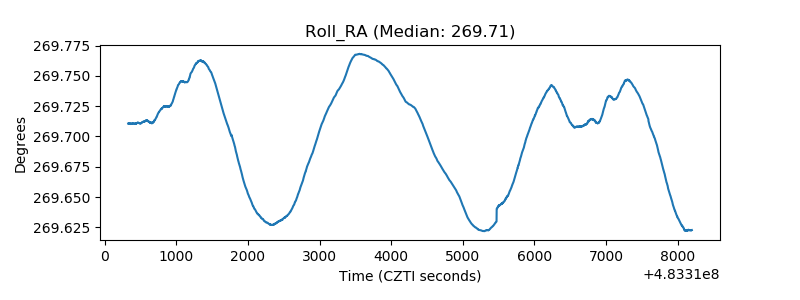 |
| Veto Counter | 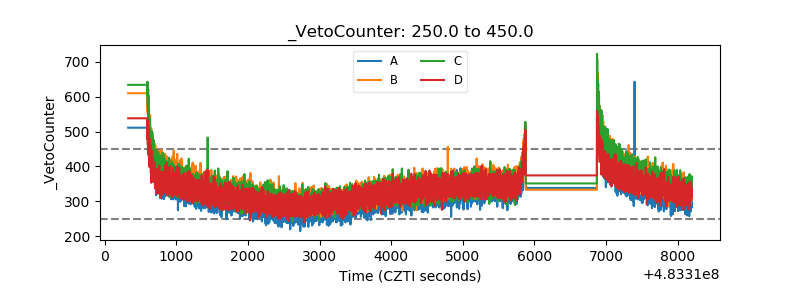 |