| Param | Original file | Final file |
|---|---|---|
| Filename | modeM0/AS1A13_090T01_9000006464_51798cztM0_level2.fits | modeM0/AS1A13_090T01_9000006464_51798cztM0_level2_quad_clean.evt |
| Size (bytes) | 684,460,800 | 93,562,560 |
| Size | 652.8 MB | 89.2 MB |
| Events in quadrant A | 7,582,888 | 534,702 |
| Events in quadrant B | 4,962,204 | 690,247 |
| Events in quadrant C | 5,433,743 | 614,251 |
| Events in quadrant D | 6,826,444 | 515,361 |
| Mode M9 | |||
|---|---|---|---|
| Quadrant | BADHDUFLAG | Total packets | Discarded packets |
| A | 0 | 20 | 0 |
| B | 0 | 20 | 0 |
| C | 0 | 20 | 0 |
| D | 0 | 20 | 0 |
| Mode SS | |||
|---|---|---|---|
| Quadrant | BADHDUFLAG | Total packets | Discarded packets |
| A | 0 | 142 | 0 |
| B | 0 | 142 | 0 |
| C | 0 | 142 | 0 |
| D | 0 | 142 | 0 |
| Mode M0 | |||
|---|---|---|---|
| Quadrant | BADHDUFLAG | Total packets | Discarded packets |
| A | 0 | 27150 | 2 |
| B | 0 | 19498 | 2 |
| C | 0 | 20870 | 2 |
| D | 0 | 25044 | 2 |
| Quadrant | Total seconds | Saturated seconds | Saturation percentage |
|---|---|---|---|
| A | 6859 | 1426 | 20.790203% |
| B | 6860 | 422 | 6.151603% |
| C | 6860 | 302 | 4.402332% |
| D | 6860 | 1052 | 15.335277% |
Noise dominated data is calculated using 1-second bins in cleaned event files. If a bin has >2000 counts, and if more than 50% of those come from <1% of pixels, then it is considered to be noise-dominated and hence unusable.
| Quadrant | # 1 sec bins | Bins with >0 counts | Bins with >2000 counts | High rate bins dominated by noise | Noise dominated (total time) | Noise dominated (detector-on time) | Marked lightcurve |
|---|---|---|---|---|---|---|---|
| A | 8929 | 6861 | 1381 | 1381 | 15.47% | 20.13% | 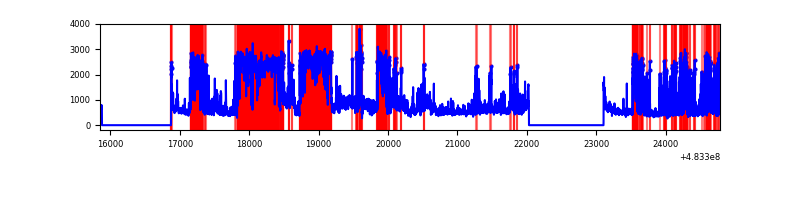 |
| B | 8929 | 6860 | 262 | 262 | 2.93% | 3.82% | 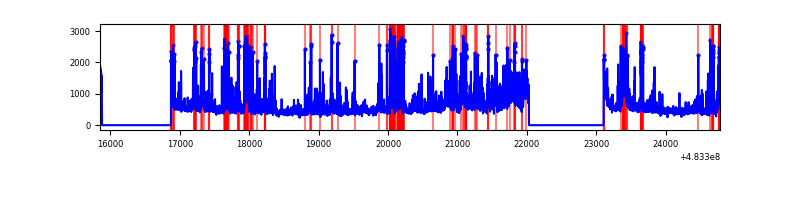 |
| C | 8930 | 6862 | 264 | 264 | 2.96% | 3.85% | 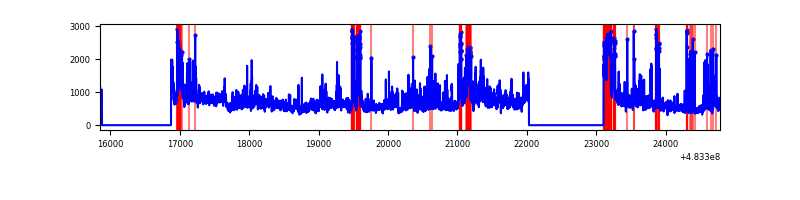 |
| D | 8930 | 6861 | 1010 | 1010 | 11.31% | 14.72% | 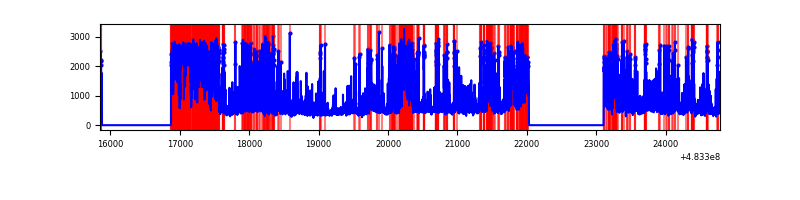 |
Top three noisy pixels from each quadrant. If the there are fewer than three noisy pixels in the level2.evt file, extra rows are filled as -1
| Pixel properties | Quadrant properties | ||||||
|---|---|---|---|---|---|---|---|
| Quadrant | DetID | PixID | Counts | Sigma | Mean | Median | Sigma |
| A | 15 | 174 | 2846499 | 17402.85 | 653 | 637 | 163.5 |
| A | 7 | 64 | 890076 | 5439.05 | 653 | 637 | 163.5 |
| A | 12 | 3 | 492878 | 3010.12 | 653 | 637 | 163.5 |
| B | 10 | 128 | 749729 | 4786.23 | 724 | 697 | 156.5 |
| B | 5 | 32 | 279827 | 1783.61 | 724 | 697 | 156.5 |
| B | 0 | 171 | 228764 | 1457.32 | 724 | 697 | 156.5 |
| C | 10 | 22 | 1000149 | 5074.57 | 713 | 709 | 197.0 |
| C | 15 | 218 | 516773 | 2620.27 | 713 | 709 | 197.0 |
| C | 15 | 192 | 426375 | 2161.28 | 713 | 709 | 197.0 |
| D | 11 | 129 | 2802994 | 15351.98 | 657 | 634 | 182.5 |
| D | 8 | 176 | 692360 | 3789.43 | 657 | 634 | 182.5 |
| D | 3 | 12 | 286214 | 1564.47 | 657 | 634 | 182.5 |
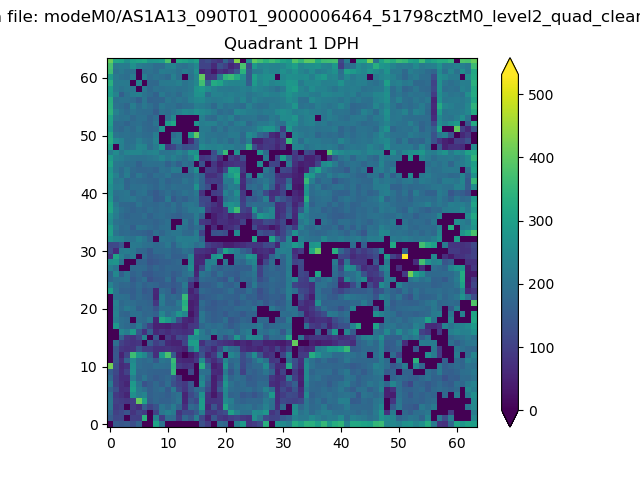
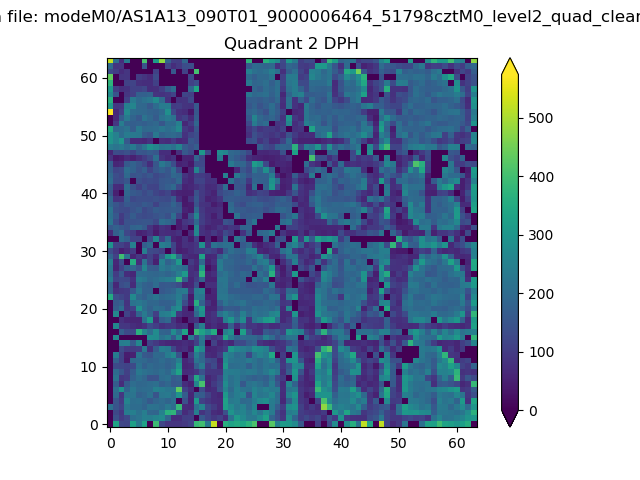
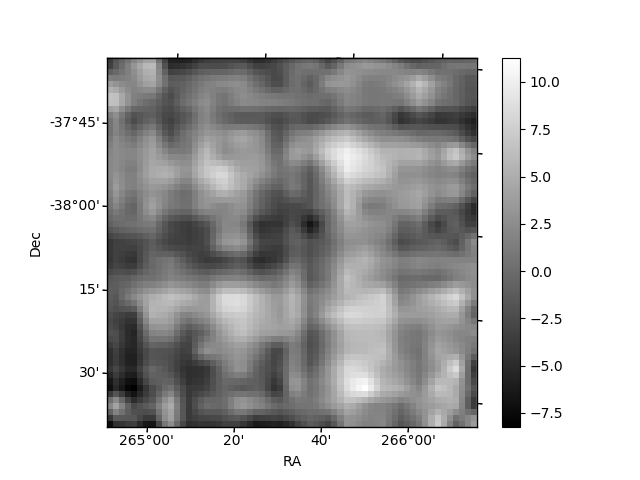
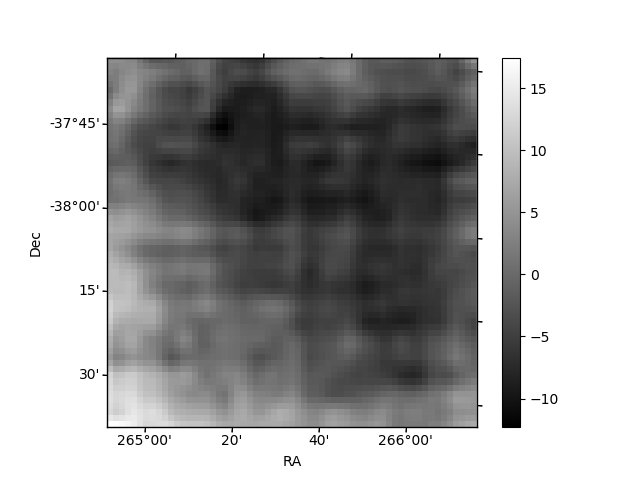
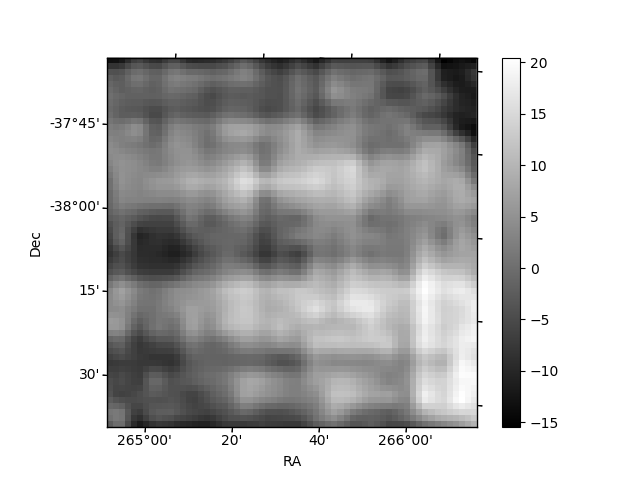
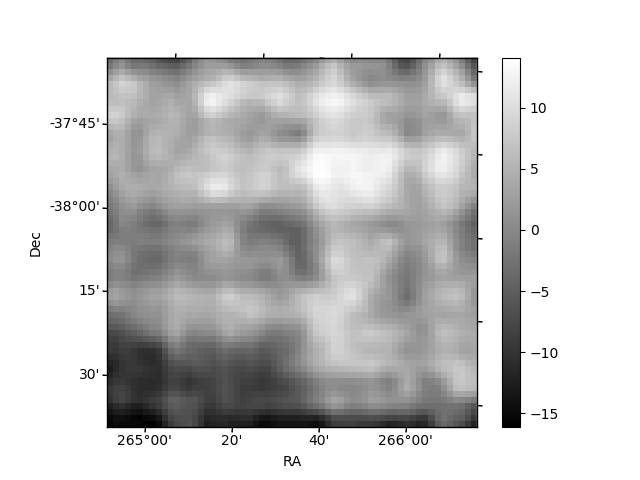
Histogram calculated using DETX and DETY for each event in the final _common_clean file
| Quadrant A |  |
 |
Quadrant B |
|---|---|---|---|
| Quadrant D |  |
 |
Quadrant C |
| Plot type | Count rate plots | Images |
|---|---|---|
| Comparison with Poisson distribution Blue bars denote a histogram of data divided into 1 sec bins. Red curve is a Poisson curve with rate = median count rate of data. |
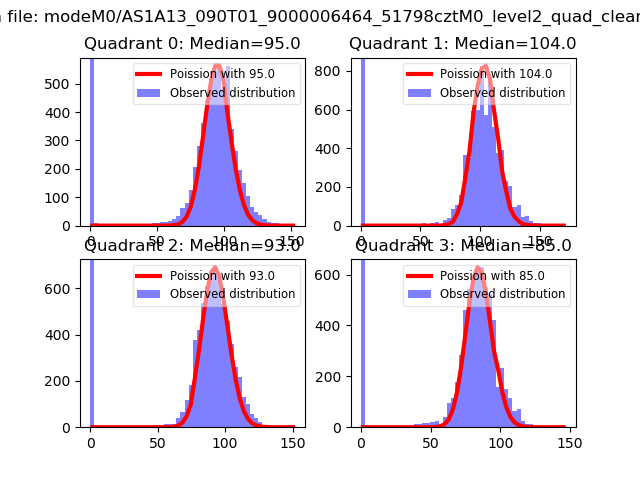 |
 |
| Quadrant-wise count rates Data is divided into 100 sec bins |
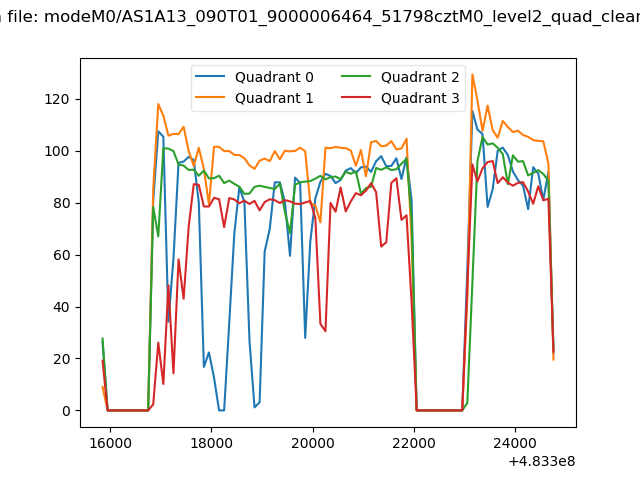 |
|
| Module-wise count rates for Quadrant A Data is divided into 100 sec bins |
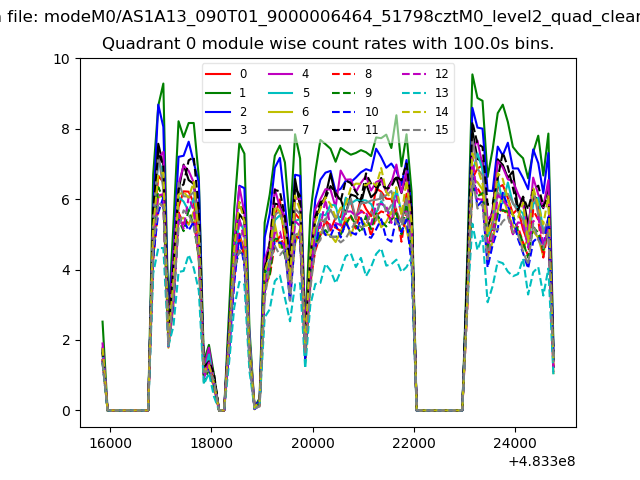 |
 |
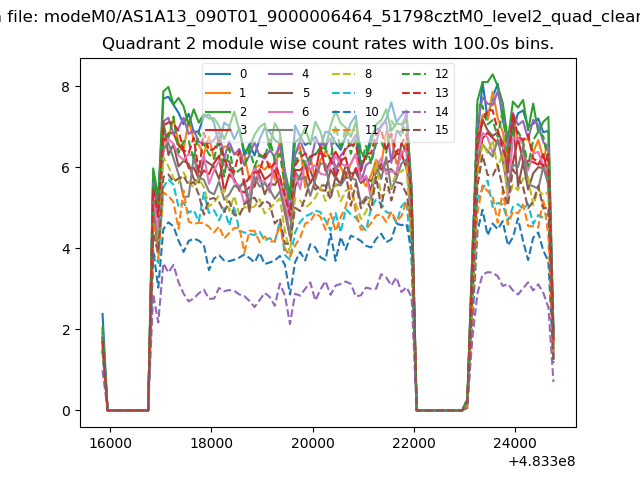
| Module-wise count rates for Quadrant B Data is divided into 100 sec bins |
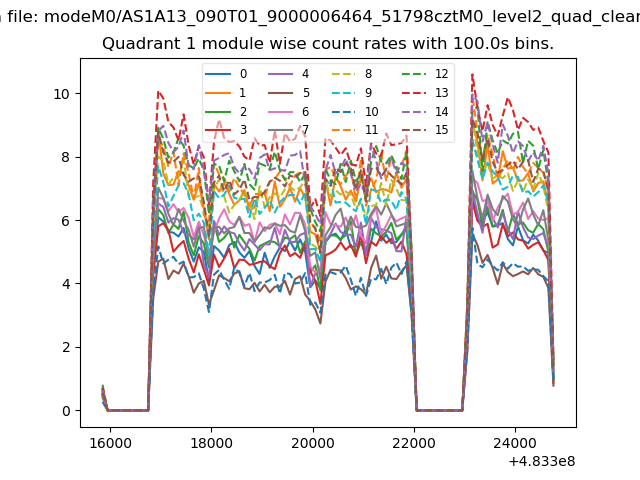 |
 |
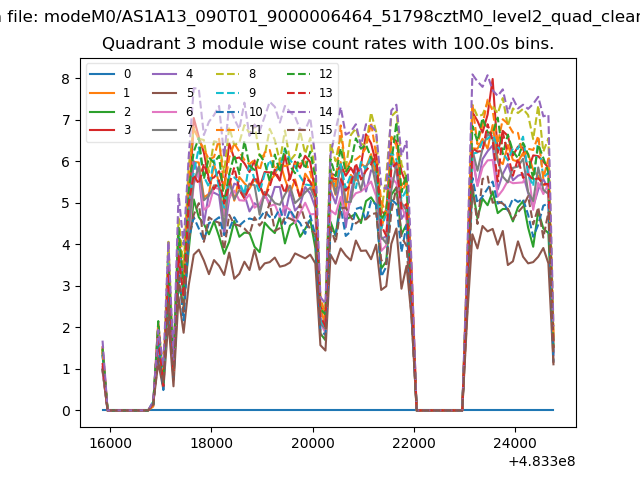
| Module-wise count rates for Quadrant C Data is divided into 100 sec bins |
 |
 |
| Module-wise count rates for Quadrant D Data is divided into 100 sec bins |
 |
 |
| Parameter | Plot |
|---|---|
| CZT HV Monitor | 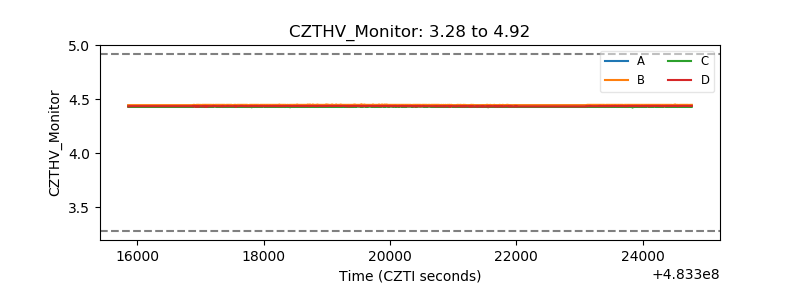 |
| D_VDD | 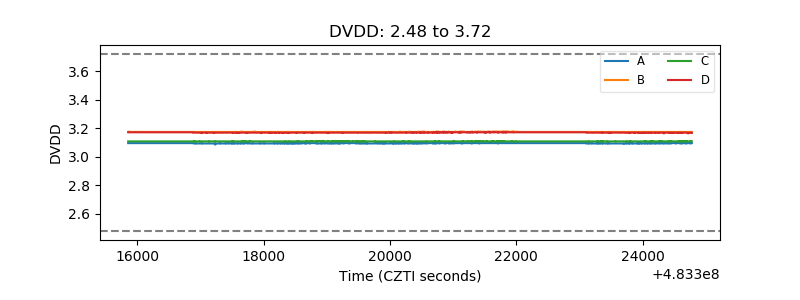 |
| Temperature 1 | 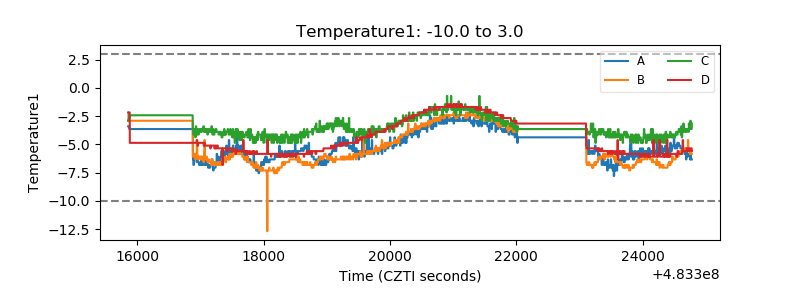 |
| Veto HV Monitor |  |
| Veto LLD | 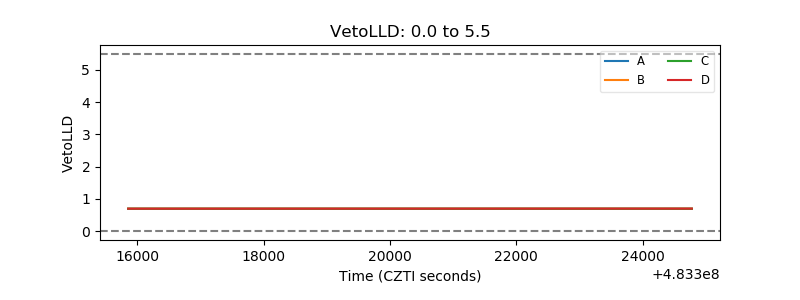 |
| Alpha Counter | 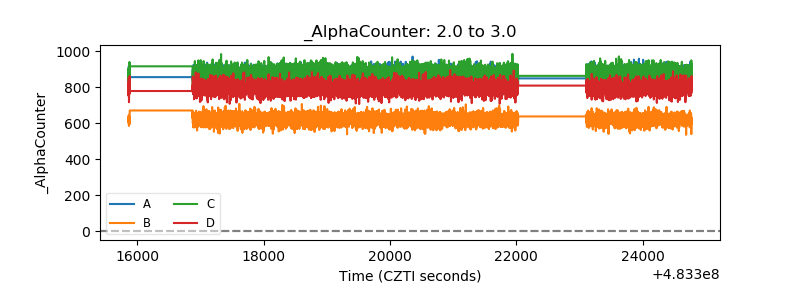 |
| _CPM_Rate | 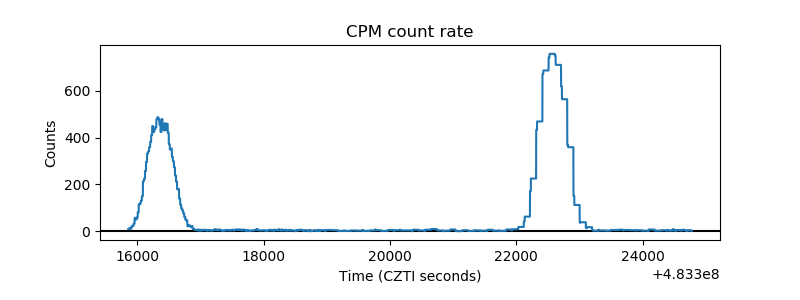 |
| CZT Counter | 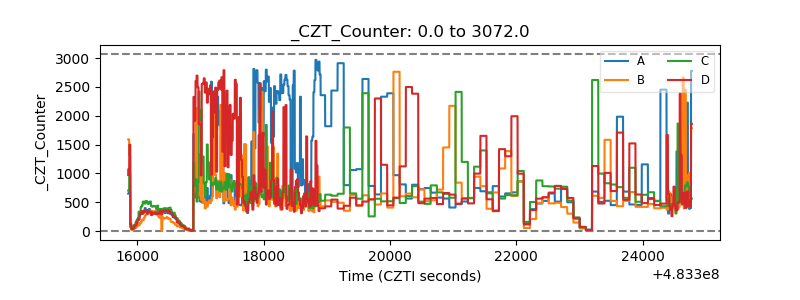 |
| +2.5 Volts monitor |  |
| +5 Volts monitor | 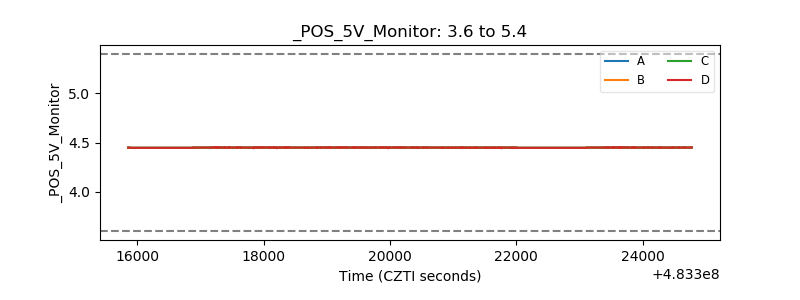 |
| _ROLL_ROT | 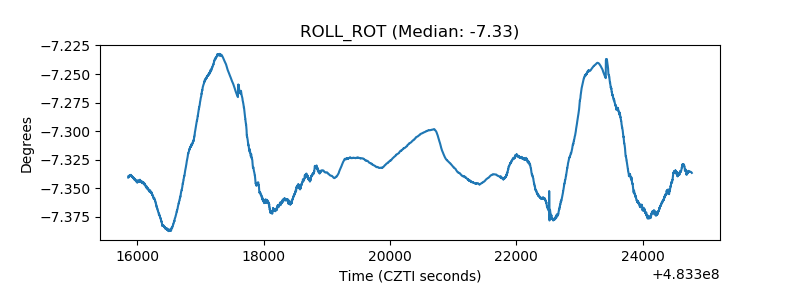 |
| _Roll_DEC | 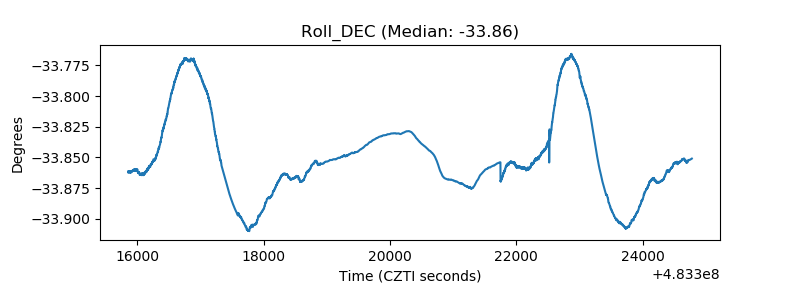 |
| _Roll_RA | 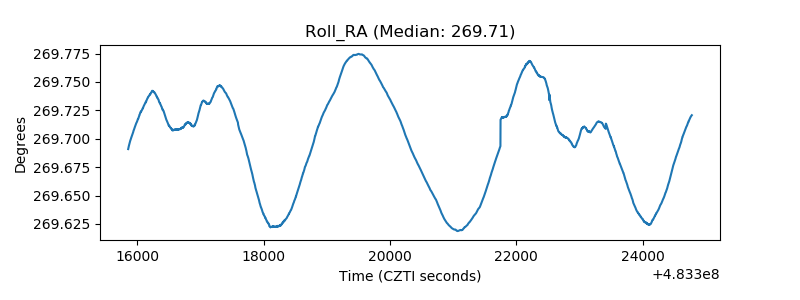 |
| Veto Counter | 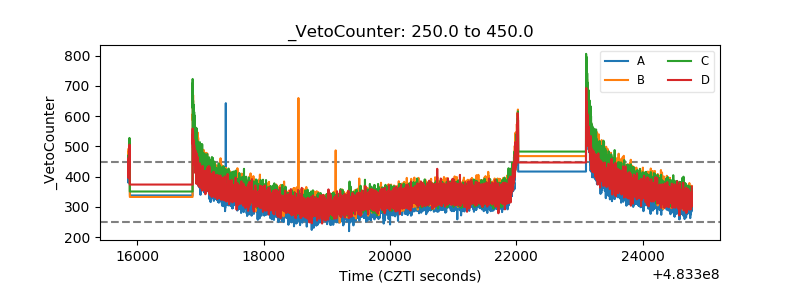 |