| Param | Original file | Final file |
|---|---|---|
| Filename | modeM0/AS1A13_090T01_9000006464_51799cztM0_level2.fits | modeM0/AS1A13_090T01_9000006464_51799cztM0_level2_quad_clean.evt |
| Size (bytes) | 651,202,560 | 99,169,920 |
| Size | 621.0 MB | 94.6 MB |
| Events in quadrant A | 5,269,607 | 649,647 |
| Events in quadrant B | 6,007,242 | 683,236 |
| Events in quadrant C | 5,829,143 | 619,475 |
| Events in quadrant D | 6,466,028 | 570,262 |
| Mode M9 | |||
|---|---|---|---|
| Quadrant | BADHDUFLAG | Total packets | Discarded packets |
| A | 0 | 22 | 0 |
| B | 0 | 22 | 0 |
| C | 0 | 22 | 0 |
| D | 0 | 22 | 0 |
| Mode SS | |||
|---|---|---|---|
| Quadrant | BADHDUFLAG | Total packets | Discarded packets |
| A | 0 | 142 | 0 |
| B | 0 | 142 | 0 |
| C | 0 | 142 | 0 |
| D | 0 | 142 | 0 |
| Mode M0 | |||
|---|---|---|---|
| Quadrant | BADHDUFLAG | Total packets | Discarded packets |
| A | 0 | 20337 | 2 |
| B | 0 | 22617 | 2 |
| C | 0 | 22099 | 2 |
| D | 0 | 23925 | 2 |
| Quadrant | Total seconds | Saturated seconds | Saturation percentage |
|---|---|---|---|
| A | 6890 | 375 | 5.442671% |
| B | 6891 | 741 | 10.753156% |
| C | 6891 | 511 | 7.415469% |
| D | 6891 | 682 | 9.896967% |
Noise dominated data is calculated using 1-second bins in cleaned event files. If a bin has >2000 counts, and if more than 50% of those come from <1% of pixels, then it is considered to be noise-dominated and hence unusable.
| Quadrant | # 1 sec bins | Bins with >0 counts | Bins with >2000 counts | High rate bins dominated by noise | Noise dominated (total time) | Noise dominated (detector-on time) | Marked lightcurve |
|---|---|---|---|---|---|---|---|
| A | 9130 | 6892 | 348 | 348 | 3.81% | 5.05% | 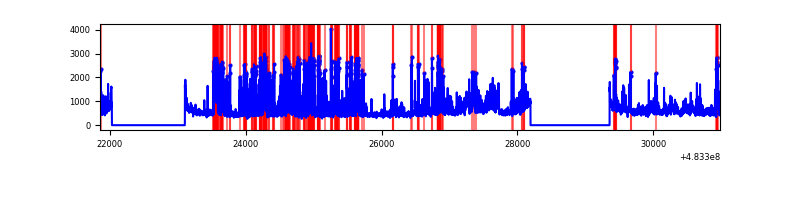 |
| B | 9131 | 6893 | 493 | 493 | 5.40% | 7.15% | 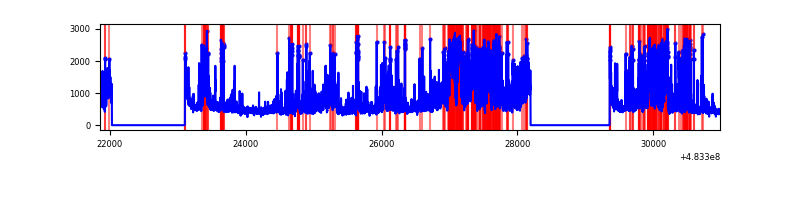 |
| C | 9131 | 6892 | 446 | 446 | 4.88% | 6.47% | 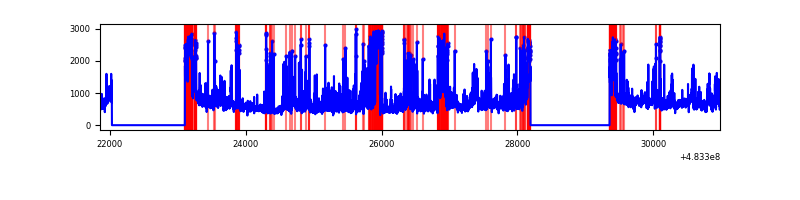 |
| D | 9131 | 6892 | 674 | 674 | 7.38% | 9.78% | 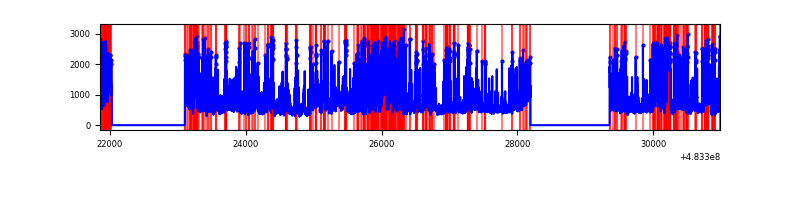 |
Top three noisy pixels from each quadrant. If the there are fewer than three noisy pixels in the level2.evt file, extra rows are filled as -1
| Pixel properties | Quadrant properties | ||||||
|---|---|---|---|---|---|---|---|
| Quadrant | DetID | PixID | Counts | Sigma | Mean | Median | Sigma |
| A | 7 | 64 | 990094 | 5368.38 | 741 | 723 | 184.3 |
| A | 11 | 3 | 228590 | 1236.42 | 741 | 723 | 184.3 |
| A | 12 | 3 | 204474 | 1105.56 | 741 | 723 | 184.3 |
| B | 10 | 128 | 911902 | 5781.78 | 731 | 705 | 157.6 |
| B | 5 | 32 | 429558 | 2721.18 | 731 | 705 | 157.6 |
| B | 12 | 32 | 382521 | 2422.72 | 731 | 705 | 157.6 |
| C | 15 | 218 | 822486 | 4176.52 | 718 | 713 | 196.8 |
| C | 10 | 22 | 796169 | 4042.76 | 718 | 713 | 196.8 |
| C | 13 | 3 | 585420 | 2971.67 | 718 | 713 | 196.8 |
| D | 11 | 129 | 1901030 | 9572.79 | 711 | 686 | 198.5 |
| D | 8 | 176 | 738946 | 3718.91 | 711 | 686 | 198.5 |
| D | 3 | 12 | 460990 | 2318.74 | 711 | 686 | 198.5 |
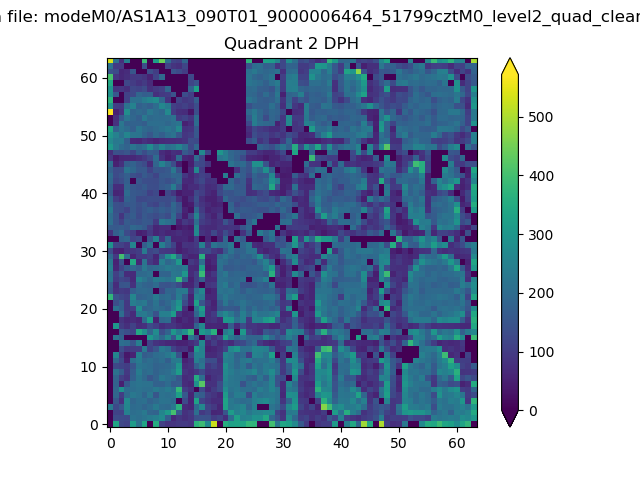
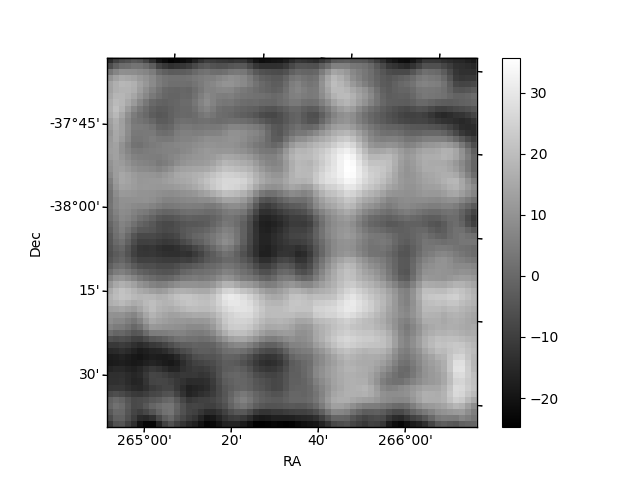
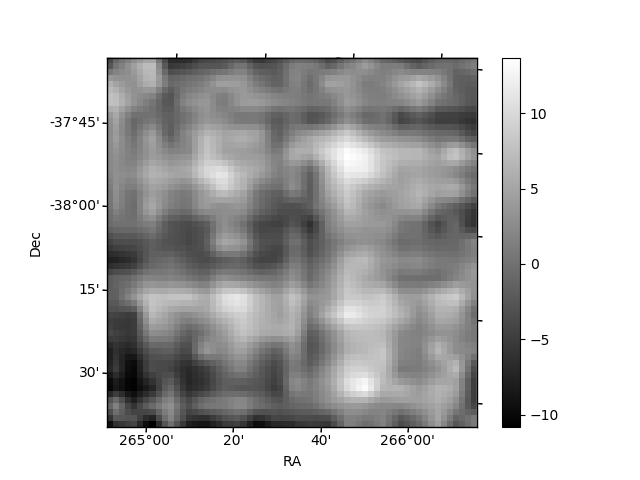
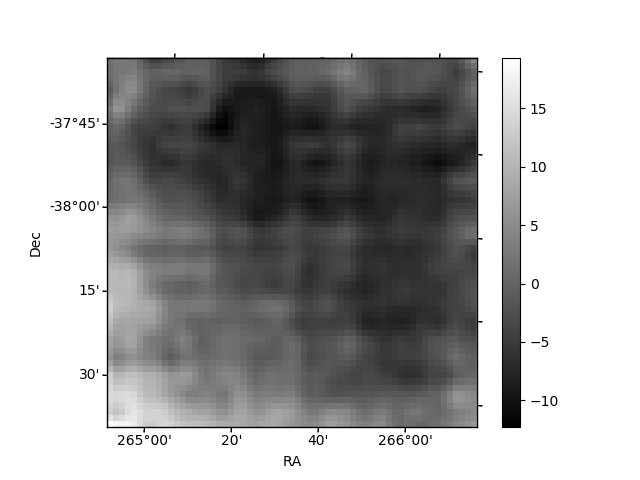
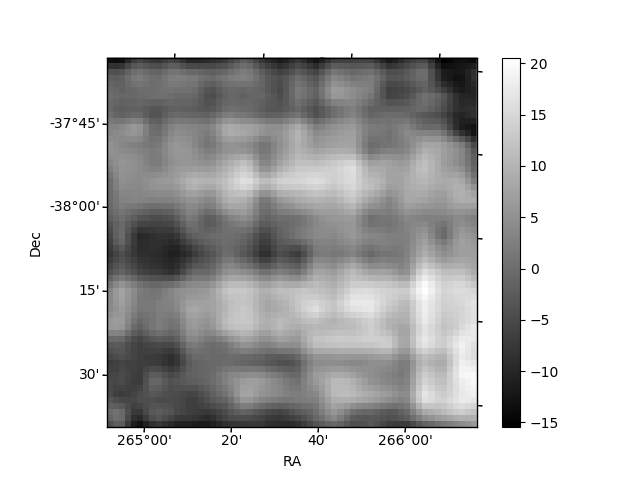
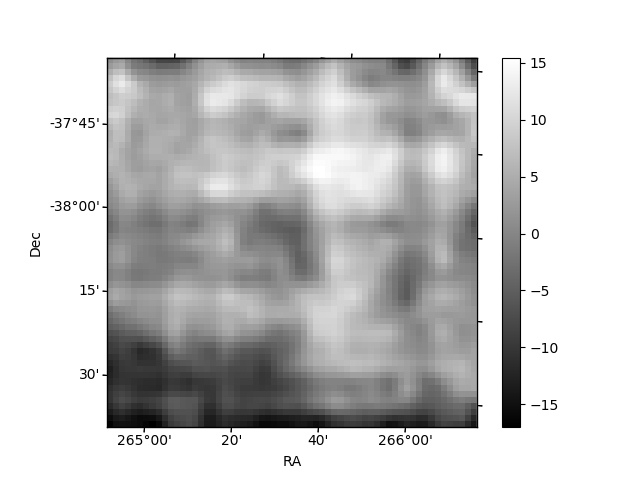
Histogram calculated using DETX and DETY for each event in the final _common_clean file
| Quadrant A | 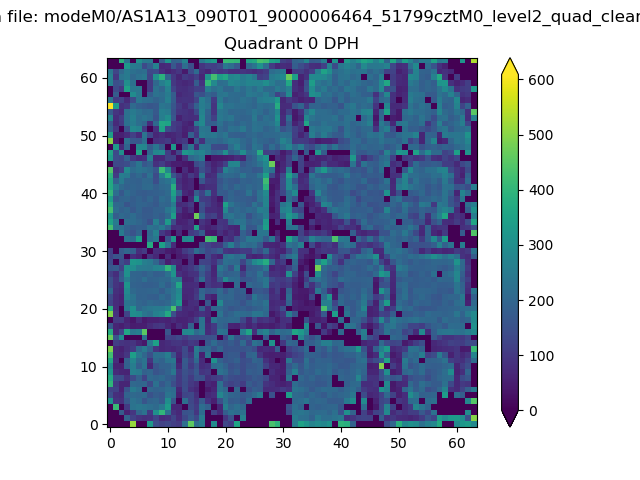 |
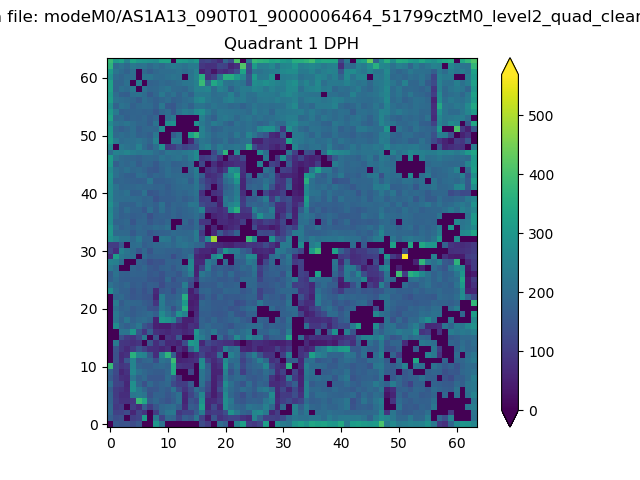 |
Quadrant B |
|---|---|---|---|
| Quadrant D | 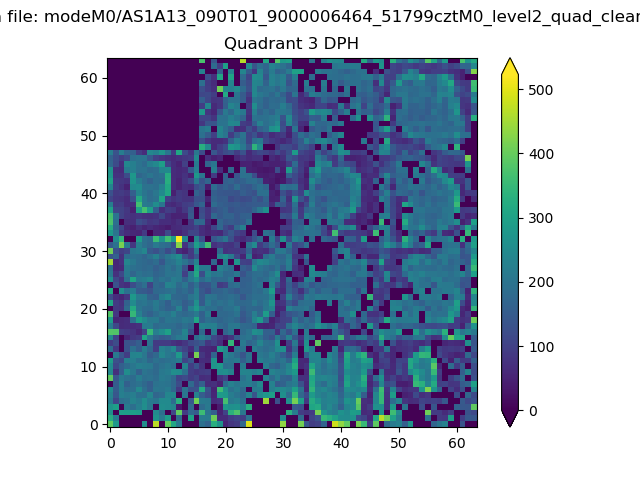 |
 |
Quadrant C |
| Plot type | Count rate plots | Images |
|---|---|---|
| Comparison with Poisson distribution Blue bars denote a histogram of data divided into 1 sec bins. Red curve is a Poisson curve with rate = median count rate of data. |
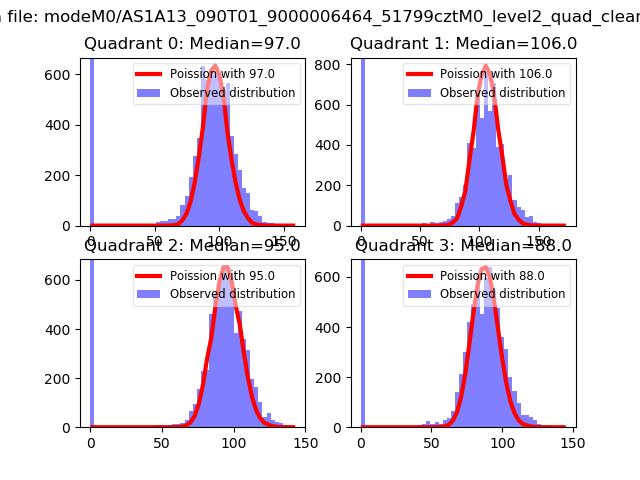 |
 |
| Quadrant-wise count rates Data is divided into 100 sec bins |
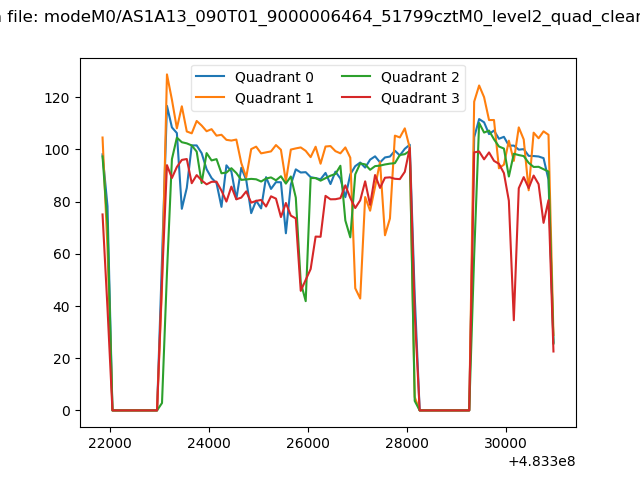 |
|
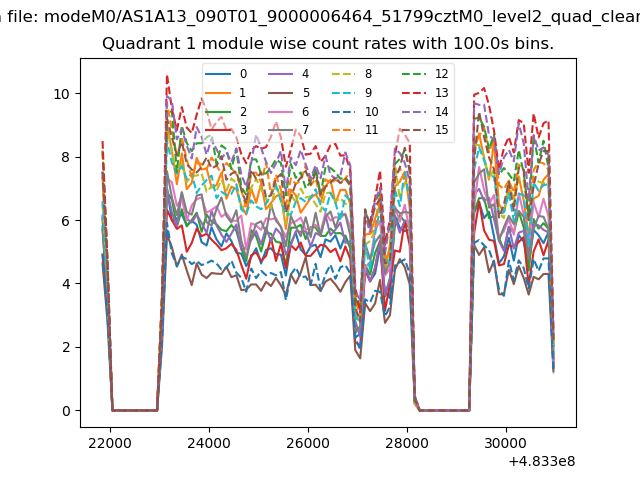
| Module-wise count rates for Quadrant A Data is divided into 100 sec bins |
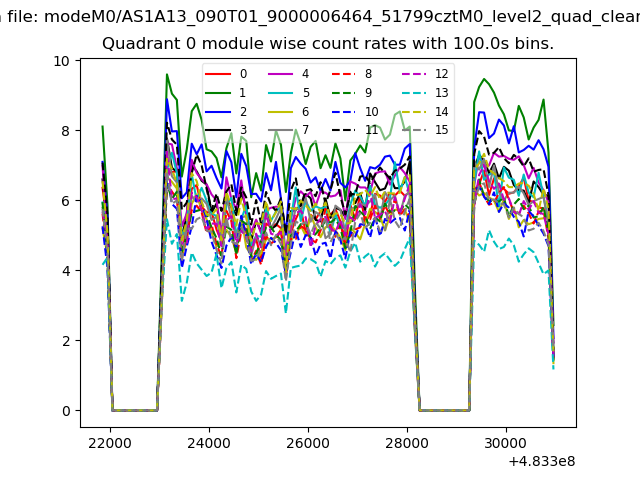 |
 |
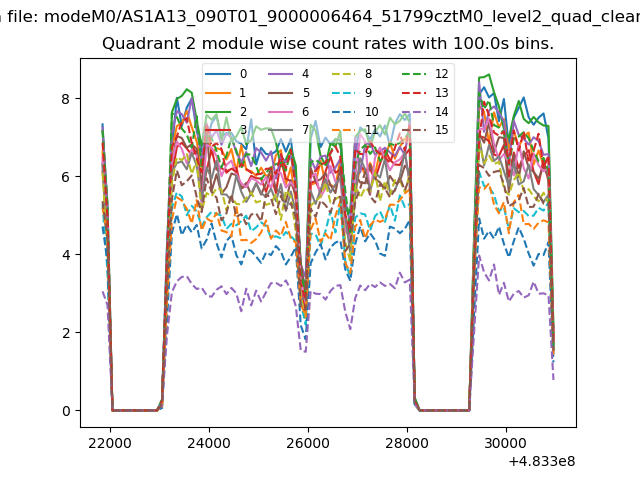
| Module-wise count rates for Quadrant B Data is divided into 100 sec bins |
 |
 |
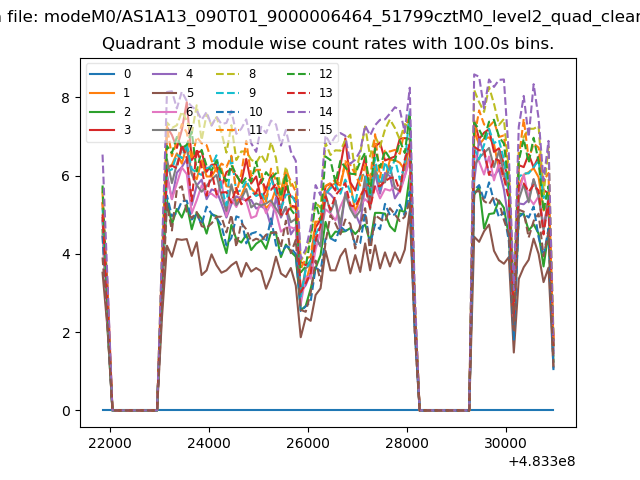
| Module-wise count rates for Quadrant C Data is divided into 100 sec bins |
 |
 |
| Module-wise count rates for Quadrant D Data is divided into 100 sec bins |
 |
 |
| Parameter | Plot |
|---|---|
| CZT HV Monitor | 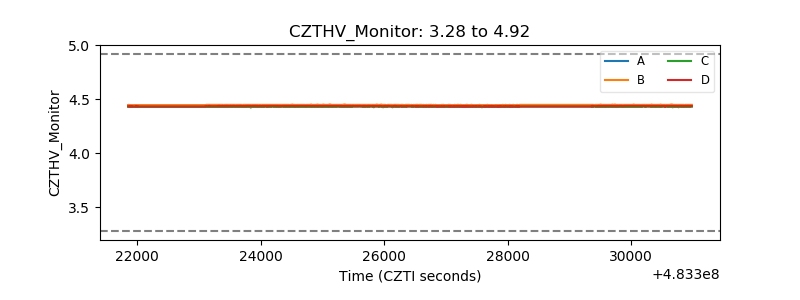 |
| D_VDD | 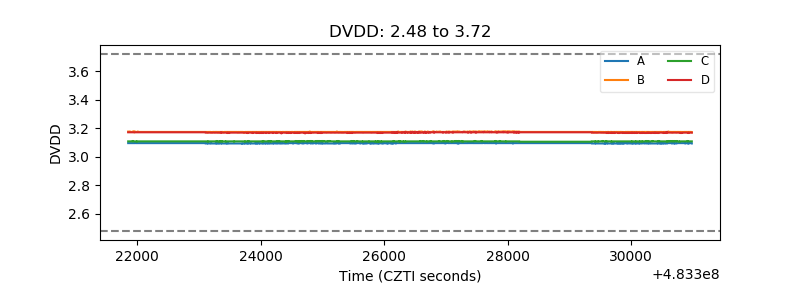 |
| Temperature 1 | 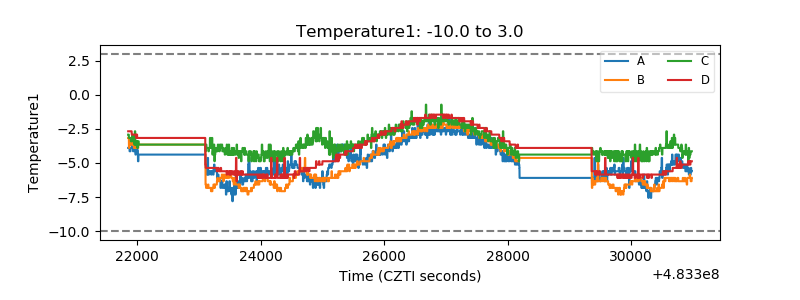 |
| Veto HV Monitor | 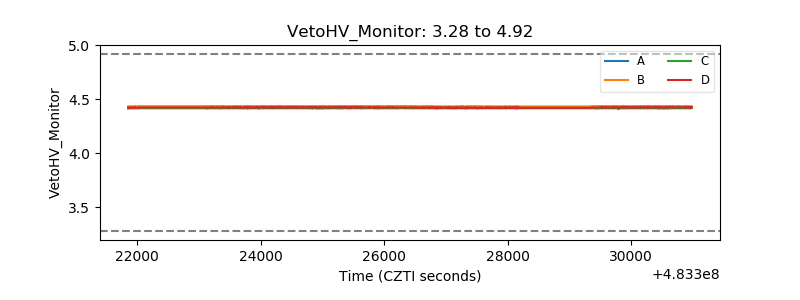 |
| Veto LLD | 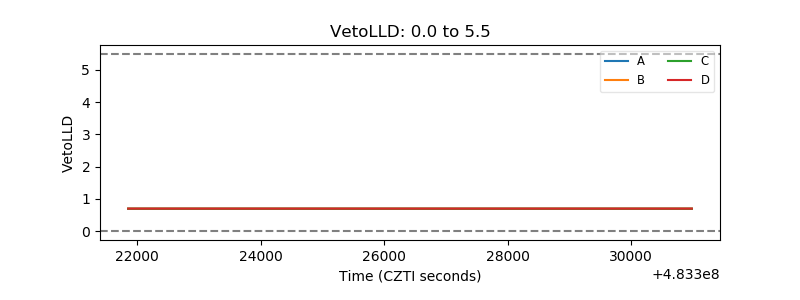 |
| Alpha Counter | 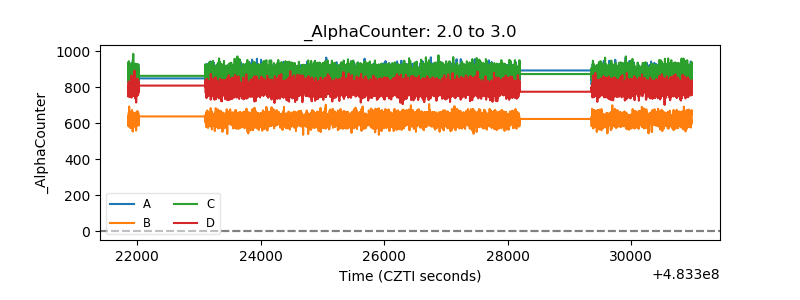 |
| _CPM_Rate | 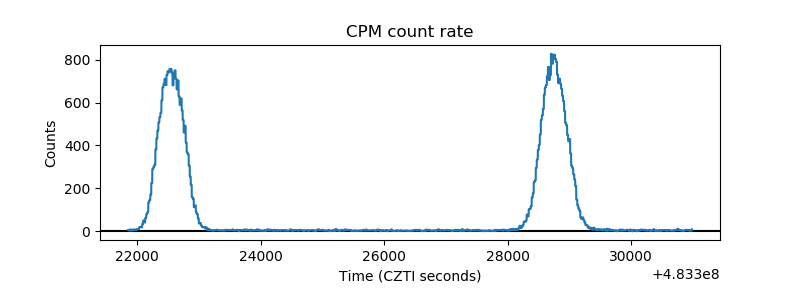 |
| CZT Counter | 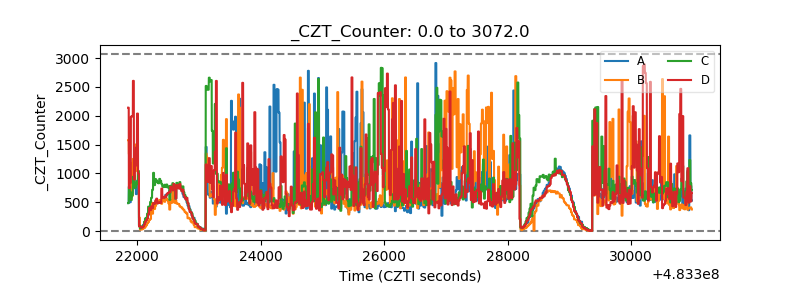 |
| +2.5 Volts monitor | 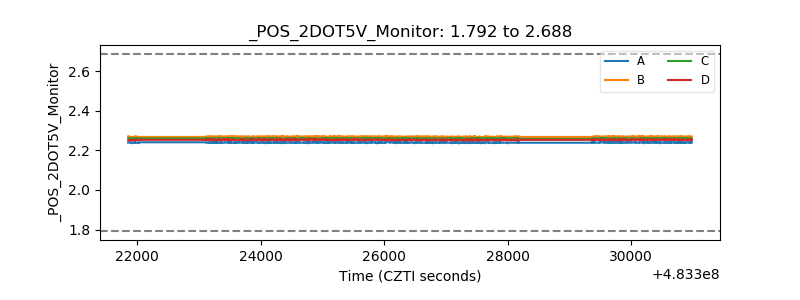 |
| +5 Volts monitor | 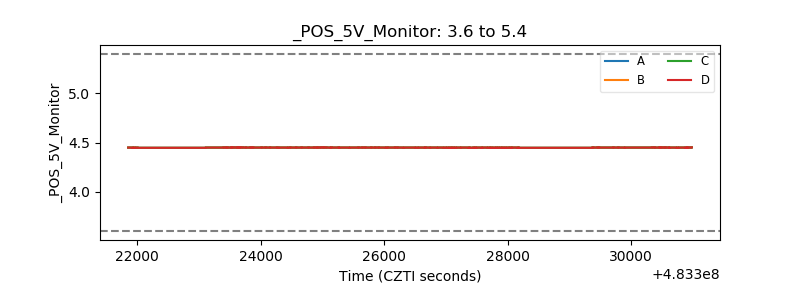 |
| _ROLL_ROT | 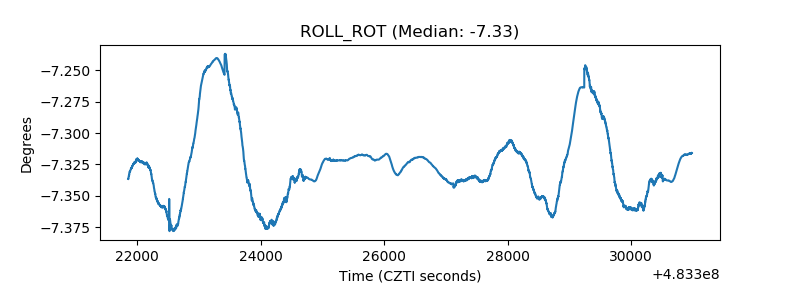 |
| _Roll_DEC | 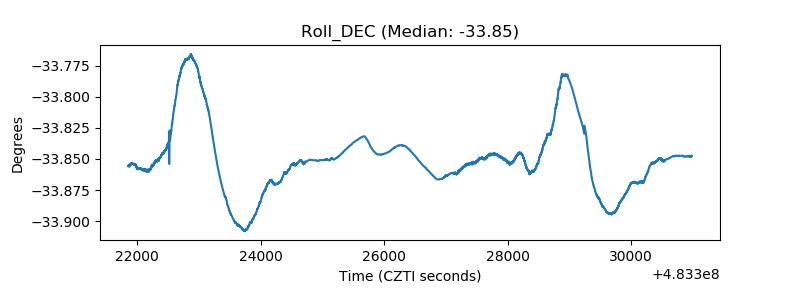 |
| _Roll_RA | 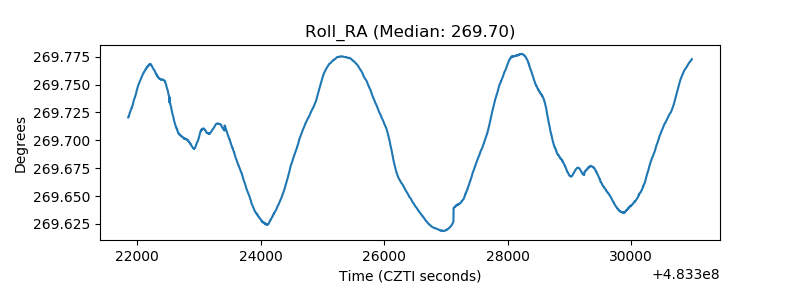 |
| Veto Counter | 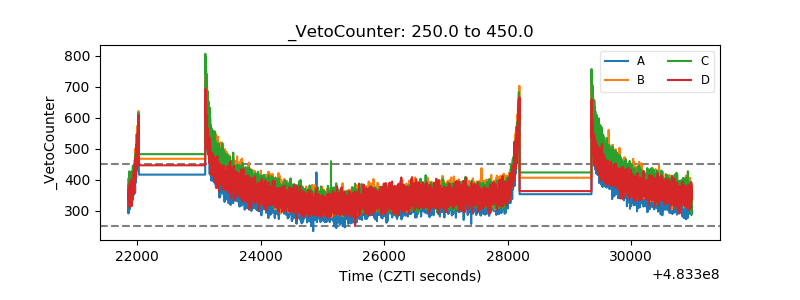 |