| Param | Original file | Final file |
|---|---|---|
| Filename | modeM0/AS1A13_090T01_9000006464_51800cztM0_level2.fits | modeM0/AS1A13_090T01_9000006464_51800cztM0_level2_quad_clean.evt |
| Size (bytes) | 643,970,880 | 84,634,560 |
| Size | 614.1 MB | 80.7 MB |
| Events in quadrant A | 5,039,768 | 573,681 |
| Events in quadrant B | 6,356,701 | 528,176 |
| Events in quadrant C | 4,764,408 | 572,818 |
| Events in quadrant D | 7,203,604 | 460,500 |
| Mode M9 | |||
|---|---|---|---|
| Quadrant | BADHDUFLAG | Total packets | Discarded packets |
| A | 0 | 11 | 0 |
| B | 0 | 11 | 0 |
| C | 0 | 11 | 0 |
| D | 0 | 11 | 0 |
| Mode SS | |||
|---|---|---|---|
| Quadrant | BADHDUFLAG | Total packets | Discarded packets |
| A | 0 | 126 | 0 |
| B | 0 | 126 | 0 |
| C | 0 | 126 | 0 |
| D | 0 | 126 | 0 |
| Mode M0 | |||
|---|---|---|---|
| Quadrant | BADHDUFLAG | Total packets | Discarded packets |
| A | 0 | 19120 | 2 |
| B | 0 | 23136 | 2 |
| C | 0 | 18543 | 2 |
| D | 0 | 25620 | 2 |
| Quadrant | Total seconds | Saturated seconds | Saturation percentage |
|---|---|---|---|
| A | 6115 | 350 | 5.723630% |
| B | 6115 | 1362 | 22.273099% |
| C | 6115 | 193 | 3.156173% |
| D | 6116 | 1175 | 19.211903% |
Noise dominated data is calculated using 1-second bins in cleaned event files. If a bin has >2000 counts, and if more than 50% of those come from <1% of pixels, then it is considered to be noise-dominated and hence unusable.
| Quadrant | # 1 sec bins | Bins with >0 counts | Bins with >2000 counts | High rate bins dominated by noise | Noise dominated (total time) | Noise dominated (detector-on time) | Marked lightcurve |
|---|---|---|---|---|---|---|---|
| A | 7240 | 6115 | 196 | 196 | 2.71% | 3.21% | 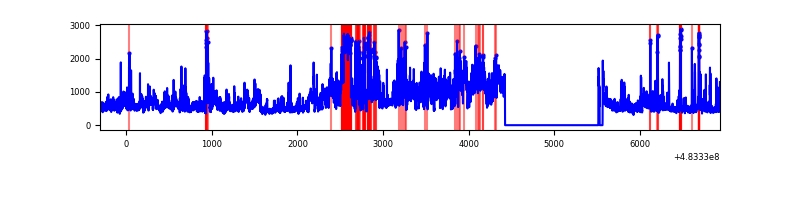 |
| B | 7240 | 6115 | 992 | 992 | 13.70% | 16.22% | 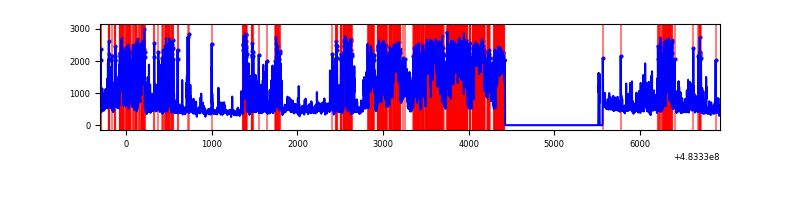 |
| C | 7240 | 6115 | 85 | 85 | 1.17% | 1.39% | 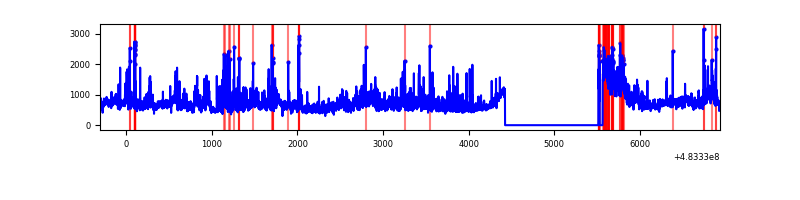 |
| D | 7241 | 6116 | 1110 | 1110 | 15.33% | 18.15% | 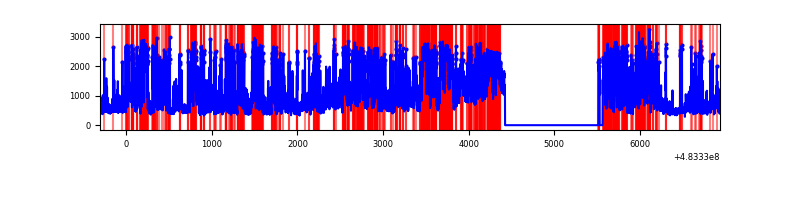 |
Top three noisy pixels from each quadrant. If the there are fewer than three noisy pixels in the level2.evt file, extra rows are filled as -1
| Pixel properties | Quadrant properties | ||||||
|---|---|---|---|---|---|---|---|
| Quadrant | DetID | PixID | Counts | Sigma | Mean | Median | Sigma |
| A | 3 | 14 | 1050286 | 6391.95 | 662 | 645 | 164.2 |
| A | 15 | 174 | 306407 | 1861.99 | 662 | 645 | 164.2 |
| A | 12 | 80 | 201525 | 1223.29 | 662 | 645 | 164.2 |
| B | 12 | 32 | 2489542 | 20165.34 | 578 | 557 | 123.4 |
| B | 10 | 128 | 488523 | 3953.42 | 578 | 557 | 123.4 |
| B | 10 | 44 | 253574 | 2049.9 | 578 | 557 | 123.4 |
| C | 10 | 22 | 964433 | 5319.68 | 660 | 655 | 181.2 |
| C | 15 | 192 | 336039 | 1851.19 | 660 | 655 | 181.2 |
| C | 5 | 250 | 301496 | 1660.53 | 660 | 655 | 181.2 |
| D | 11 | 129 | 3625435 | 21211.82 | 606 | 584 | 170.9 |
| D | 8 | 176 | 414430 | 2421.73 | 606 | 584 | 170.9 |
| D | 0 | 18 | 356616 | 2083.42 | 606 | 584 | 170.9 |
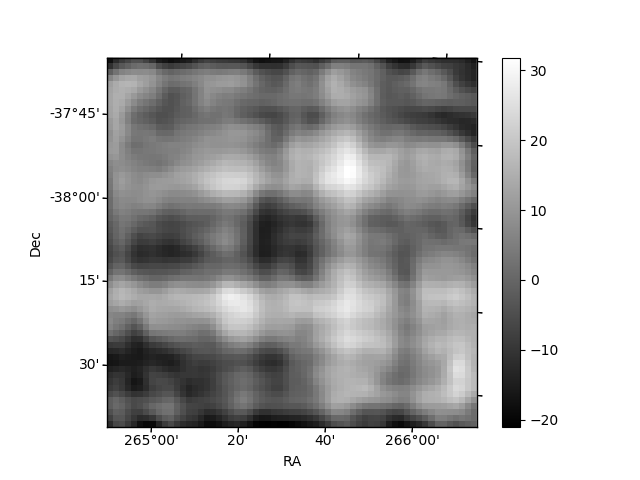
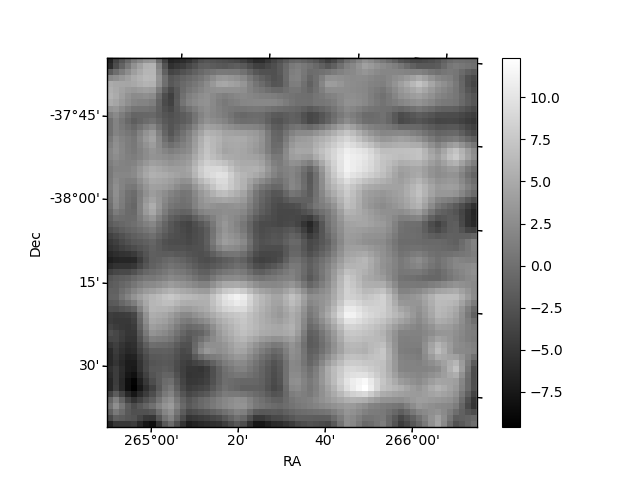
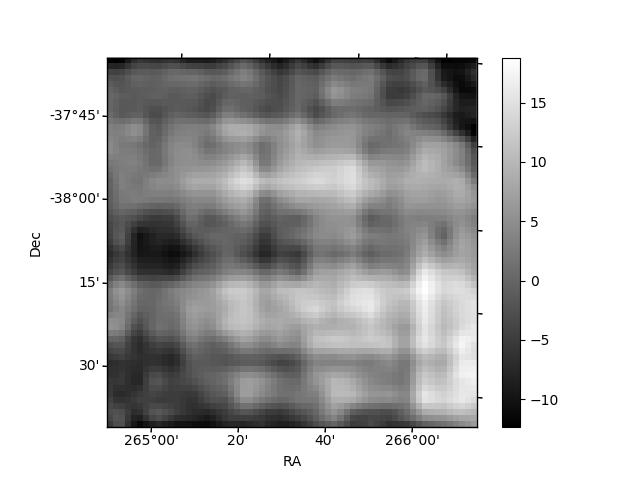
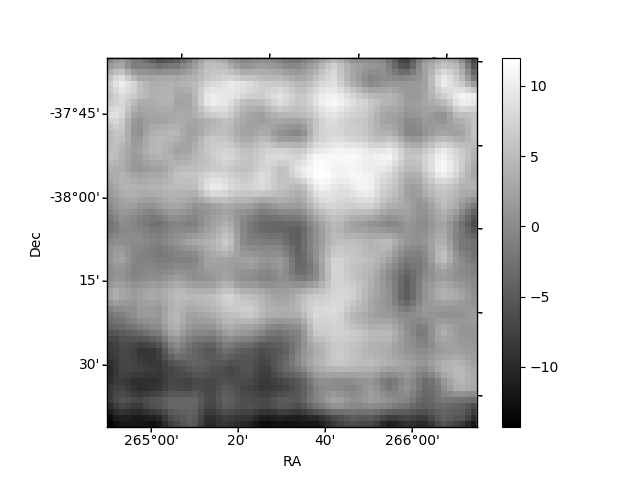
Histogram calculated using DETX and DETY for each event in the final _common_clean file
| Quadrant A | 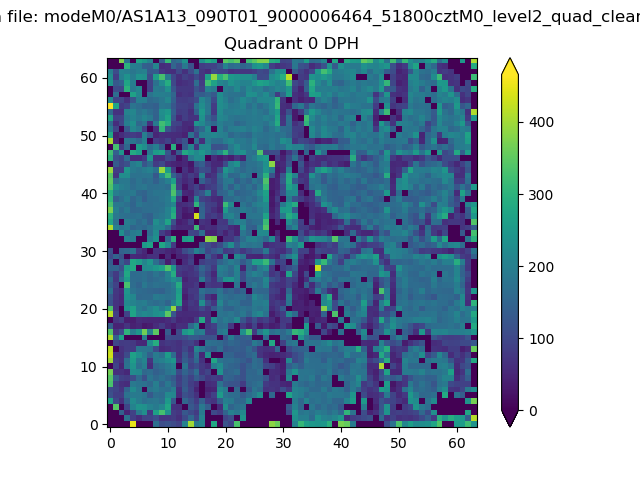 |
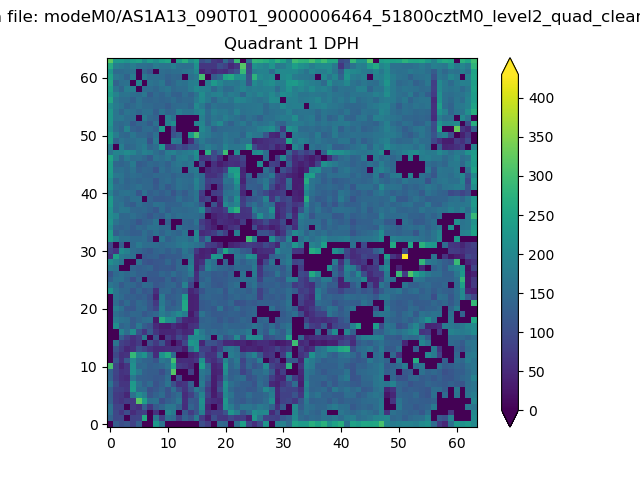 |
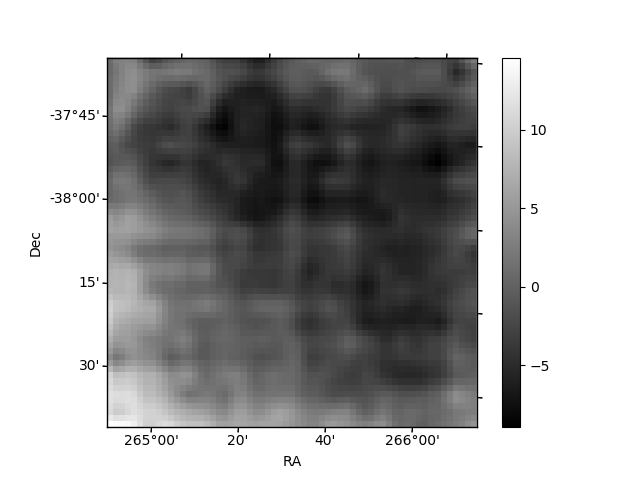
Quadrant B |
|---|---|---|---|
| Quadrant D | 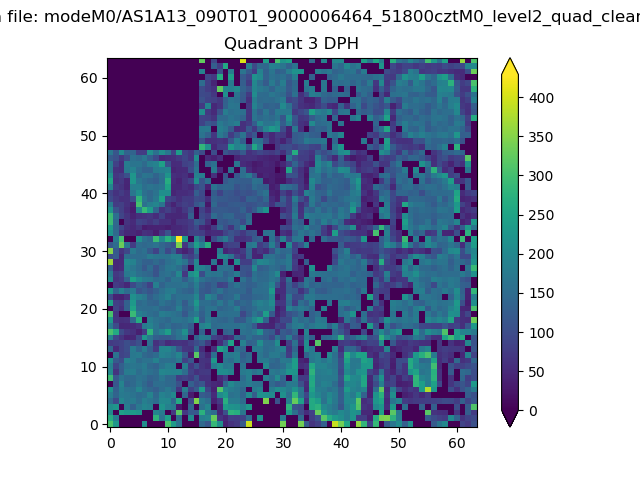 |
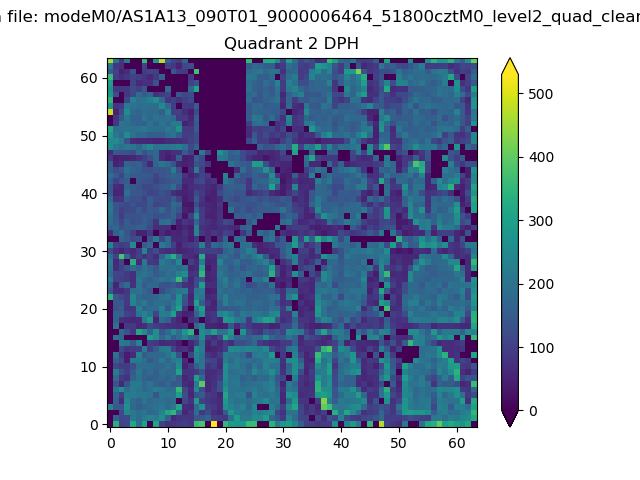 |
Quadrant C |
| Plot type | Count rate plots | Images |
|---|---|---|
| Comparison with Poisson distribution Blue bars denote a histogram of data divided into 1 sec bins. Red curve is a Poisson curve with rate = median count rate of data. |
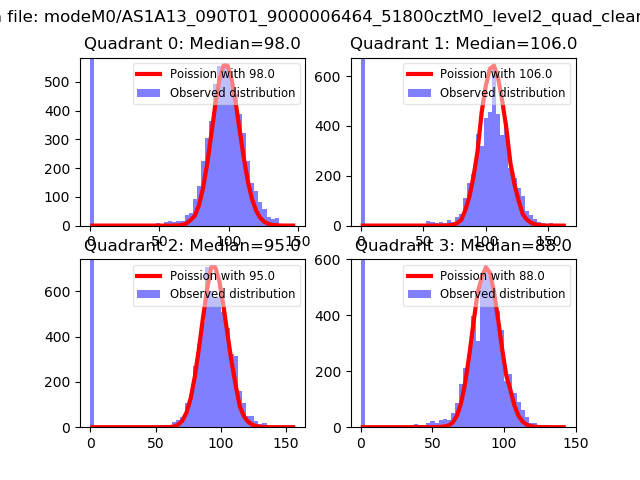 |
 |
| Quadrant-wise count rates Data is divided into 100 sec bins |
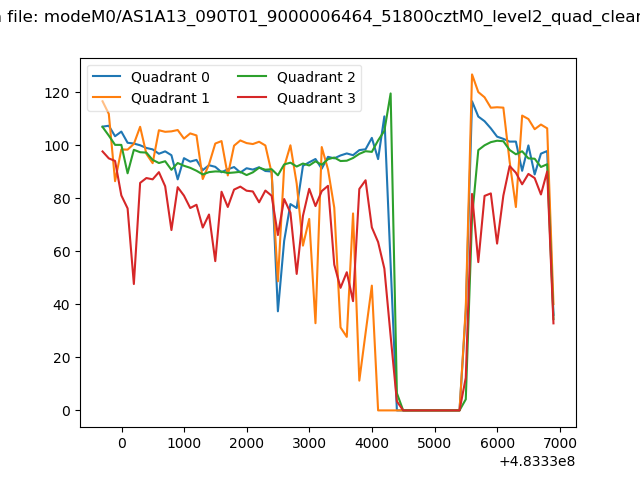 |
|
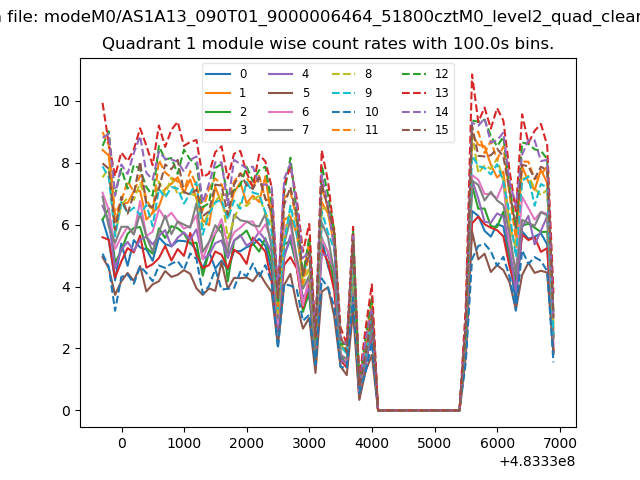
| Module-wise count rates for Quadrant A Data is divided into 100 sec bins |
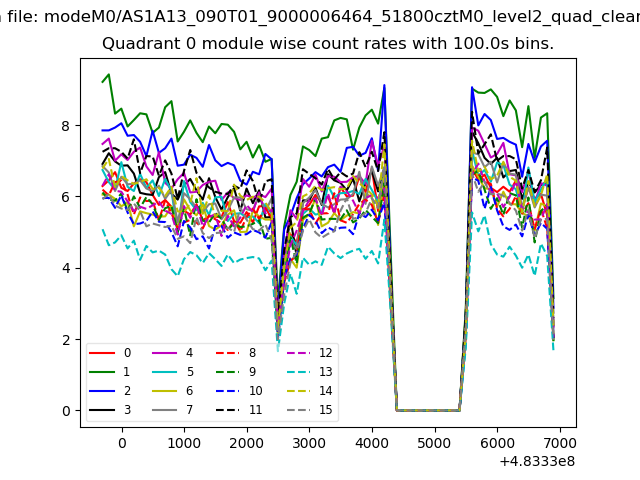 |
 |
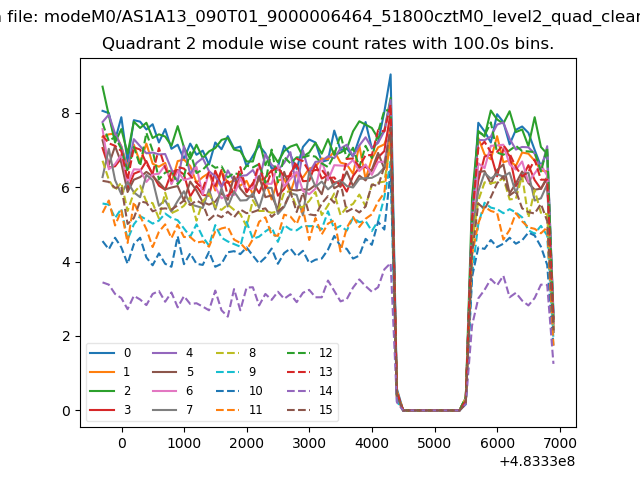
| Module-wise count rates for Quadrant B Data is divided into 100 sec bins |
 |
 |
| Module-wise count rates for Quadrant C Data is divided into 100 sec bins |
 |
 |
| Module-wise count rates for Quadrant D Data is divided into 100 sec bins |
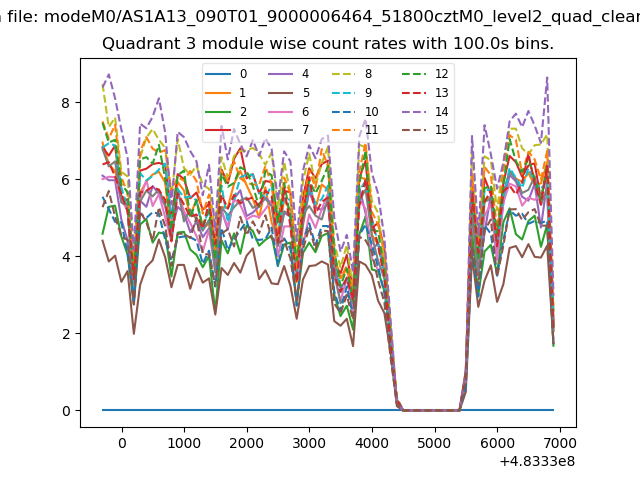 |
 |
| Parameter | Plot |
|---|---|
| CZT HV Monitor | 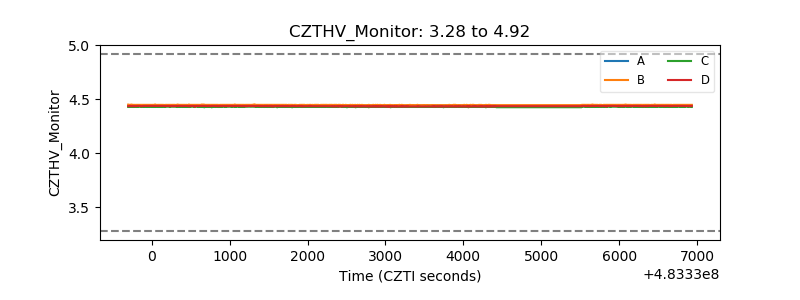 |
| D_VDD | 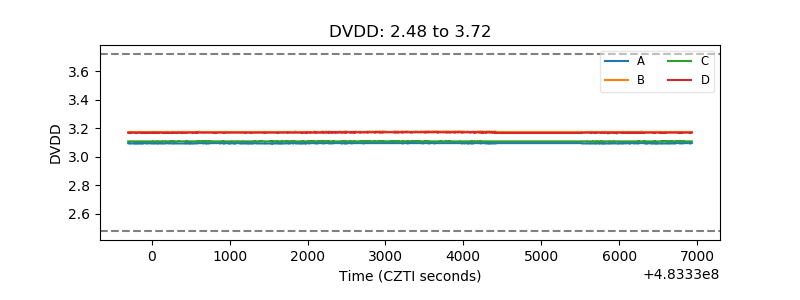 |
| Temperature 1 | 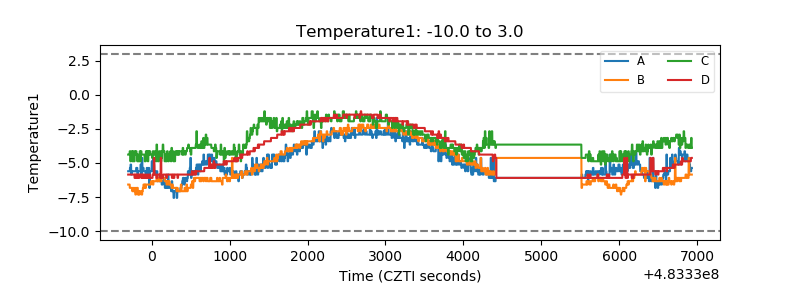 |
| Veto HV Monitor | 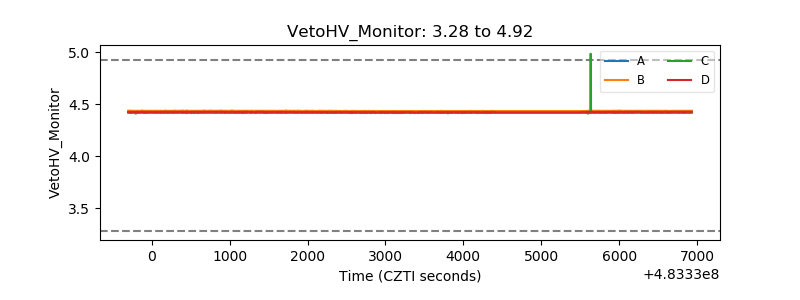 |
| Veto LLD | 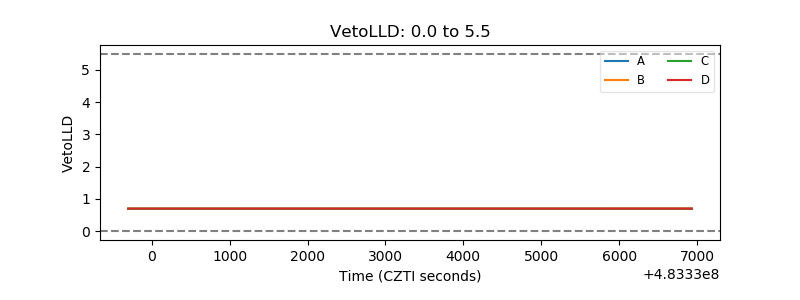 |
| Alpha Counter | 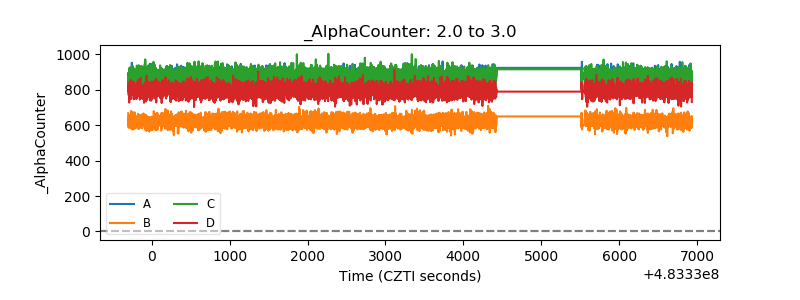 |
| _CPM_Rate | 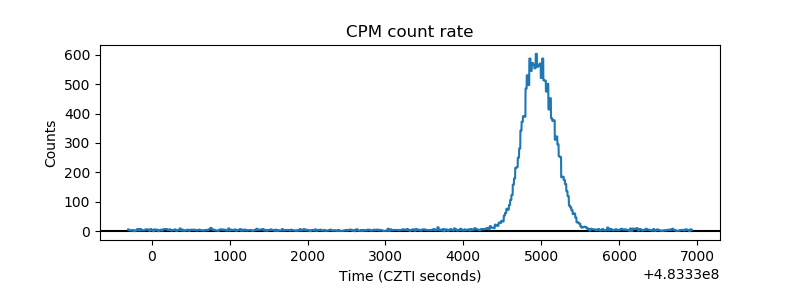 |
| CZT Counter | 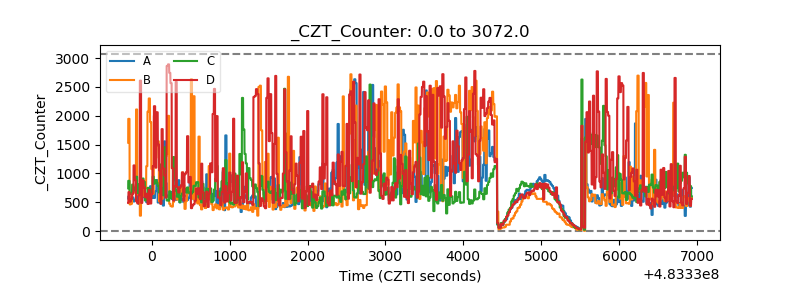 |
| +2.5 Volts monitor | 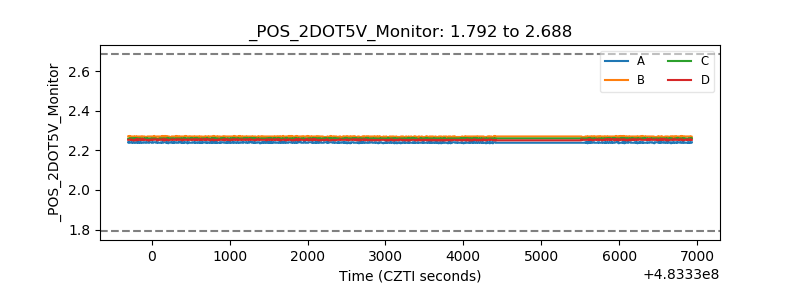 |
| +5 Volts monitor | 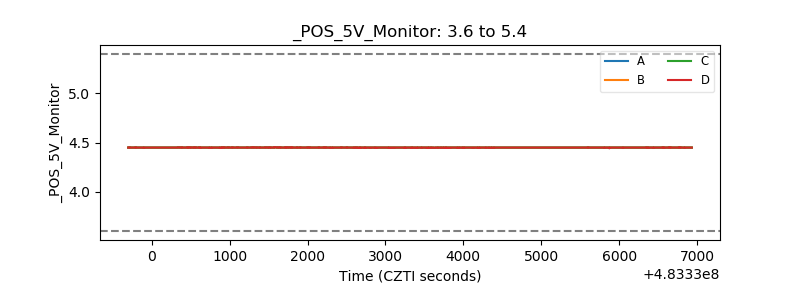 |
| _ROLL_ROT | 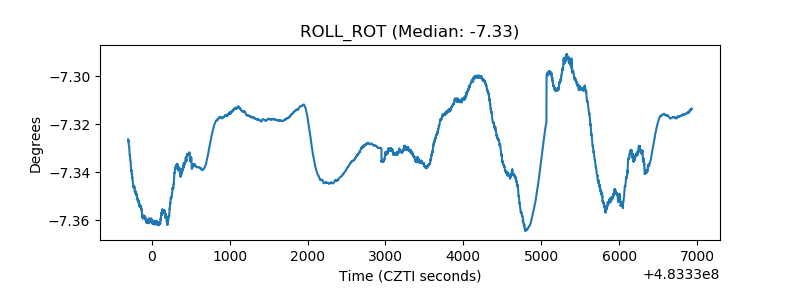 |
| _Roll_DEC | 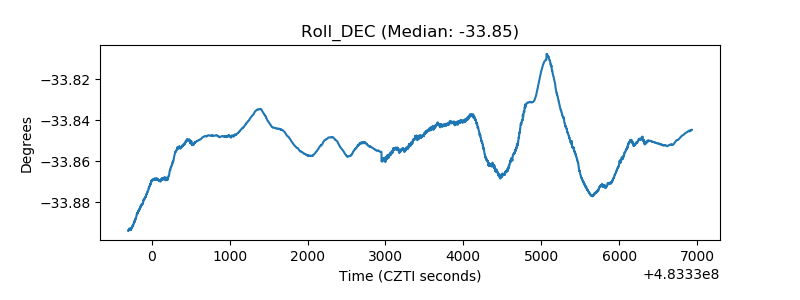 |
| _Roll_RA | 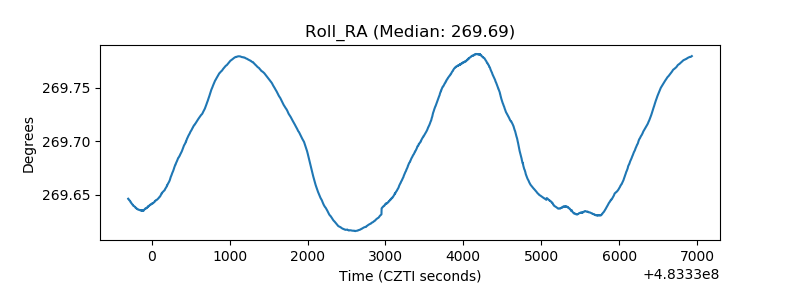 |
| Veto Counter | 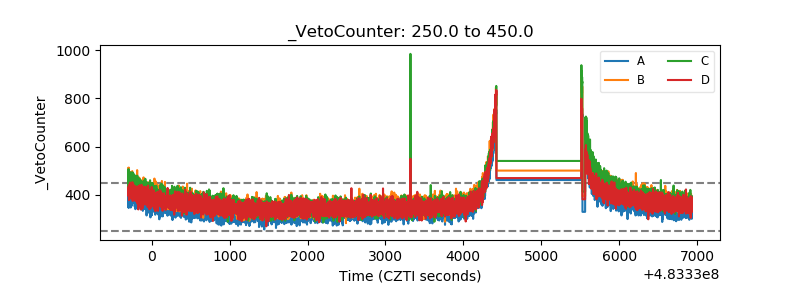 |