| Param | Original file | Final file |
|---|---|---|
| Filename | modeM0/AS1A13_090T01_9000006464_51801cztM0_level2.fits | modeM0/AS1A13_090T01_9000006464_51801cztM0_level2_quad_clean.evt |
| Size (bytes) | 710,861,760 | 89,913,600 |
| Size | 677.9 MB | 85.7 MB |
| Events in quadrant A | 5,744,192 | 610,359 |
| Events in quadrant B | 6,704,497 | 589,404 |
| Events in quadrant C | 5,085,655 | 596,928 |
| Events in quadrant D | 8,278,437 | 473,228 |
| Mode M9 | |||
|---|---|---|---|
| Quadrant | BADHDUFLAG | Total packets | Discarded packets |
| A | 0 | 11 | 0 |
| B | 0 | 11 | 0 |
| C | 0 | 11 | 0 |
| D | 0 | 11 | 0 |
| Mode SS | |||
|---|---|---|---|
| Quadrant | BADHDUFLAG | Total packets | Discarded packets |
| A | 0 | 132 | 0 |
| B | 0 | 132 | 0 |
| C | 0 | 132 | 0 |
| D | 0 | 132 | 0 |
| Mode M0 | |||
|---|---|---|---|
| Quadrant | BADHDUFLAG | Total packets | Discarded packets |
| A | 0 | 21542 | 2 |
| B | 0 | 24396 | 2 |
| C | 0 | 19625 | 2 |
| D | 0 | 29105 | 2 |
| Quadrant | Total seconds | Saturated seconds | Saturation percentage |
|---|---|---|---|
| A | 6482 | 341 | 5.260722% |
| B | 6483 | 1206 | 18.602499% |
| C | 6483 | 264 | 4.072189% |
| D | 6483 | 1453 | 22.412463% |
Noise dominated data is calculated using 1-second bins in cleaned event files. If a bin has >2000 counts, and if more than 50% of those come from <1% of pixels, then it is considered to be noise-dominated and hence unusable.
| Quadrant | # 1 sec bins | Bins with >0 counts | Bins with >2000 counts | High rate bins dominated by noise | Noise dominated (total time) | Noise dominated (detector-on time) | Marked lightcurve |
|---|---|---|---|---|---|---|---|
| A | 7582 | 6482 | 252 | 252 | 3.32% | 3.89% |  |
| B | 7583 | 6483 | 949 | 949 | 12.51% | 14.64% |  |
| C | 7583 | 6483 | 112 | 112 | 1.48% | 1.73% | 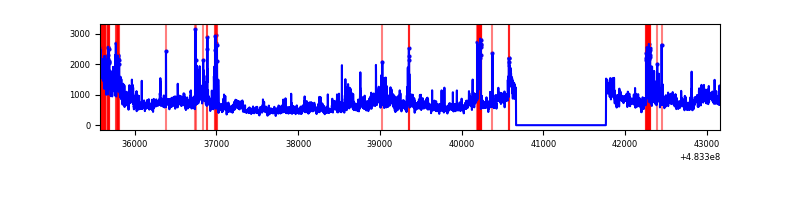 |
| D | 7583 | 6483 | 1441 | 1441 | 19.00% | 22.23% | 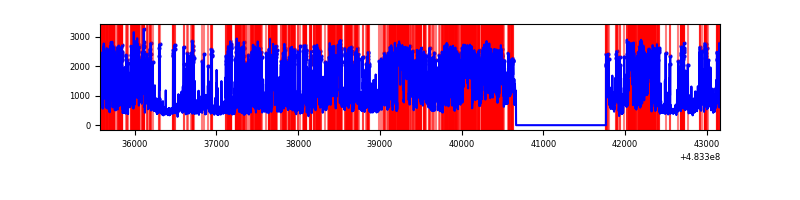 |
Top three noisy pixels from each quadrant. If the there are fewer than three noisy pixels in the level2.evt file, extra rows are filled as -1
| Pixel properties | Quadrant properties | ||||||
|---|---|---|---|---|---|---|---|
| Quadrant | DetID | PixID | Counts | Sigma | Mean | Median | Sigma |
| A | 12 | 3 | 1169519 | 6801.28 | 705 | 688 | 171.9 |
| A | 4 | 175 | 508895 | 2957.19 | 705 | 688 | 171.9 |
| A | 15 | 174 | 248231 | 1440.42 | 705 | 688 | 171.9 |
| B | 10 | 128 | 2300924 | 16277.0 | 655 | 630 | 141.3 |
| B | 12 | 32 | 907969 | 6420.38 | 655 | 630 | 141.3 |
| B | 10 | 44 | 187448 | 1321.93 | 655 | 630 | 141.3 |
| C | 10 | 22 | 1108453 | 5826.53 | 697 | 690 | 190.1 |
| C | 5 | 250 | 518201 | 2721.97 | 697 | 690 | 190.1 |
| C | 13 | 3 | 178792 | 936.77 | 697 | 690 | 190.1 |
| D | 11 | 129 | 4317625 | 24413.51 | 636 | 614 | 176.8 |
| D | 8 | 176 | 481296 | 2718.35 | 636 | 614 | 176.8 |
| D | 12 | 6 | 210652 | 1187.8 | 636 | 614 | 176.8 |
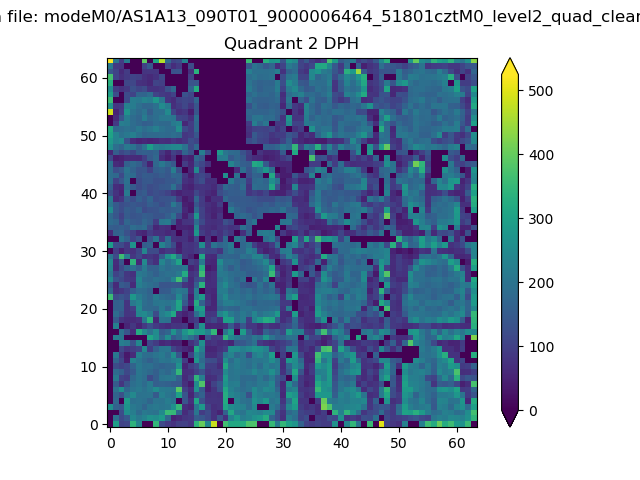
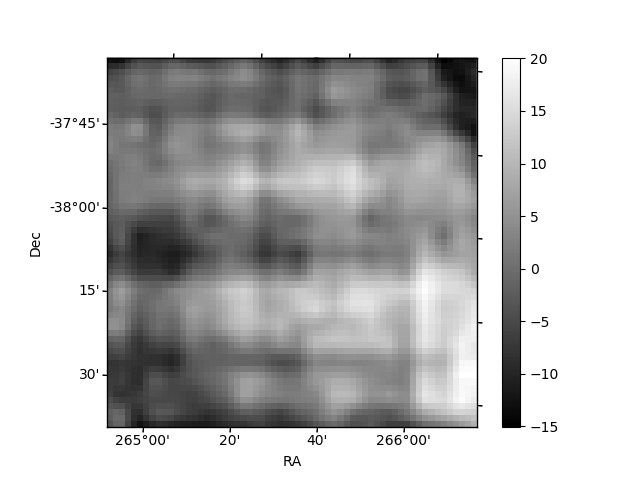
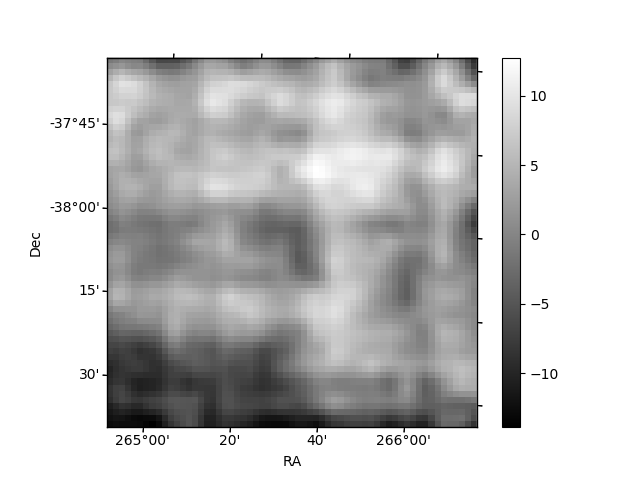
Histogram calculated using DETX and DETY for each event in the final _common_clean file
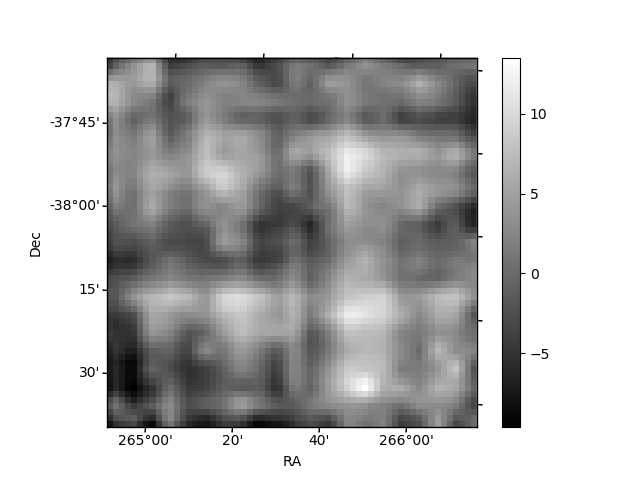
| Quadrant A | 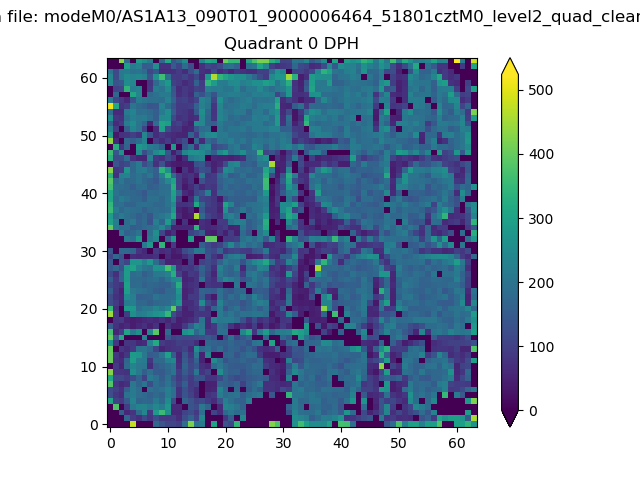 |
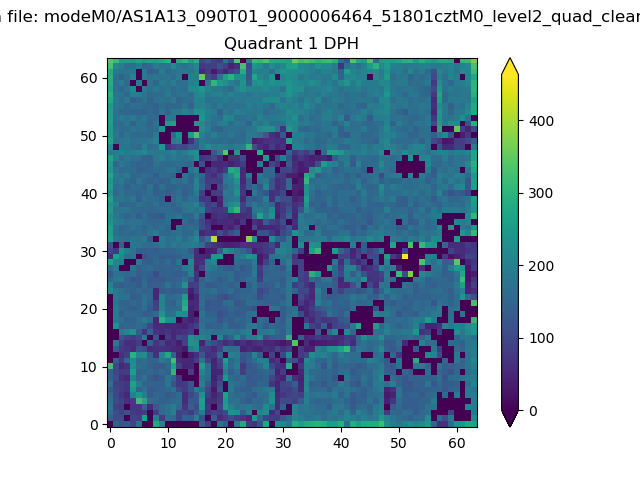 |
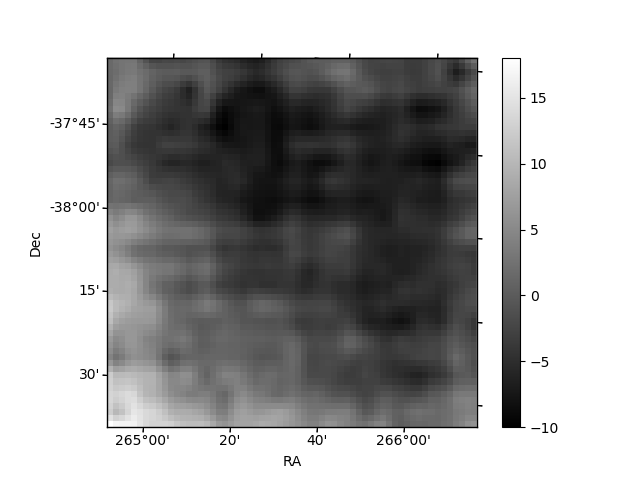
Quadrant B |
|---|---|---|---|
| Quadrant D |  |
 |
Quadrant C |
| Plot type | Count rate plots | Images |
|---|---|---|
| Comparison with Poisson distribution Blue bars denote a histogram of data divided into 1 sec bins. Red curve is a Poisson curve with rate = median count rate of data. |
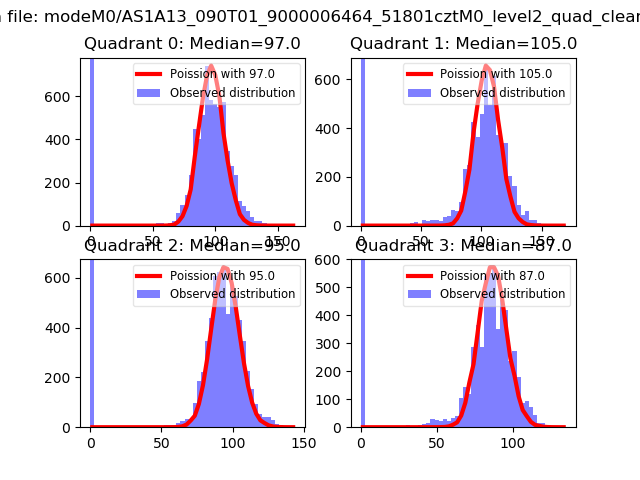 |
 |
| Quadrant-wise count rates Data is divided into 100 sec bins |
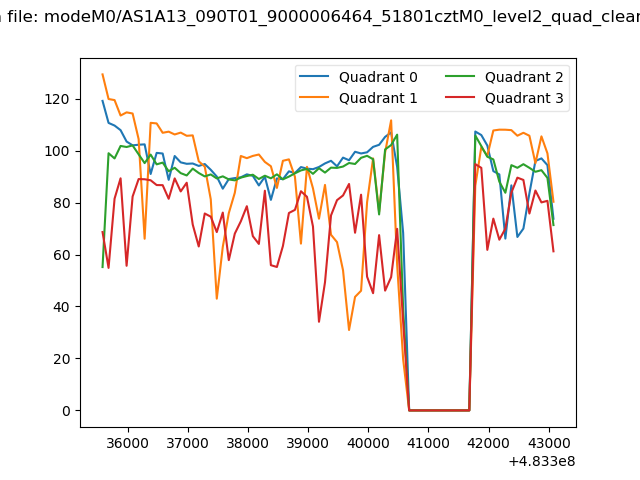 |
|
| Module-wise count rates for Quadrant A Data is divided into 100 sec bins |
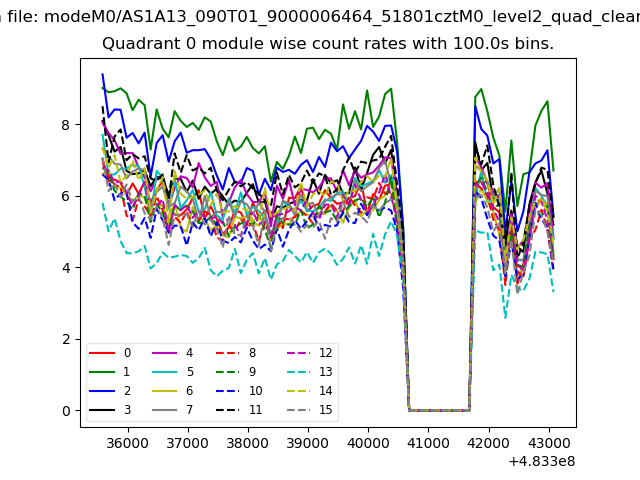 |
 |
| Module-wise count rates for Quadrant B Data is divided into 100 sec bins |
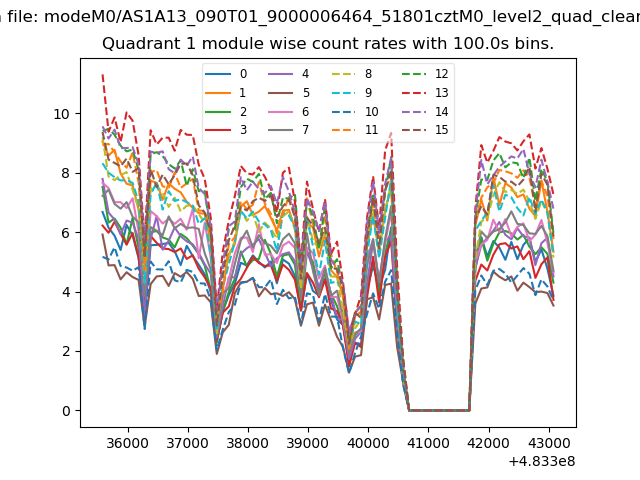 |
 |
| Module-wise count rates for Quadrant C Data is divided into 100 sec bins |
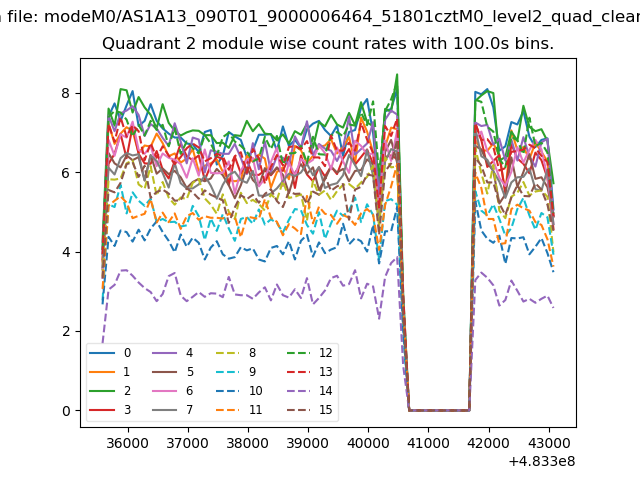 |
 |
| Module-wise count rates for Quadrant D Data is divided into 100 sec bins |
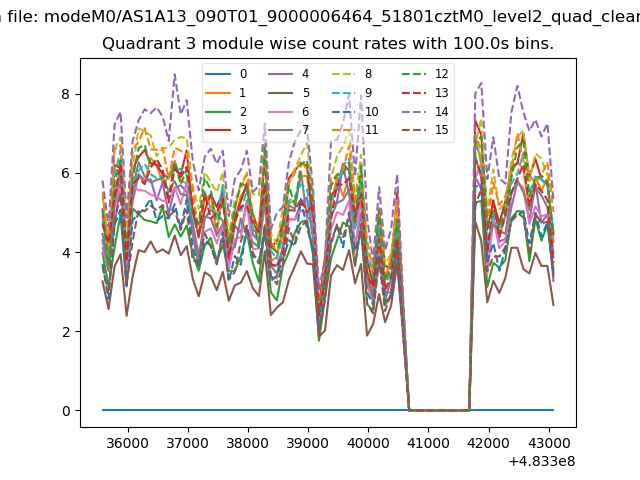 |
 |
| Parameter | Plot |
|---|---|
| CZT HV Monitor | 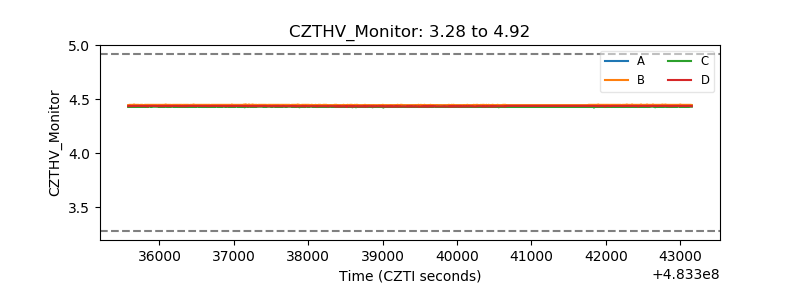 |
| D_VDD | 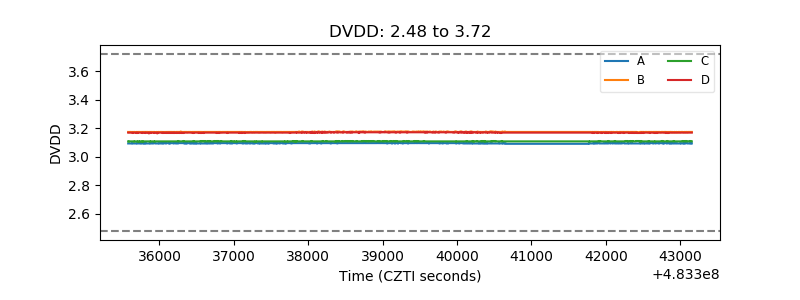 |
| Temperature 1 | 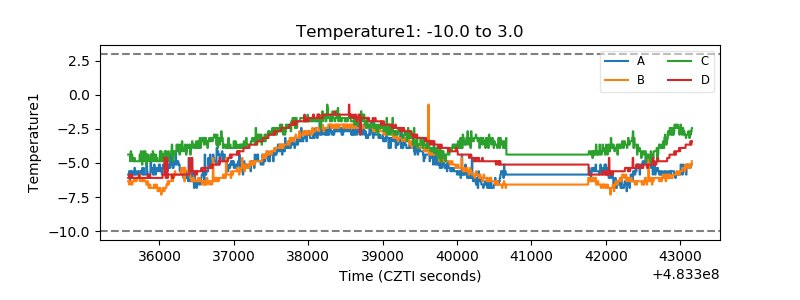 |
| Veto HV Monitor | 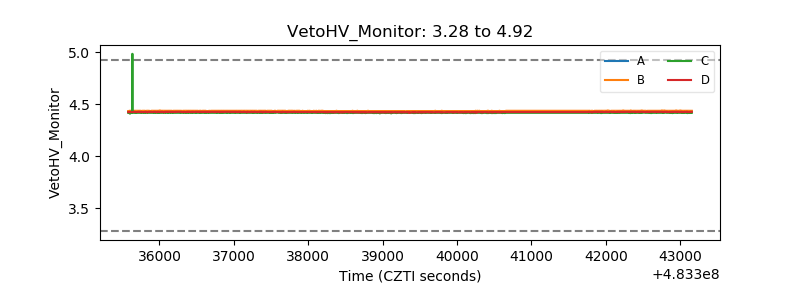 |
| Veto LLD | 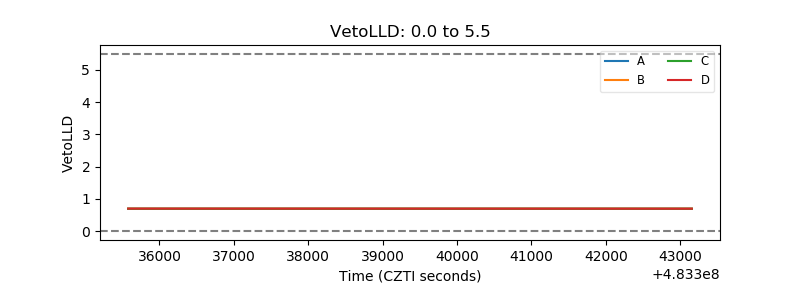 |
| Alpha Counter | 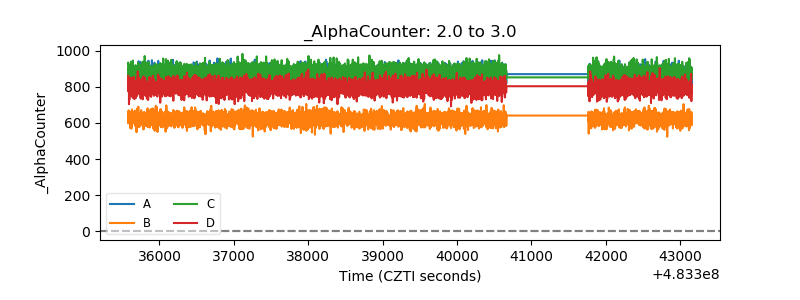 |
| _CPM_Rate | 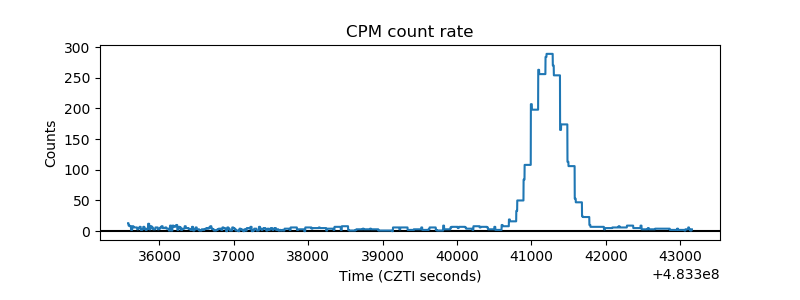 |
| CZT Counter | 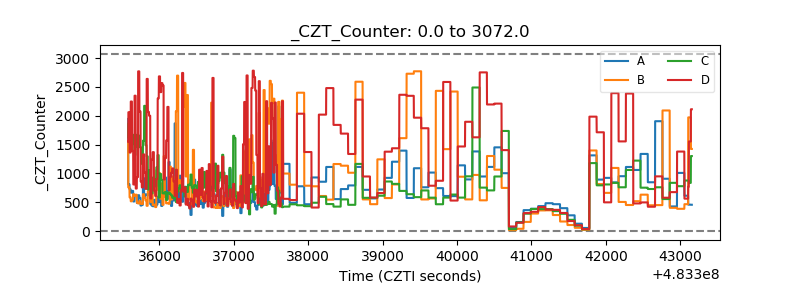 |
| +2.5 Volts monitor | 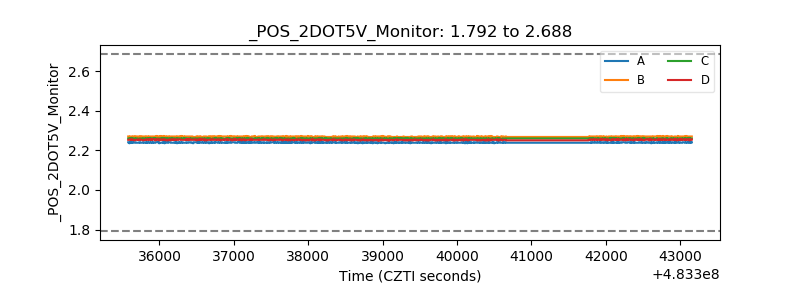 |
| +5 Volts monitor | 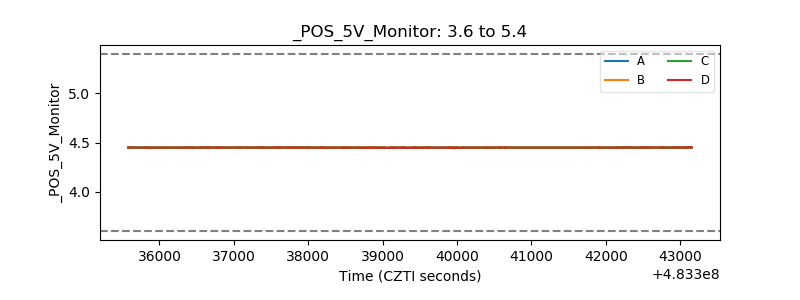 |
| _ROLL_ROT | 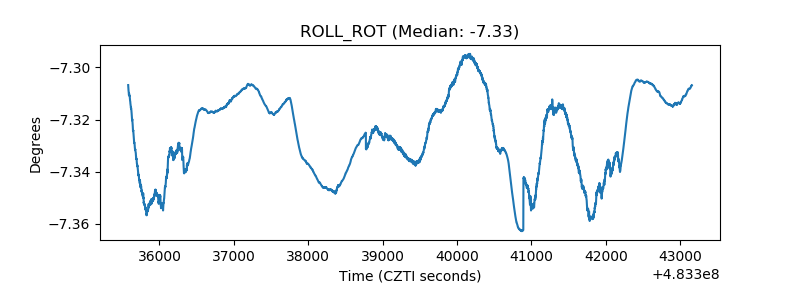 |
| _Roll_DEC | 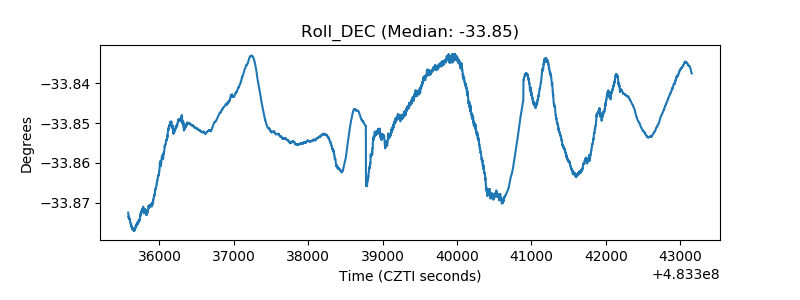 |
| _Roll_RA | 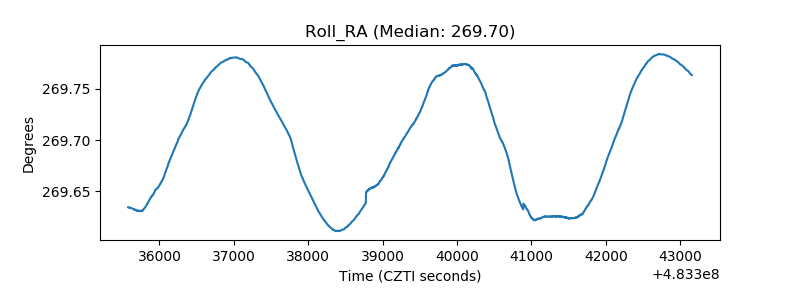 |
| Veto Counter | 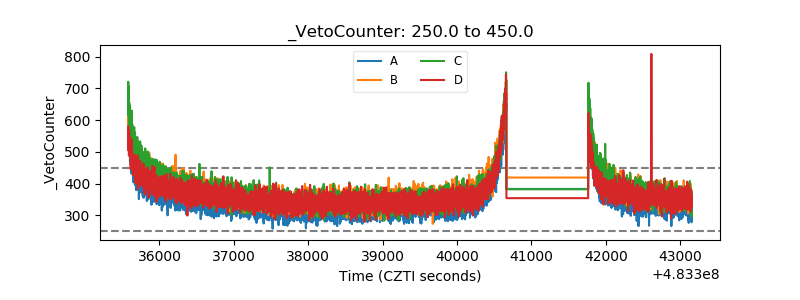 |