| Param | Original file | Final file |
|---|---|---|
| Filename | modeM0/AS1A13_090T01_9000006464_51802cztM0_level2.fits | modeM0/AS1A13_090T01_9000006464_51802cztM0_level2_quad_clean.evt |
| Size (bytes) | 741,381,120 | 92,249,280 |
| Size | 707.0 MB | 88.0 MB |
| Events in quadrant A | 7,429,423 | 603,695 |
| Events in quadrant B | 5,732,027 | 634,652 |
| Events in quadrant C | 5,363,238 | 606,670 |
| Events in quadrant D | 8,397,975 | 477,960 |
| Mode M9 | |||
|---|---|---|---|
| Quadrant | BADHDUFLAG | Total packets | Discarded packets |
| A | 0 | 13 | 0 |
| B | 0 | 14 | 0 |
| C | 0 | 14 | 0 |
| D | 0 | 14 | 0 |
| Mode SS | |||
|---|---|---|---|
| Quadrant | BADHDUFLAG | Total packets | Discarded packets |
| A | 0 | 136 | 0 |
| B | 0 | 136 | 0 |
| C | 0 | 136 | 0 |
| D | 0 | 136 | 0 |
| Mode M0 | |||
|---|---|---|---|
| Quadrant | BADHDUFLAG | Total packets | Discarded packets |
| A | 0 | 26873 | 2 |
| B | 0 | 21618 | 2 |
| C | 0 | 20822 | 2 |
| D | 0 | 29675 | 2 |
| Quadrant | Total seconds | Saturated seconds | Saturation percentage |
|---|---|---|---|
| A | 6745 | 516 | 7.650111% |
| B | 6745 | 838 | 12.424018% |
| C | 6745 | 261 | 3.869533% |
| D | 6745 | 1576 | 23.365456% |
Noise dominated data is calculated using 1-second bins in cleaned event files. If a bin has >2000 counts, and if more than 50% of those come from <1% of pixels, then it is considered to be noise-dominated and hence unusable.
| Quadrant | # 1 sec bins | Bins with >0 counts | Bins with >2000 counts | High rate bins dominated by noise | Noise dominated (total time) | Noise dominated (detector-on time) | Marked lightcurve |
|---|---|---|---|---|---|---|---|
| A | 7574 | 6744 | 303 | 303 | 4.00% | 4.49% | 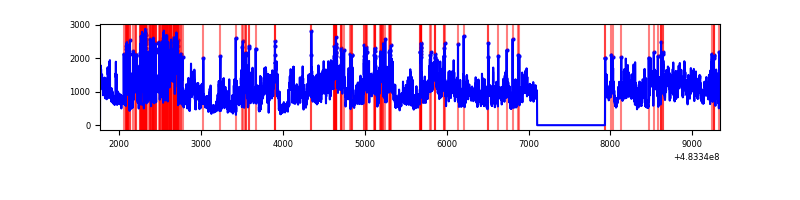 |
| B | 7574 | 6744 | 612 | 612 | 8.08% | 9.07% | 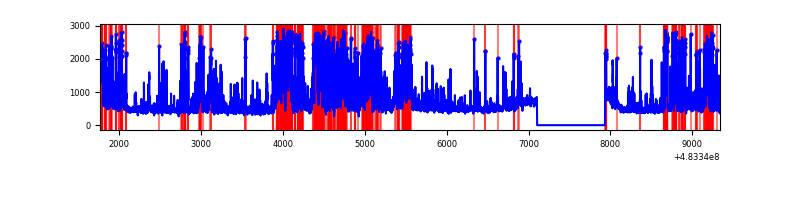 |
| C | 7574 | 6744 | 59 | 59 | 0.78% | 0.87% | 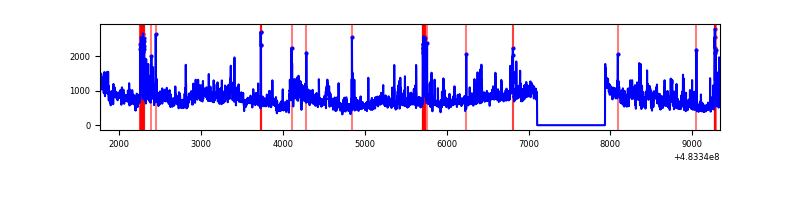 |
| D | 7574 | 6744 | 1489 | 1489 | 19.66% | 22.08% | 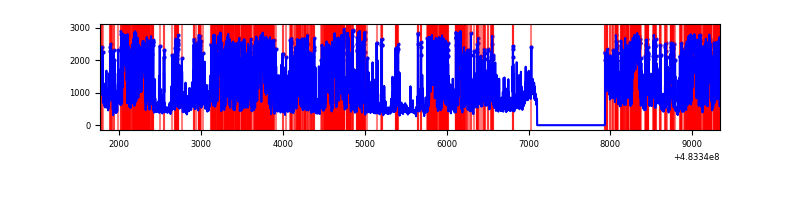 |
Top three noisy pixels from each quadrant. If the there are fewer than three noisy pixels in the level2.evt file, extra rows are filled as -1
| Pixel properties | Quadrant properties | ||||||
|---|---|---|---|---|---|---|---|
| Quadrant | DetID | PixID | Counts | Sigma | Mean | Median | Sigma |
| A | 12 | 3 | 2173562 | 12107.0 | 731 | 712 | 179.5 |
| A | 4 | 175 | 683233 | 3802.97 | 731 | 712 | 179.5 |
| A | 3 | 14 | 550423 | 3062.96 | 731 | 712 | 179.5 |
| B | 10 | 128 | 2204582 | 14467.09 | 711 | 684 | 152.3 |
| B | 4 | 206 | 93918 | 612.02 | 711 | 684 | 152.3 |
| B | 1 | 223 | 86145 | 560.99 | 711 | 684 | 152.3 |
| C | 10 | 22 | 1651360 | 8249.6 | 729 | 719 | 200.1 |
| C | 13 | 3 | 175603 | 874.04 | 729 | 719 | 200.1 |
| C | 5 | 250 | 128952 | 640.89 | 729 | 719 | 200.1 |
| D | 11 | 129 | 4444526 | 24140.55 | 666 | 642 | 184.1 |
| D | 3 | 12 | 336696 | 1825.55 | 666 | 642 | 184.1 |
| D | 8 | 176 | 227870 | 1234.37 | 666 | 642 | 184.1 |
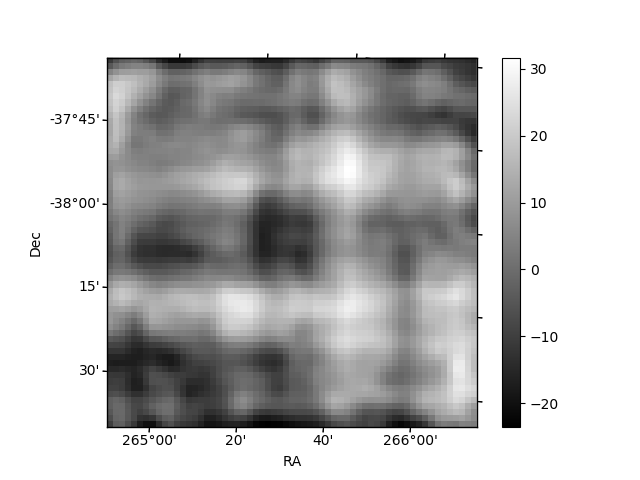
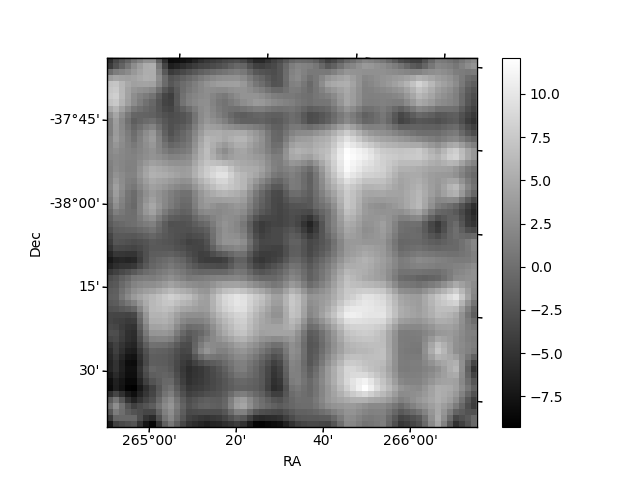
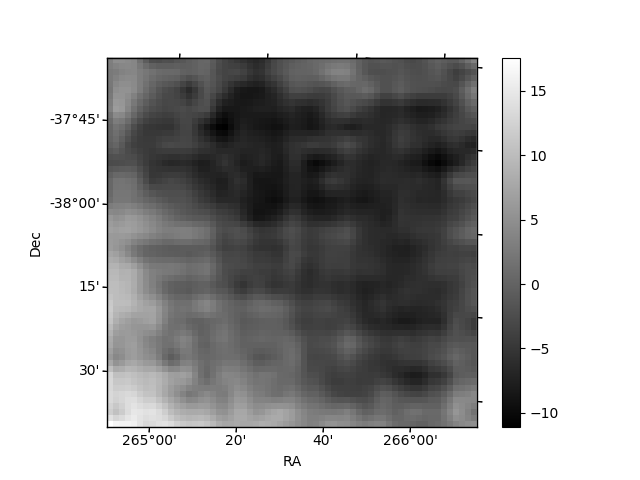
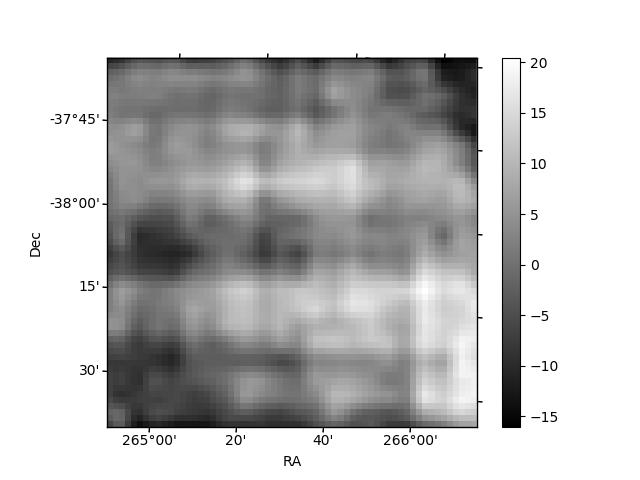
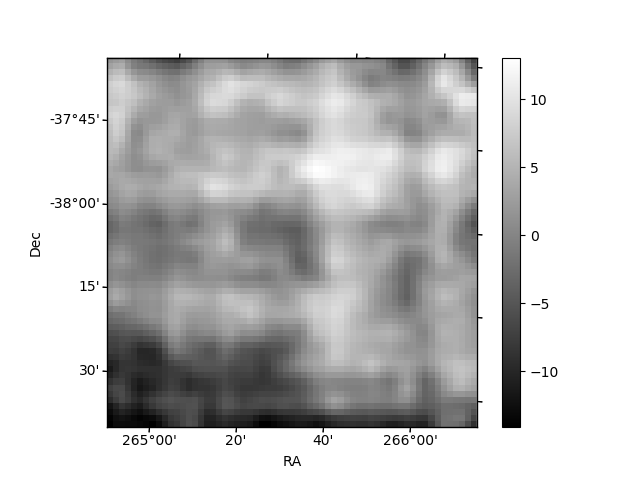
Histogram calculated using DETX and DETY for each event in the final _common_clean file
| Quadrant A | 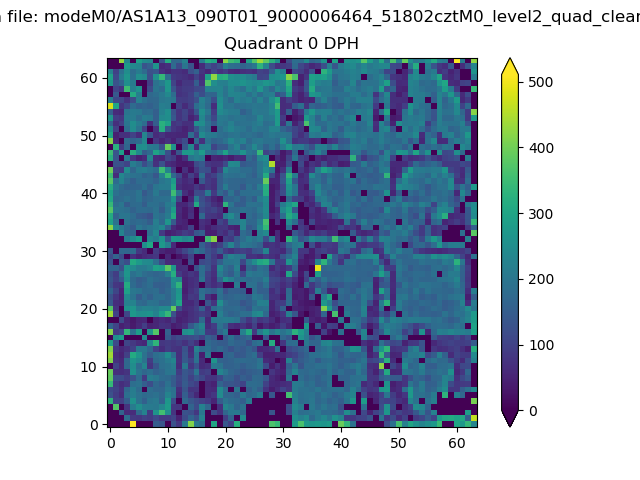 |
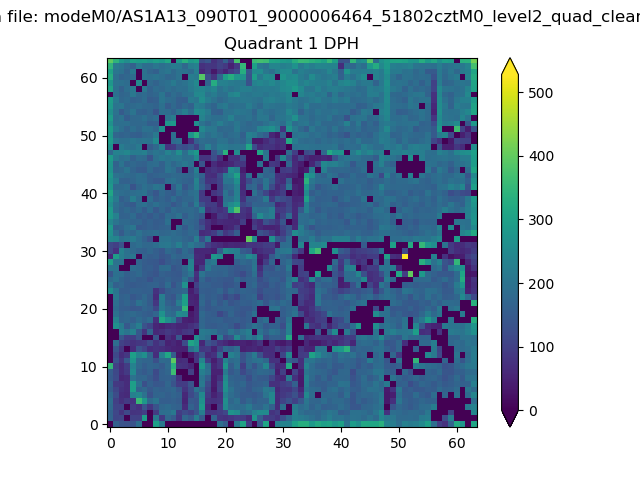 |
Quadrant B |
|---|---|---|---|
| Quadrant D | 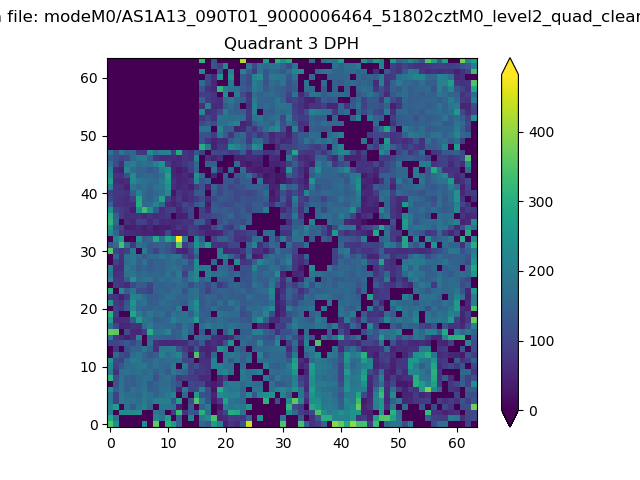 |
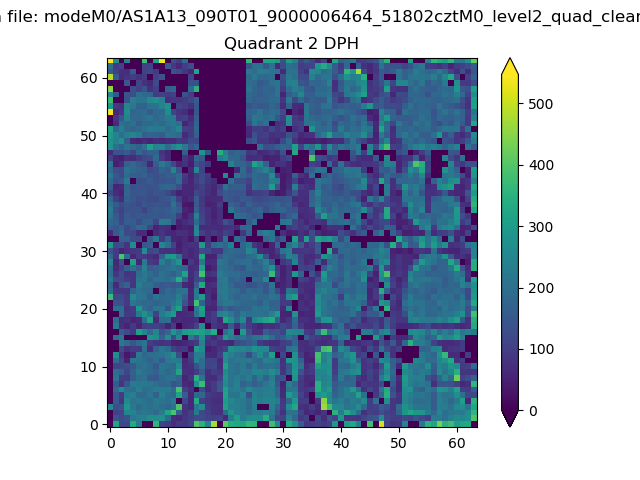 |
Quadrant C |
| Plot type | Count rate plots | Images |
|---|---|---|
| Comparison with Poisson distribution Blue bars denote a histogram of data divided into 1 sec bins. Red curve is a Poisson curve with rate = median count rate of data. |
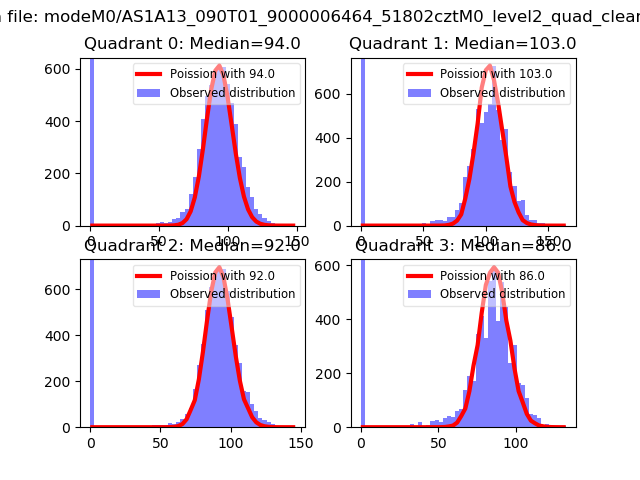 |
 |
| Quadrant-wise count rates Data is divided into 100 sec bins |
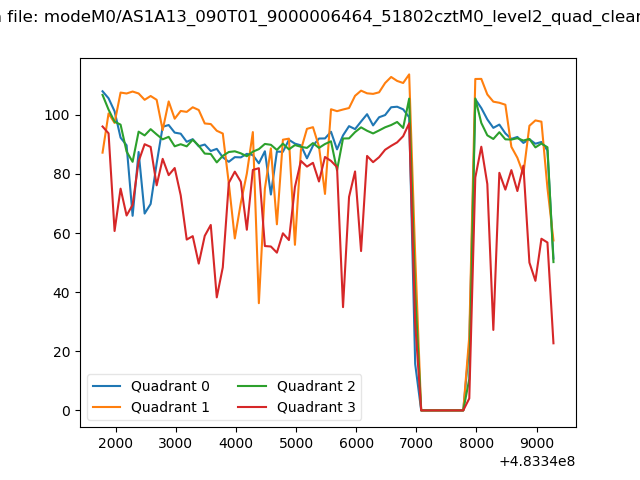 |
|
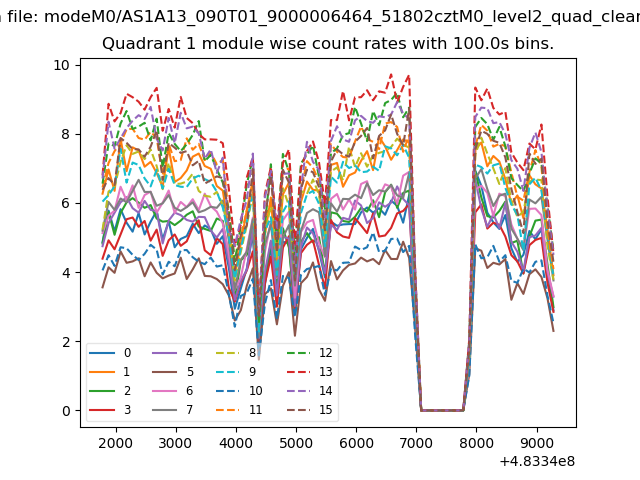
| Module-wise count rates for Quadrant A Data is divided into 100 sec bins |
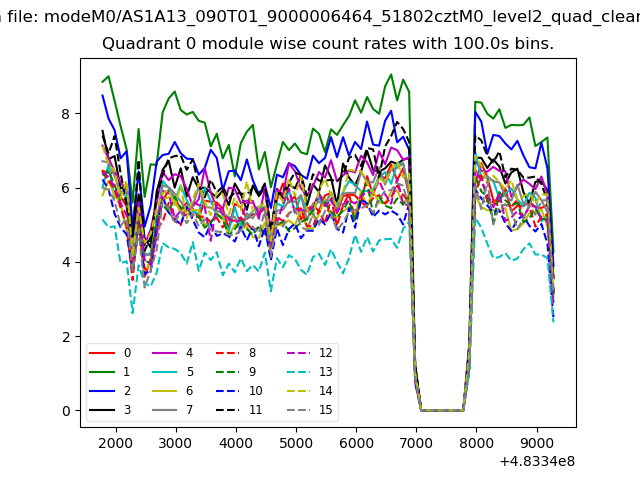 |
 |
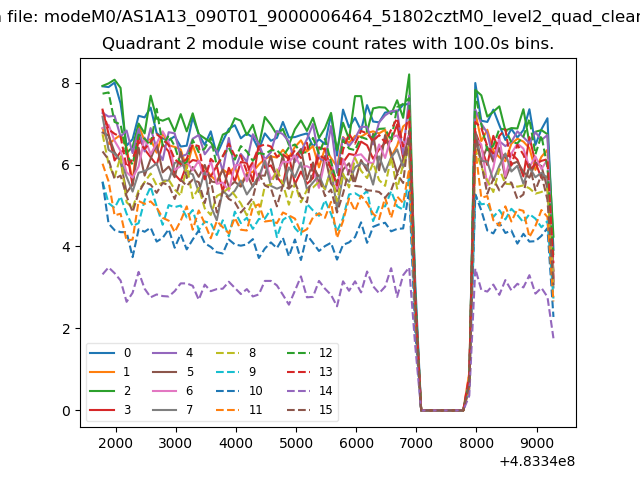
| Module-wise count rates for Quadrant B Data is divided into 100 sec bins |
 |
 |
| Module-wise count rates for Quadrant C Data is divided into 100 sec bins |
 |
 |
| Module-wise count rates for Quadrant D Data is divided into 100 sec bins |
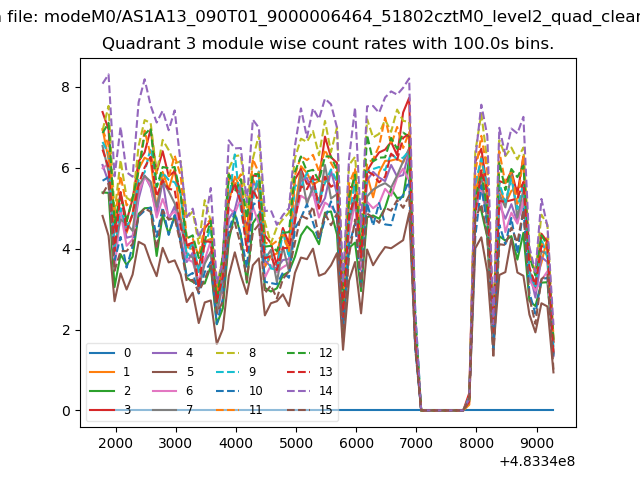 |
 |
| Parameter | Plot |
|---|---|
| CZT HV Monitor | 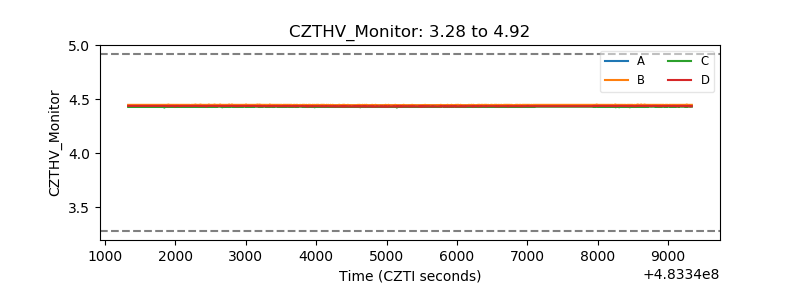 |
| D_VDD | 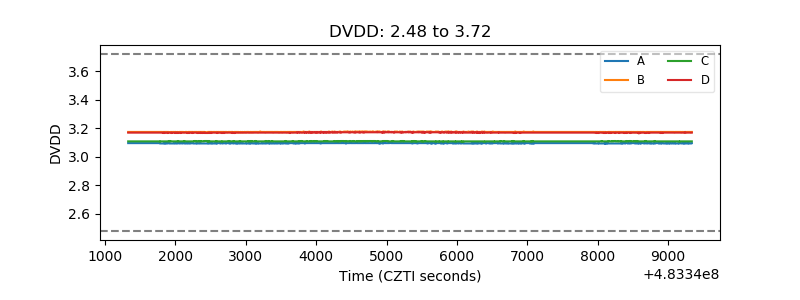 |
| Temperature 1 | 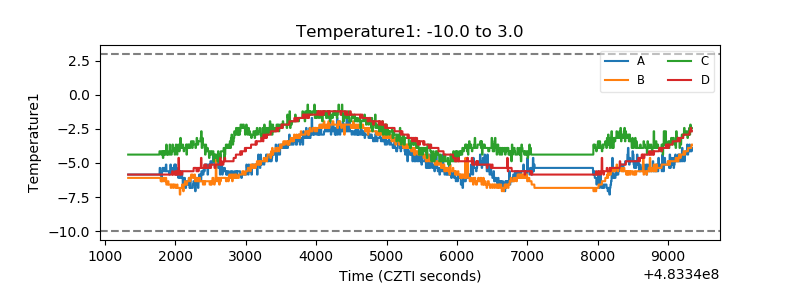 |
| Veto HV Monitor |  |
| Veto LLD | 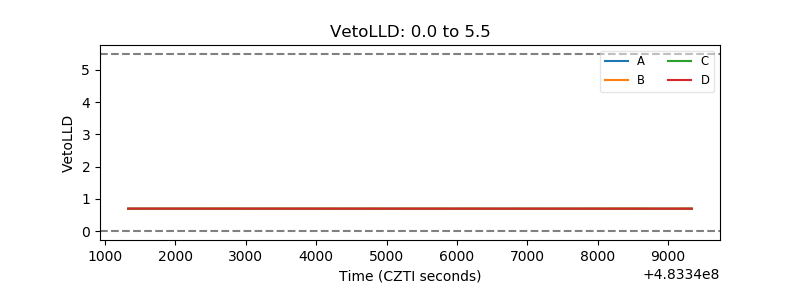 |
| Alpha Counter | 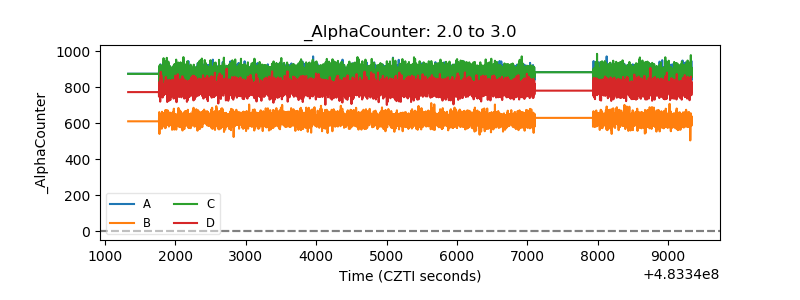 |
| _CPM_Rate | 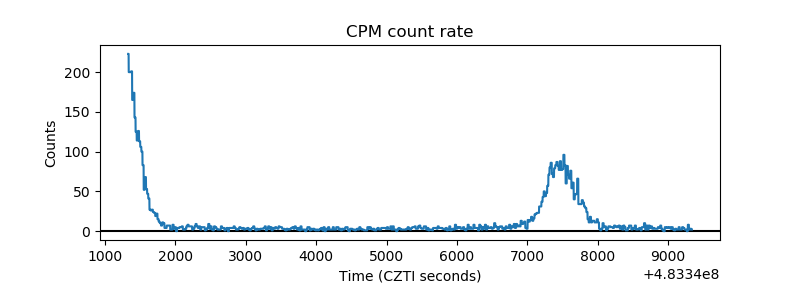 |
| CZT Counter | 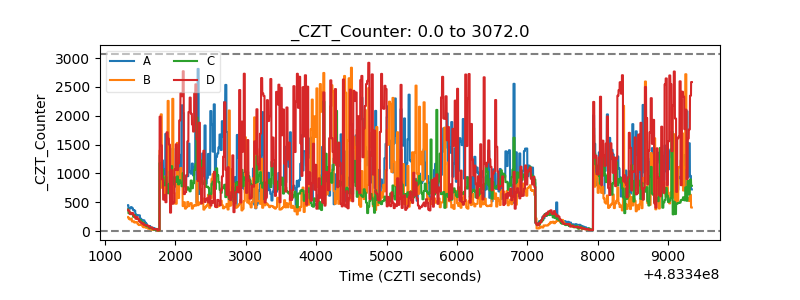 |
| +2.5 Volts monitor | 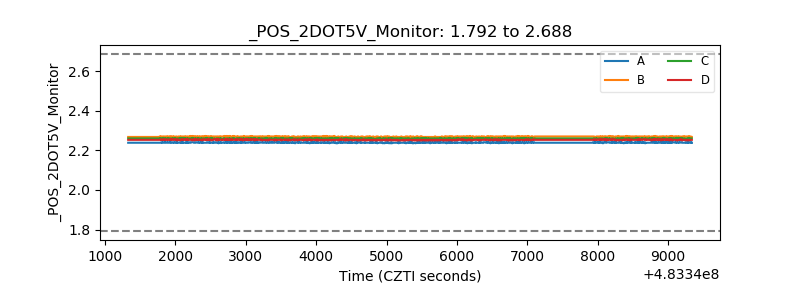 |
| +5 Volts monitor | 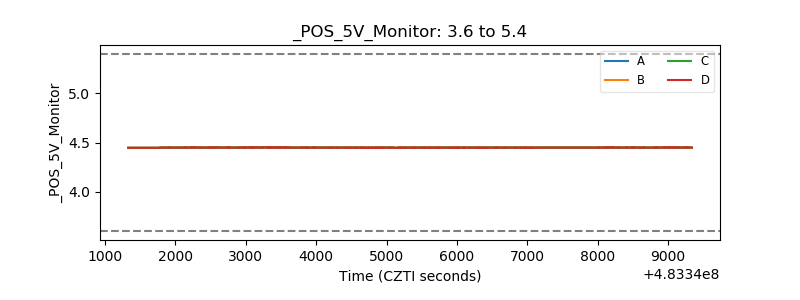 |
| _ROLL_ROT | 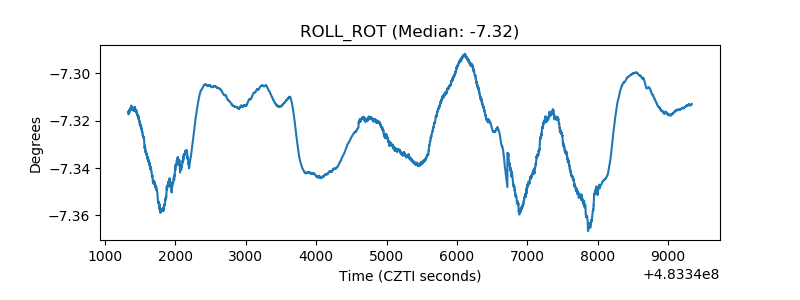 |
| _Roll_DEC | 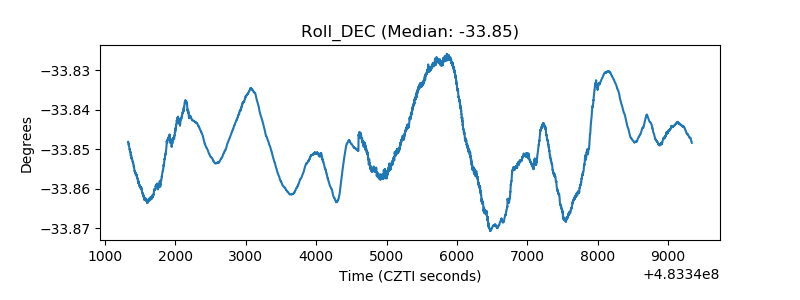 |
| _Roll_RA | 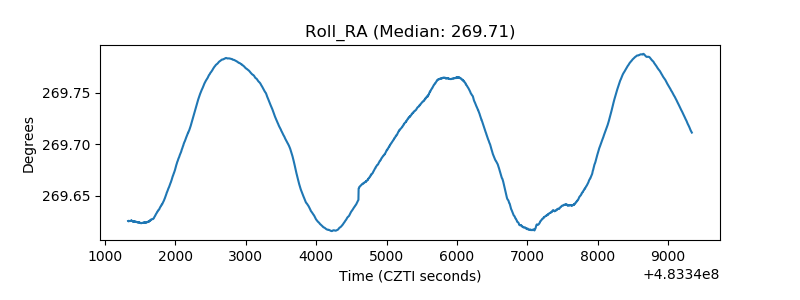 |
| Veto Counter | 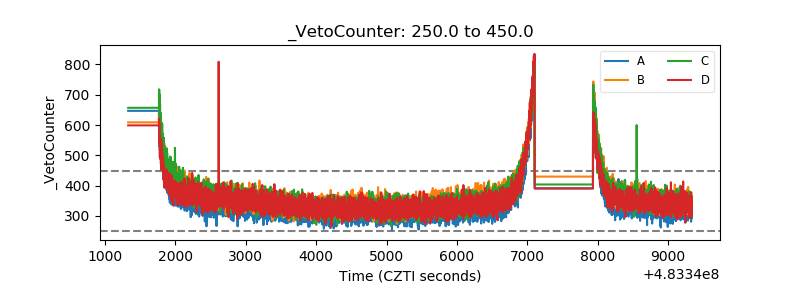 |