| Param | Original file | Final file |
|---|---|---|
| Filename | modeM0/AS1A13_090T01_9000006464_51803cztM0_level2.fits | modeM0/AS1A13_090T01_9000006464_51803cztM0_level2_quad_clean.evt |
| Size (bytes) | 791,429,760 | 88,272,000 |
| Size | 754.8 MB | 84.2 MB |
| Events in quadrant A | 7,551,637 | 587,634 |
| Events in quadrant B | 6,612,515 | 625,252 |
| Events in quadrant C | 5,350,084 | 570,819 |
| Events in quadrant D | 9,244,811 | 405,319 |
| Mode M9 | |||
|---|---|---|---|
| Quadrant | BADHDUFLAG | Total packets | Discarded packets |
| A | 0 | 5 | 0 |
| B | 0 | 5 | 0 |
| C | 0 | 5 | 0 |
| D | 0 | 5 | 0 |
| Mode SS | |||
|---|---|---|---|
| Quadrant | BADHDUFLAG | Total packets | Discarded packets |
| A | 0 | 138 | 0 |
| B | 0 | 138 | 0 |
| C | 0 | 138 | 0 |
| D | 0 | 138 | 0 |
| Mode M0 | |||
|---|---|---|---|
| Quadrant | BADHDUFLAG | Total packets | Discarded packets |
| A | 0 | 27391 | 1 |
| B | 0 | 24476 | 1 |
| C | 0 | 20577 | 1 |
| D | 0 | 32226 | 1 |
| Quadrant | Total seconds | Saturated seconds | Saturation percentage |
|---|---|---|---|
| A | 6947 | 708 | 10.191450% |
| B | 6947 | 958 | 13.790125% |
| C | 6947 | 638 | 9.183820% |
| D | 6947 | 2338 | 33.654815% |
Noise dominated data is calculated using 1-second bins in cleaned event files. If a bin has >2000 counts, and if more than 50% of those come from <1% of pixels, then it is considered to be noise-dominated and hence unusable.
| Quadrant | # 1 sec bins | Bins with >0 counts | Bins with >2000 counts | High rate bins dominated by noise | Noise dominated (total time) | Noise dominated (detector-on time) | Marked lightcurve |
|---|---|---|---|---|---|---|---|
| A | 7362 | 6948 | 340 | 340 | 4.62% | 4.89% | 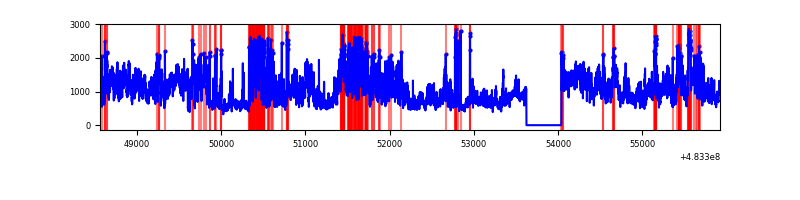 |
| B | 7362 | 6948 | 583 | 583 | 7.92% | 8.39% | 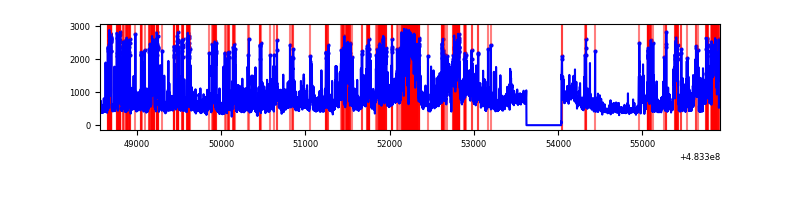 |
| C | 7362 | 6948 | 363 | 363 | 4.93% | 5.22% | 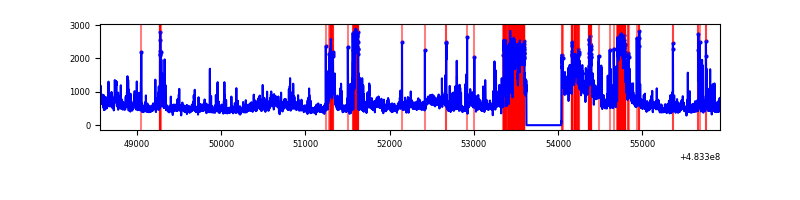 |
| D | 7361 | 6947 | 2016 | 2016 | 27.39% | 29.02% | 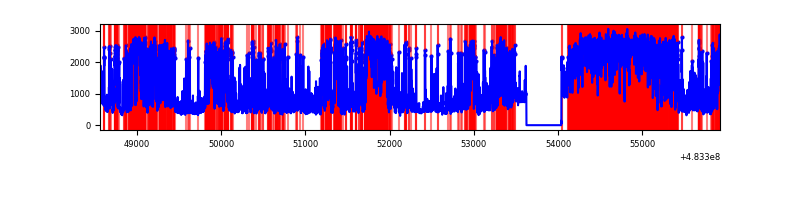 |
Top three noisy pixels from each quadrant. If the there are fewer than three noisy pixels in the level2.evt file, extra rows are filled as -1
| Pixel properties | Quadrant properties | ||||||
|---|---|---|---|---|---|---|---|
| Quadrant | DetID | PixID | Counts | Sigma | Mean | Median | Sigma |
| A | 12 | 3 | 2763440 | 15208.55 | 739 | 721 | 181.7 |
| A | 13 | 248 | 514358 | 2827.53 | 739 | 721 | 181.7 |
| A | 3 | 14 | 318019 | 1746.7 | 739 | 721 | 181.7 |
| B | 10 | 128 | 1488162 | 9428.16 | 729 | 703 | 157.8 |
| B | 10 | 44 | 968843 | 6136.49 | 729 | 703 | 157.8 |
| B | 4 | 206 | 213581 | 1349.31 | 729 | 703 | 157.8 |
| C | 10 | 22 | 819503 | 4224.43 | 708 | 703 | 193.8 |
| C | 13 | 3 | 550442 | 2836.27 | 708 | 703 | 193.8 |
| C | 15 | 218 | 545790 | 2812.26 | 708 | 703 | 193.8 |
| D | 11 | 129 | 5439320 | 32550.16 | 606 | 586 | 167.1 |
| D | 12 | 6 | 483777 | 2891.84 | 606 | 586 | 167.1 |
| D | 8 | 176 | 352773 | 2107.79 | 606 | 586 | 167.1 |
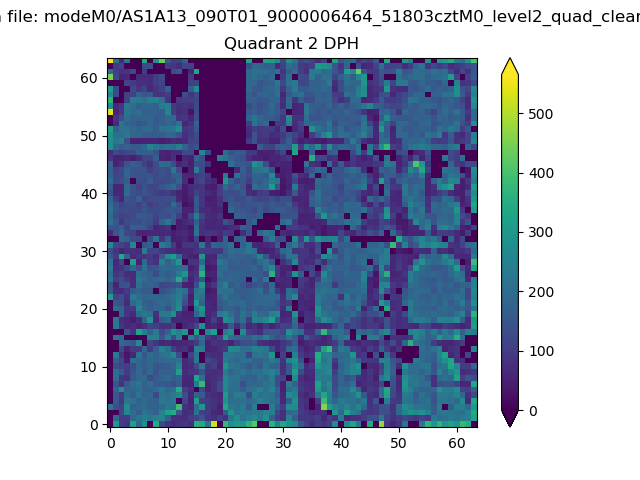
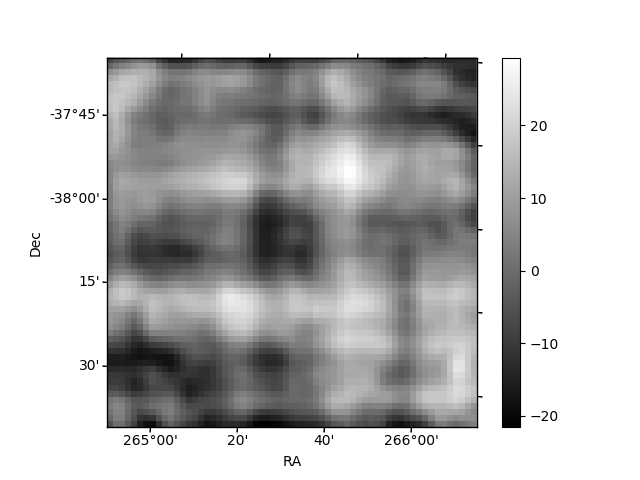
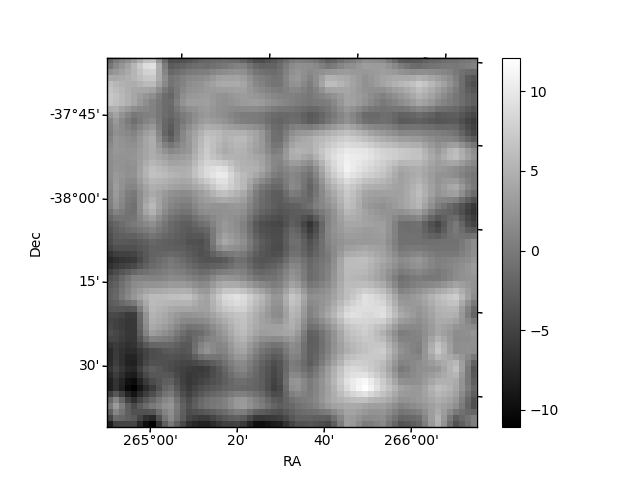
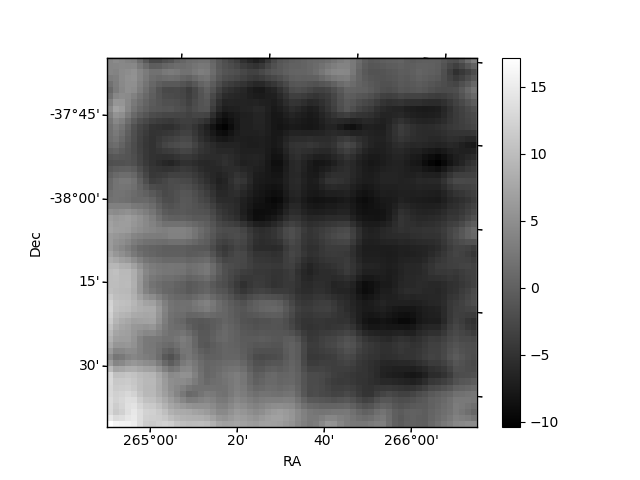
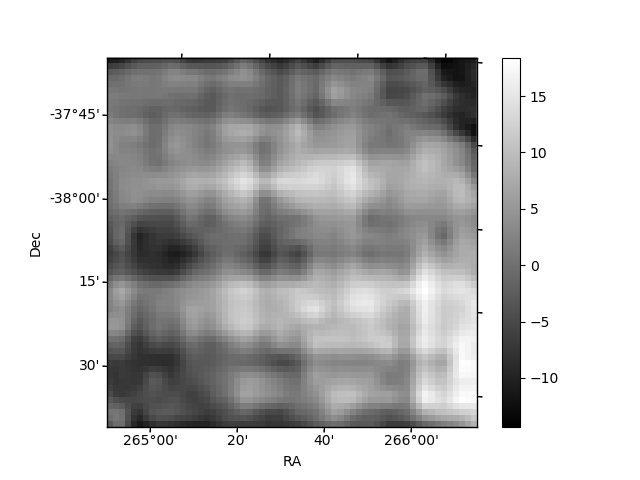
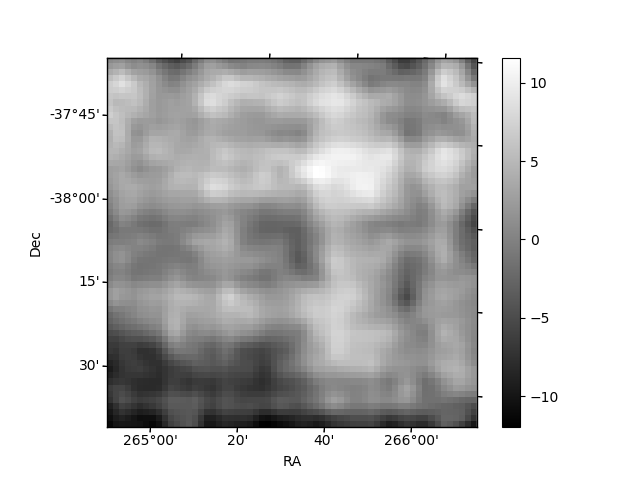
Histogram calculated using DETX and DETY for each event in the final _common_clean file
| Quadrant A | 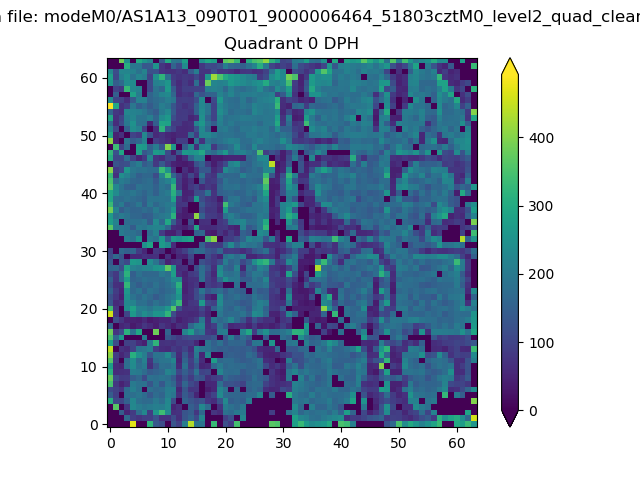 |
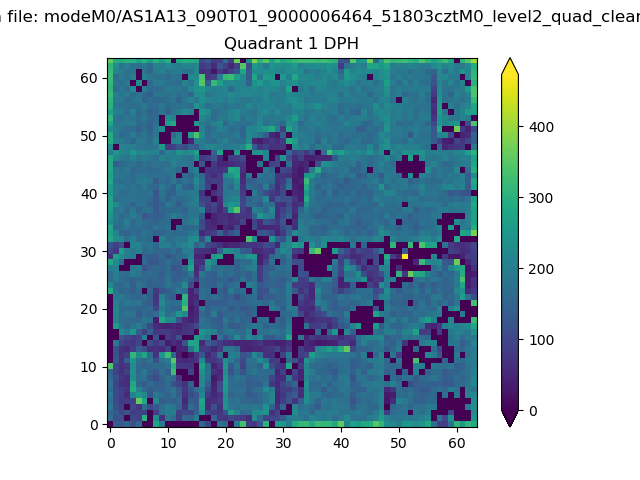 |
Quadrant B |
|---|---|---|---|
| Quadrant D | 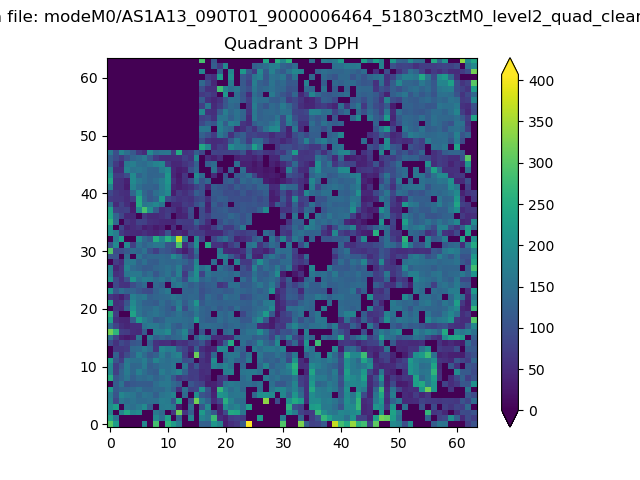 |
 |
Quadrant C |
| Plot type | Count rate plots | Images |
|---|---|---|
| Comparison with Poisson distribution Blue bars denote a histogram of data divided into 1 sec bins. Red curve is a Poisson curve with rate = median count rate of data. |
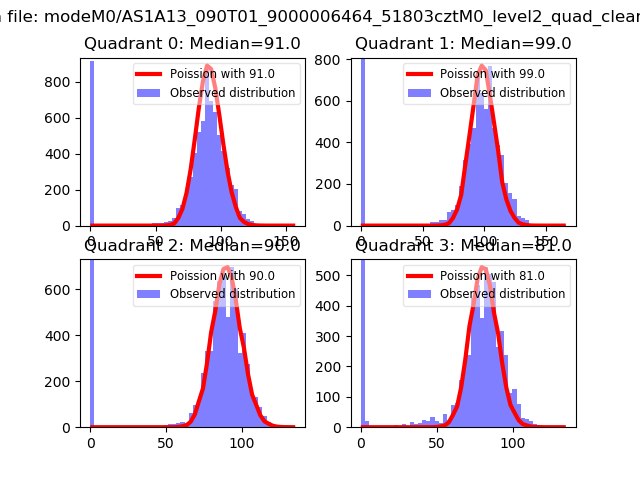 |
 |
| Quadrant-wise count rates Data is divided into 100 sec bins |
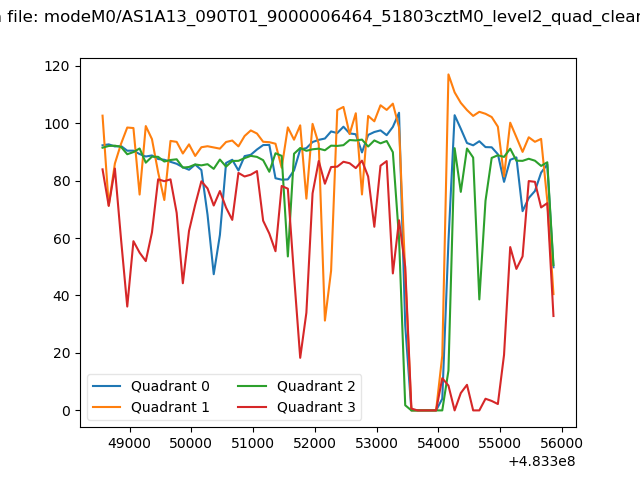 |
|
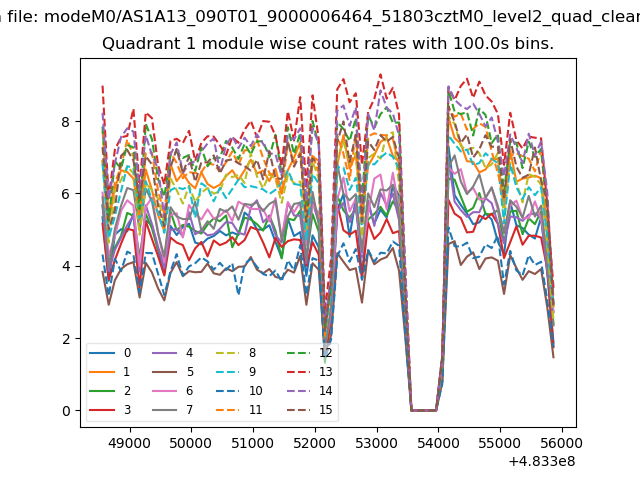
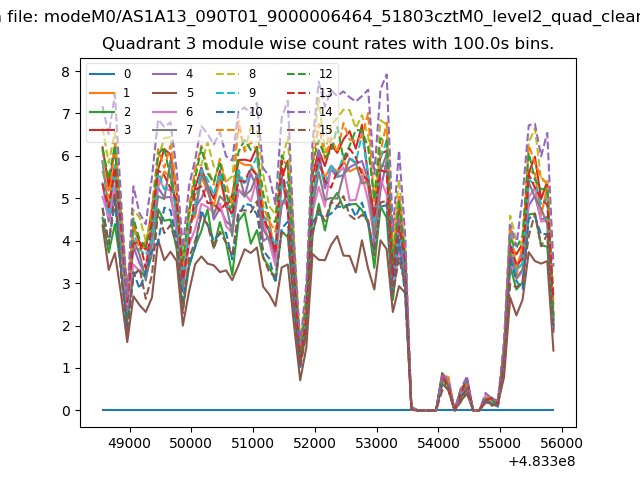
| Module-wise count rates for Quadrant A Data is divided into 100 sec bins |
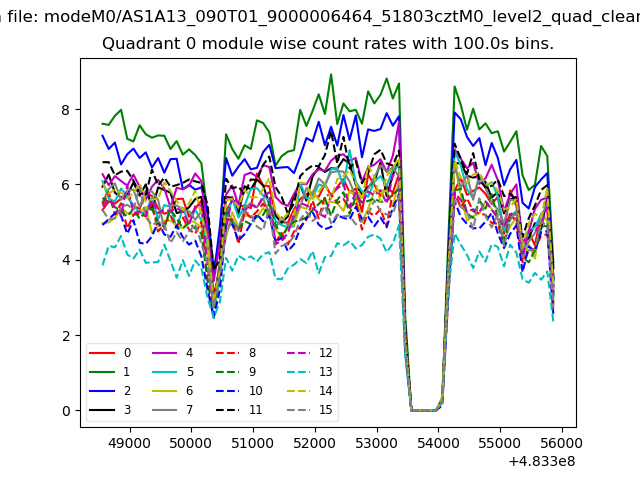 |
 |
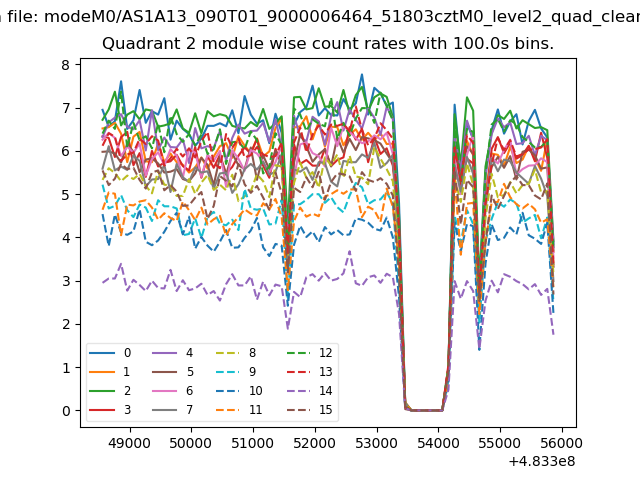
| Module-wise count rates for Quadrant B Data is divided into 100 sec bins |
 |
 |
| Module-wise count rates for Quadrant C Data is divided into 100 sec bins |
 |
 |
| Module-wise count rates for Quadrant D Data is divided into 100 sec bins |
 |
 |
| Parameter | Plot |
|---|---|
| CZT HV Monitor | 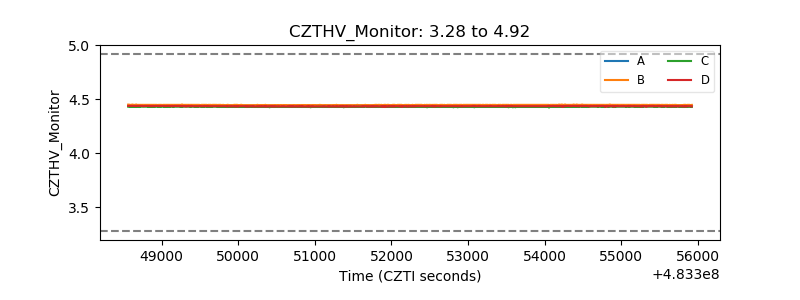 |
| D_VDD | 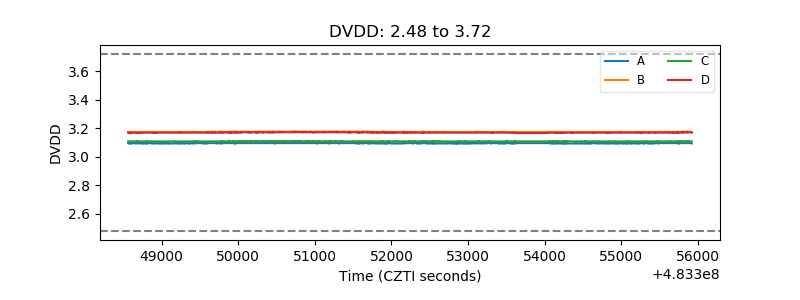 |
| Temperature 1 | 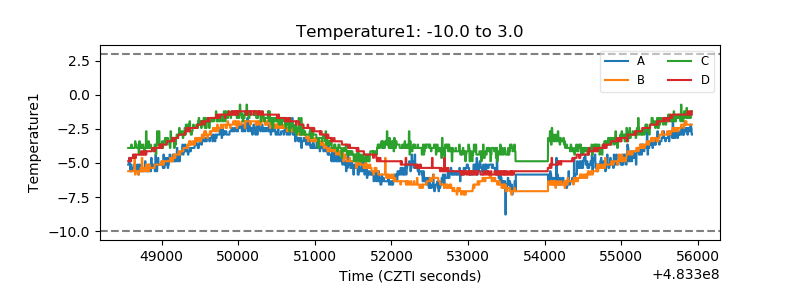 |
| Veto HV Monitor | 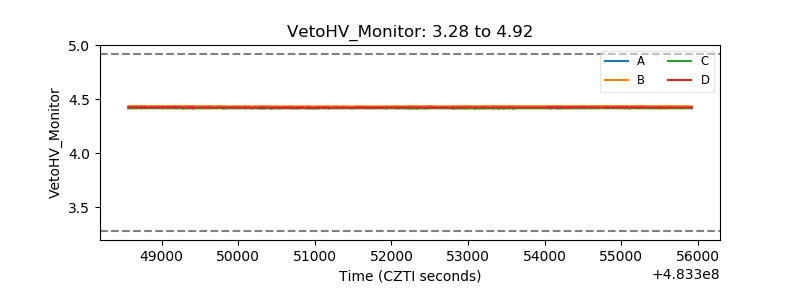 |
| Veto LLD | 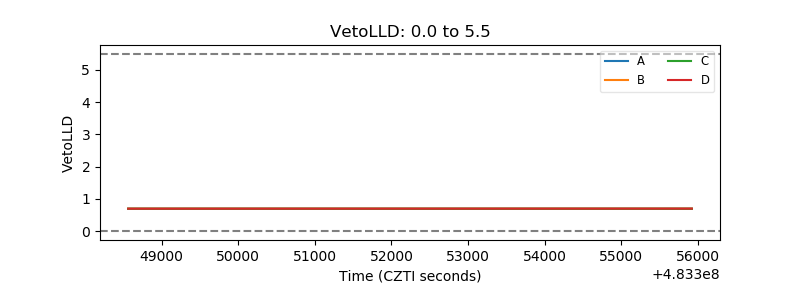 |
| Alpha Counter | 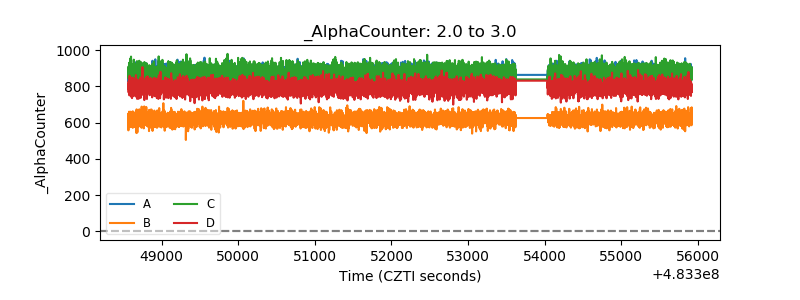 |
| _CPM_Rate | 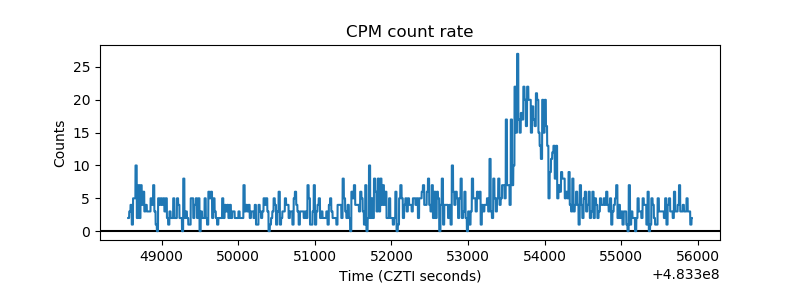 |
| CZT Counter | 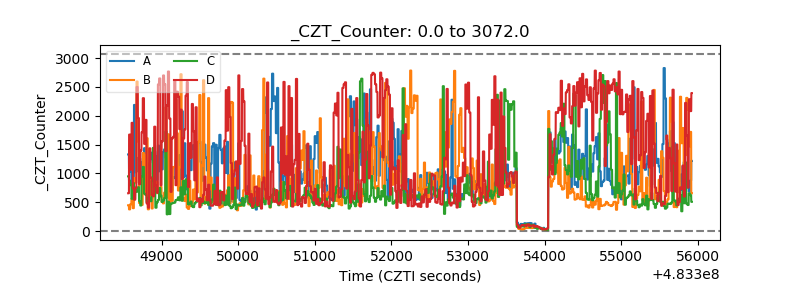 |
| +2.5 Volts monitor | 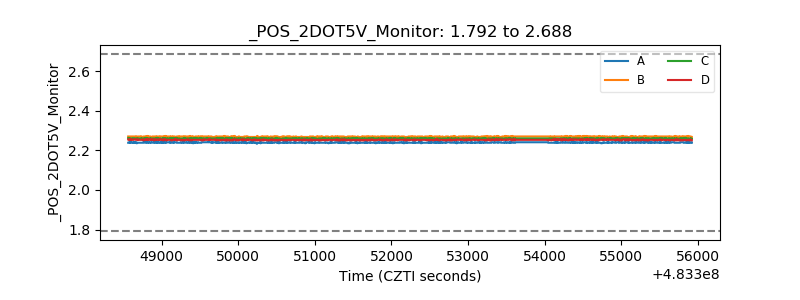 |
| +5 Volts monitor | 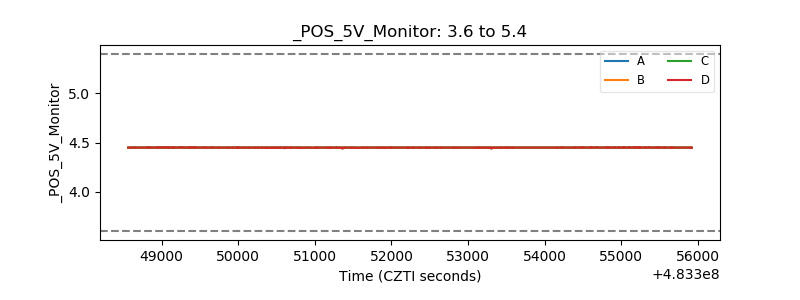 |
| _ROLL_ROT | 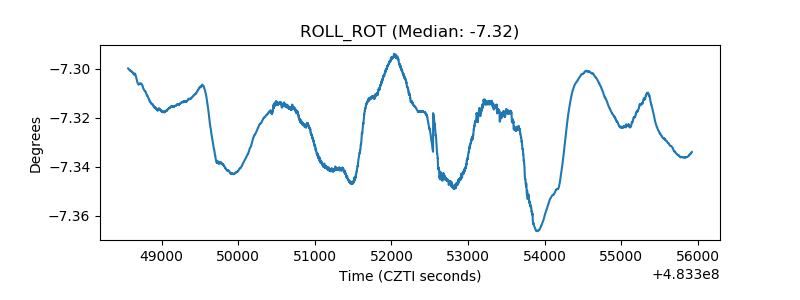 |
| _Roll_DEC | 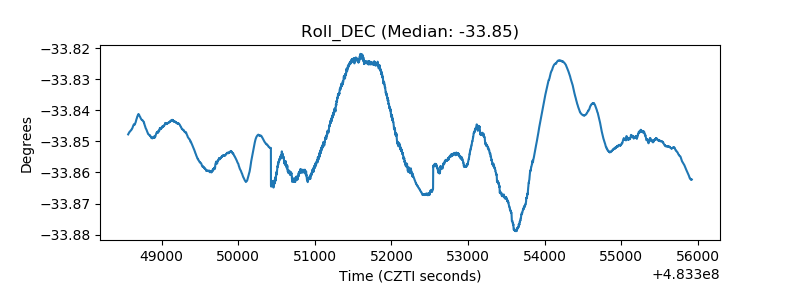 |
| _Roll_RA | 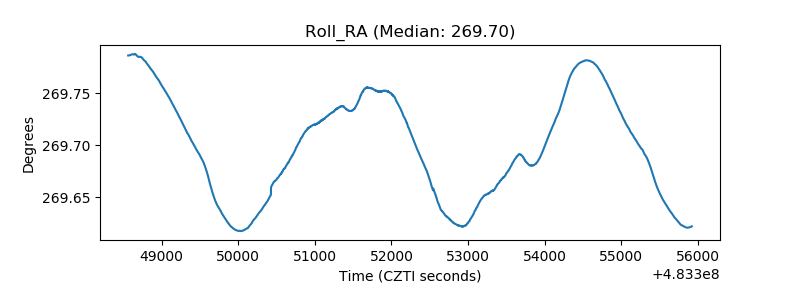 |
| Veto Counter | 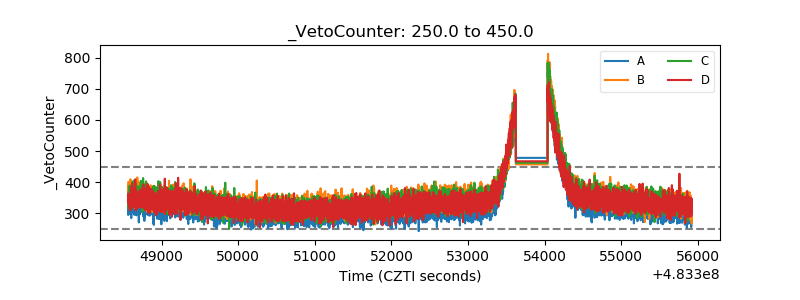 |