| Param | Original file | Final file |
|---|---|---|
| Filename | modeM0/AS1A13_090T01_9000006464_51804cztM0_level2.fits | modeM0/AS1A13_090T01_9000006464_51804cztM0_level2_quad_clean.evt |
| Size (bytes) | 909,221,760 | 104,232,960 |
| Size | 867.1 MB | 99.4 MB |
| Events in quadrant A | 8,555,922 | 692,714 |
| Events in quadrant B | 8,561,599 | 684,839 |
| Events in quadrant C | 6,875,699 | 679,793 |
| Events in quadrant D | 9,059,404 | 553,475 |
| Mode SS | |||
|---|---|---|---|
| Quadrant | BADHDUFLAG | Total packets | Discarded packets |
| A | 0 | 156 | 0 |
| B | 0 | 156 | 0 |
| C | 0 | 156 | 0 |
| D | 0 | 156 | 0 |
| Mode M0 | |||
|---|---|---|---|
| Quadrant | BADHDUFLAG | Total packets | Discarded packets |
| A | 0 | 31026 | 1 |
| B | 0 | 30799 | 0 |
| C | 0 | 25869 | 0 |
| D | 0 | 32314 | 0 |
| Quadrant | Total seconds | Saturated seconds | Saturation percentage |
|---|---|---|---|
| A | 7836 | 535 | 6.827463% |
| B | 7837 | 1417 | 18.080898% |
| C | 7837 | 454 | 5.793033% |
| D | 7837 | 1584 | 20.211816% |
Noise dominated data is calculated using 1-second bins in cleaned event files. If a bin has >2000 counts, and if more than 50% of those come from <1% of pixels, then it is considered to be noise-dominated and hence unusable.
| Quadrant | # 1 sec bins | Bins with >0 counts | Bins with >2000 counts | High rate bins dominated by noise | Noise dominated (total time) | Noise dominated (detector-on time) | Marked lightcurve |
|---|---|---|---|---|---|---|---|
| A | 7836 | 7836 | 327 | 327 | 4.17% | 4.17% | 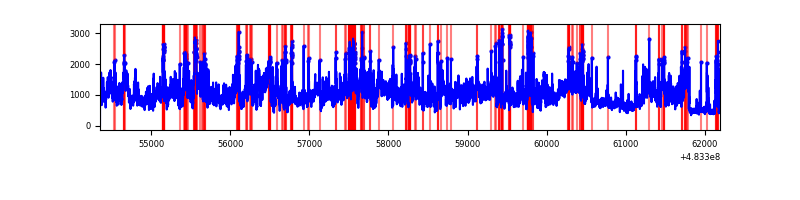 |
| B | 7837 | 7837 | 1106 | 1106 | 14.11% | 14.11% | 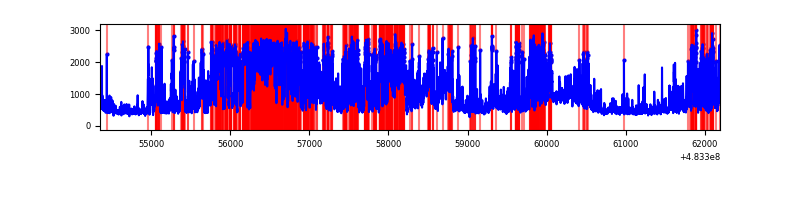 |
| C | 7837 | 7837 | 303 | 303 | 3.87% | 3.87% | 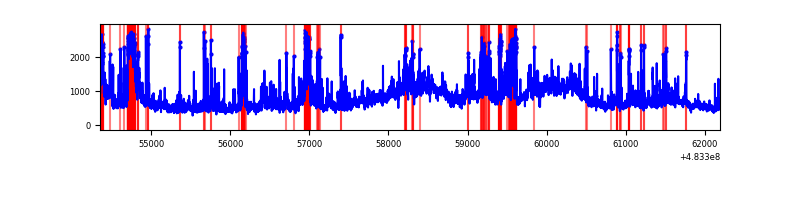 |
| D | 7837 | 7837 | 1529 | 1529 | 19.51% | 19.51% | 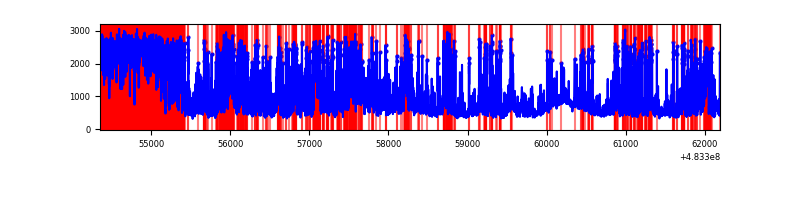 |
Top three noisy pixels from each quadrant. If the there are fewer than three noisy pixels in the level2.evt file, extra rows are filled as -1
| Pixel properties | Quadrant properties | ||||||
|---|---|---|---|---|---|---|---|
| Quadrant | DetID | PixID | Counts | Sigma | Mean | Median | Sigma |
| A | 12 | 3 | 3398252 | 16559.38 | 842 | 824 | 205.2 |
| A | 12 | 194 | 393080 | 1911.89 | 842 | 824 | 205.2 |
| A | 11 | 3 | 291120 | 1414.93 | 842 | 824 | 205.2 |
| B | 10 | 44 | 2310731 | 13112.41 | 814 | 784 | 176.2 |
| B | 10 | 128 | 1698669 | 9638.04 | 814 | 784 | 176.2 |
| B | 4 | 206 | 473912 | 2685.71 | 814 | 784 | 176.2 |
| C | 10 | 22 | 1603484 | 7155.36 | 824 | 816 | 224.0 |
| C | 13 | 3 | 484800 | 2160.82 | 824 | 816 | 224.0 |
| C | 15 | 218 | 339815 | 1513.51 | 824 | 816 | 224.0 |
| D | 11 | 129 | 4879142 | 23728.27 | 748 | 724 | 205.6 |
| D | 0 | 18 | 481000 | 2336.03 | 748 | 724 | 205.6 |
| D | 8 | 176 | 352480 | 1710.92 | 748 | 724 | 205.6 |
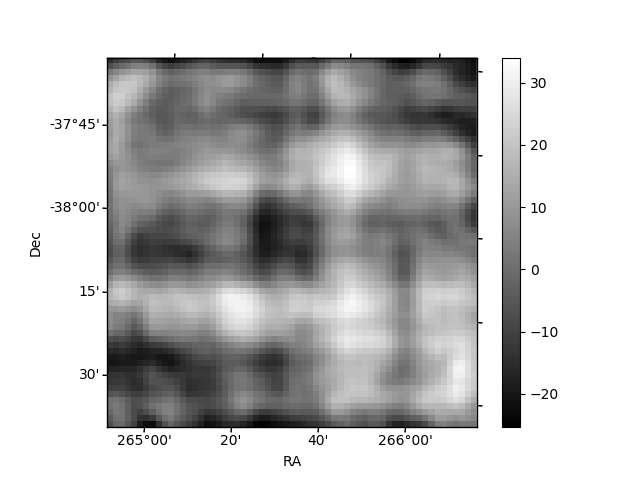
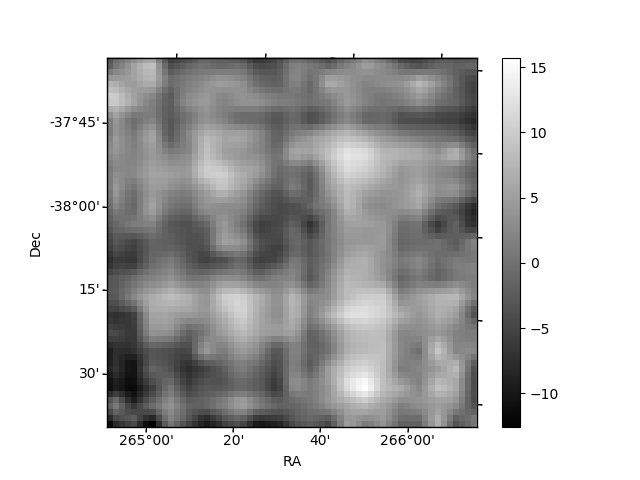
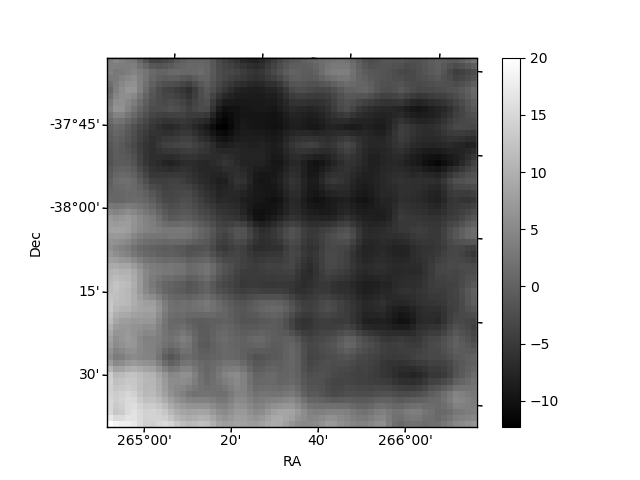
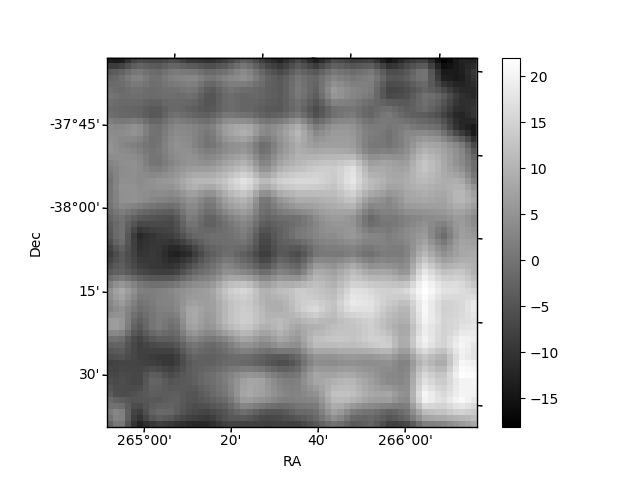
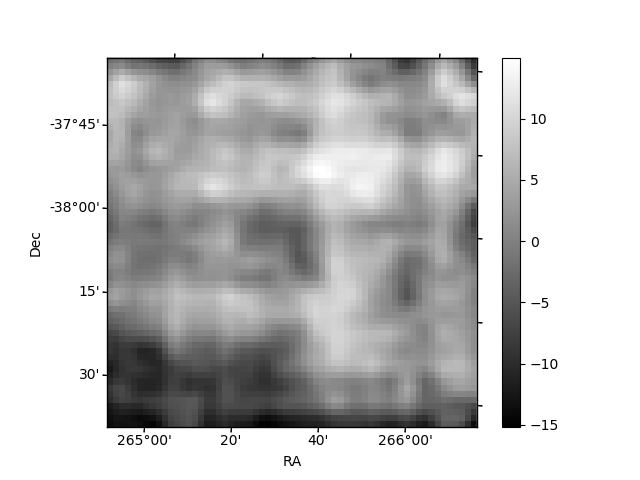
Histogram calculated using DETX and DETY for each event in the final _common_clean file
| Quadrant A | 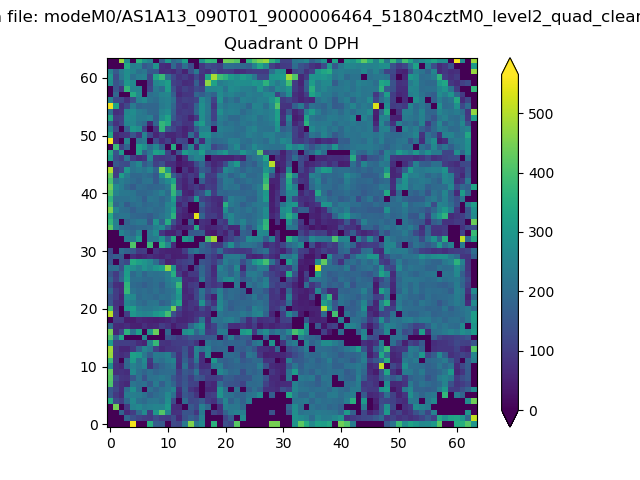 |
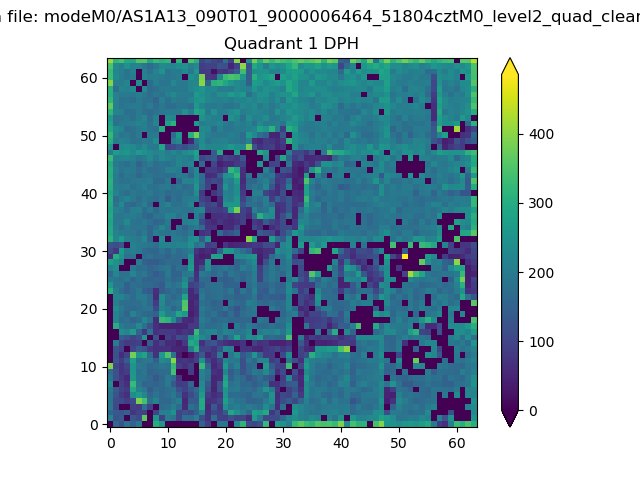 |
Quadrant B |
|---|---|---|---|
| Quadrant D | 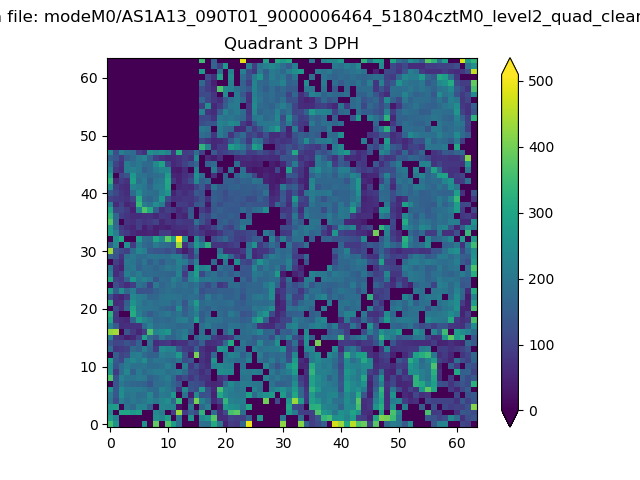 |
 |
Quadrant C |
| Plot type | Count rate plots | Images |
|---|---|---|
| Comparison with Poisson distribution Blue bars denote a histogram of data divided into 1 sec bins. Red curve is a Poisson curve with rate = median count rate of data. |
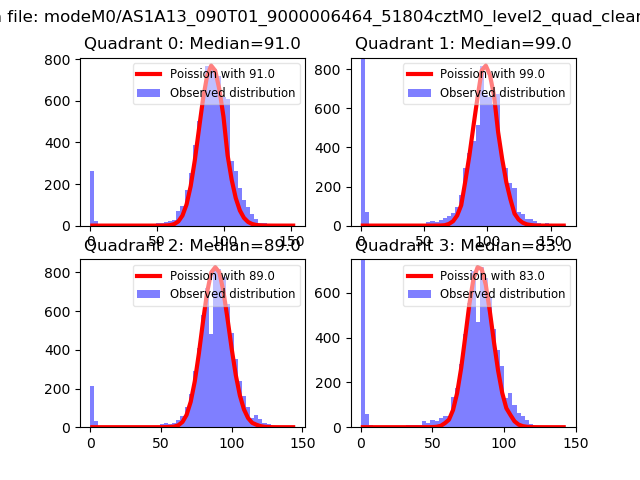 |
 |
| Quadrant-wise count rates Data is divided into 100 sec bins |
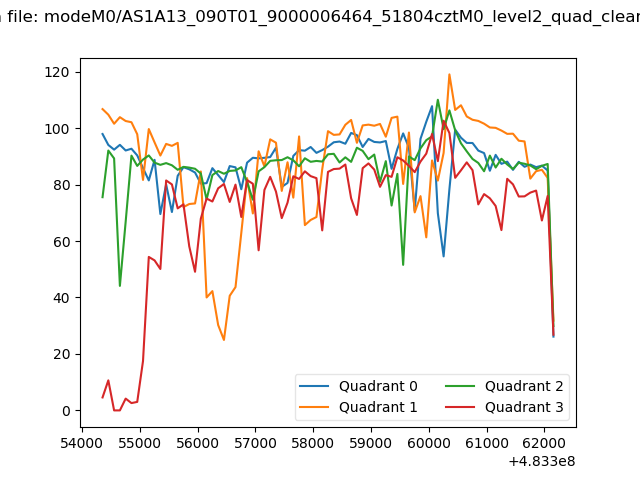 |
|
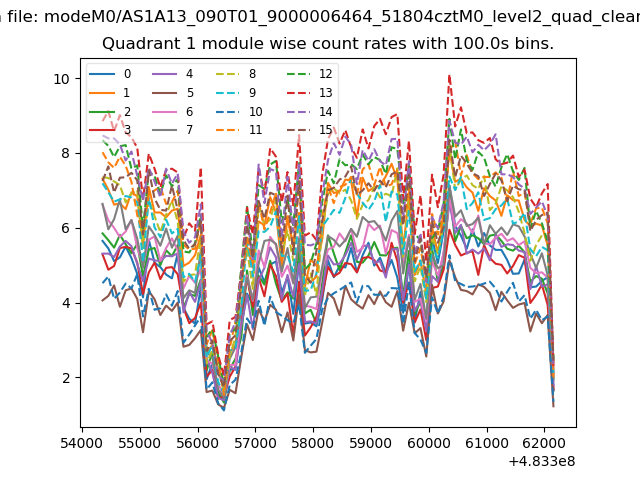
| Module-wise count rates for Quadrant A Data is divided into 100 sec bins |
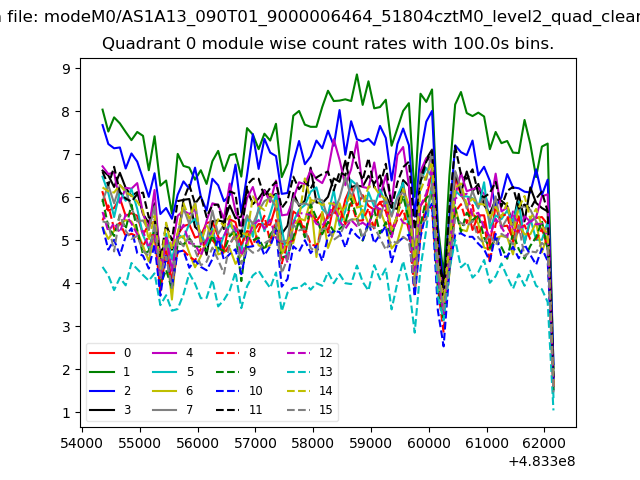 |
 |
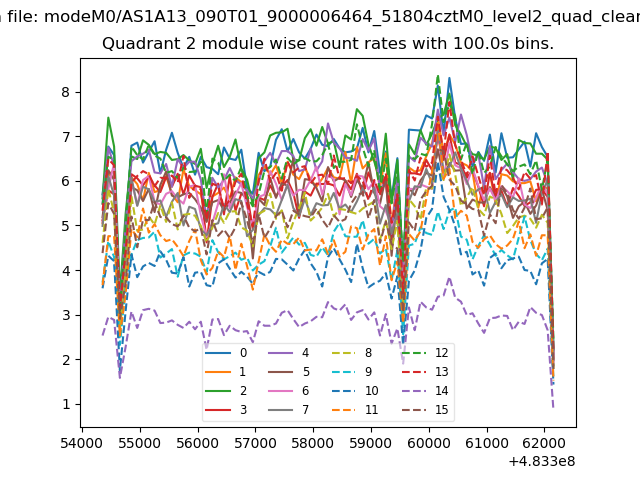
| Module-wise count rates for Quadrant B Data is divided into 100 sec bins |
 |
 |
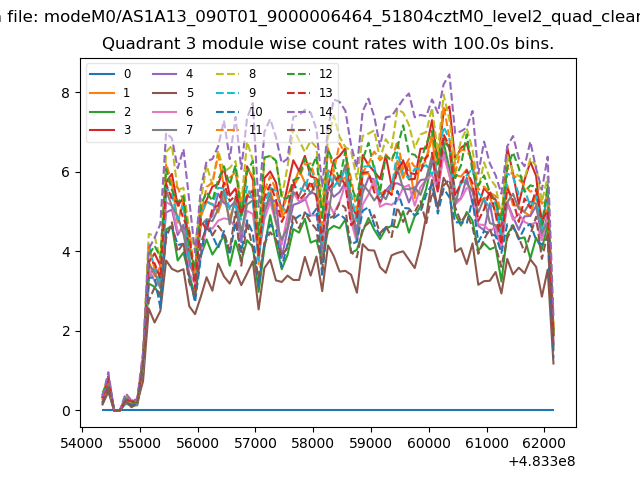
| Module-wise count rates for Quadrant C Data is divided into 100 sec bins |
 |
 |
| Module-wise count rates for Quadrant D Data is divided into 100 sec bins |
 |
 |
| Parameter | Plot |
|---|---|
| CZT HV Monitor | 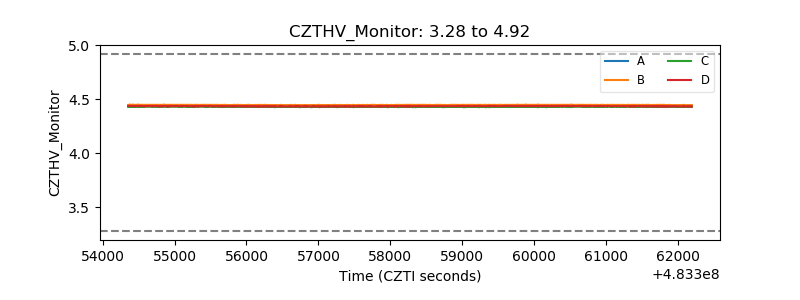 |
| D_VDD | 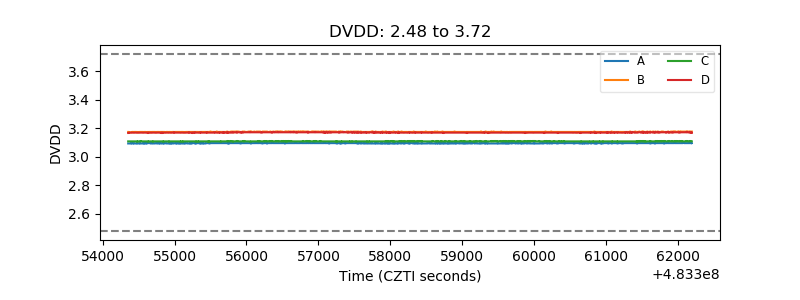 |
| Temperature 1 | 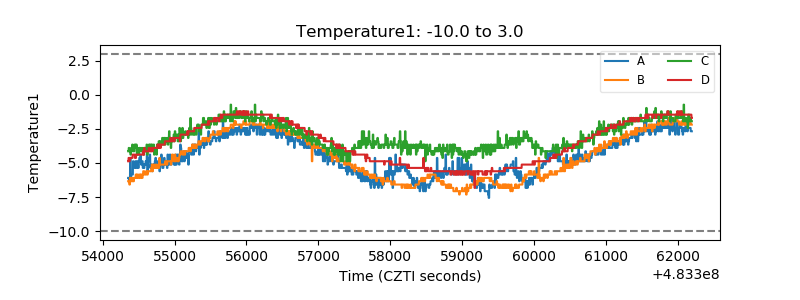 |
| Veto HV Monitor | 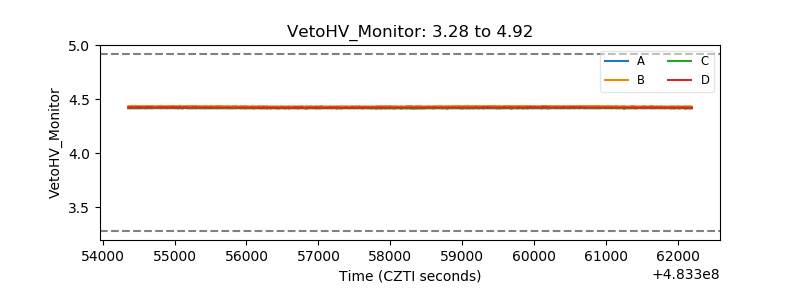 |
| Veto LLD | 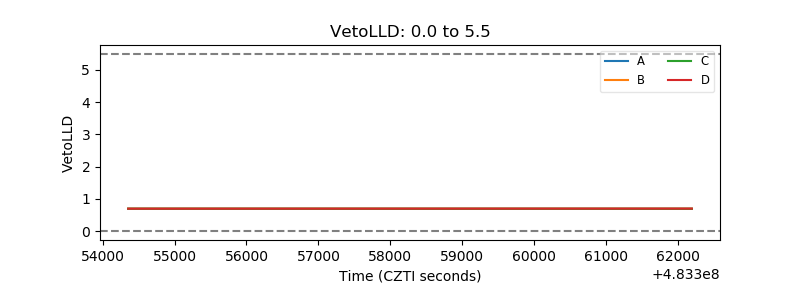 |
| Alpha Counter | 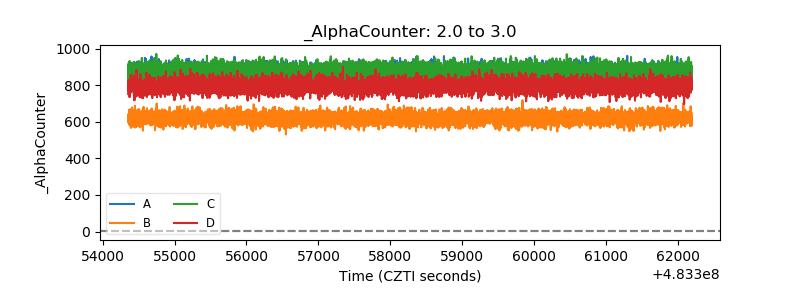 |
| _CPM_Rate | 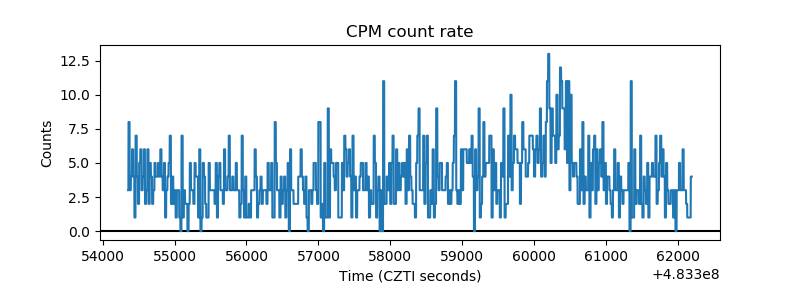 |
| CZT Counter | 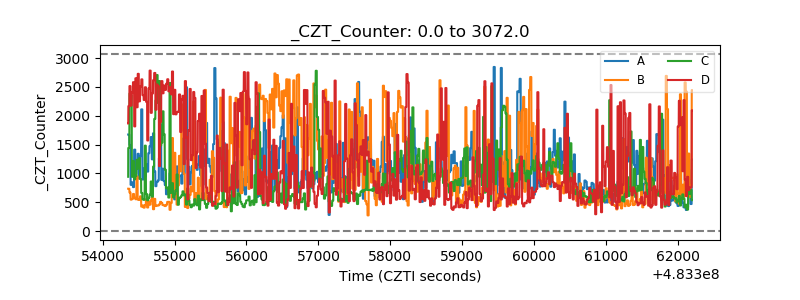 |
| +2.5 Volts monitor | 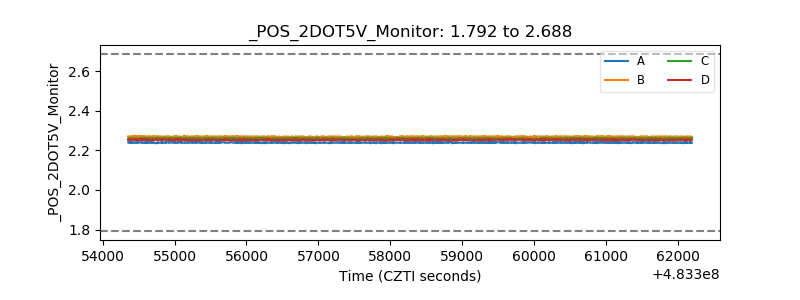 |
| +5 Volts monitor | 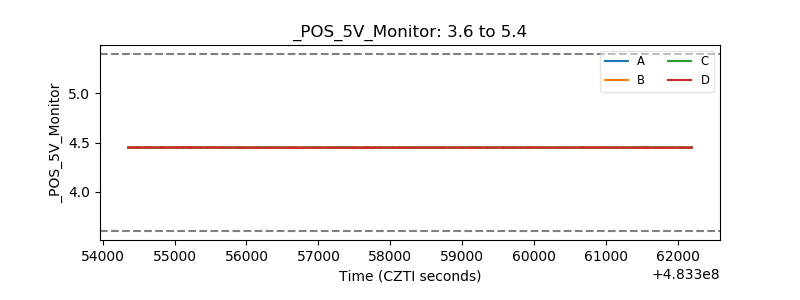 |
| _ROLL_ROT | 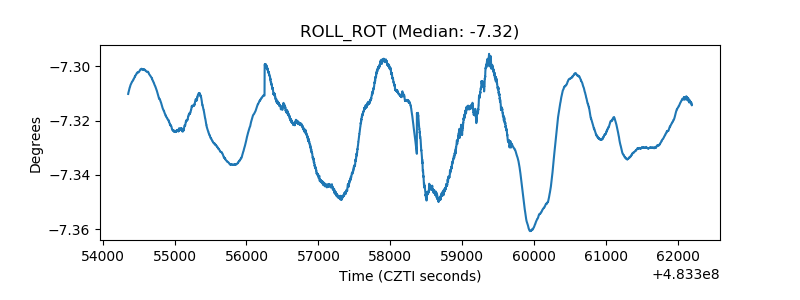 |
| _Roll_DEC | 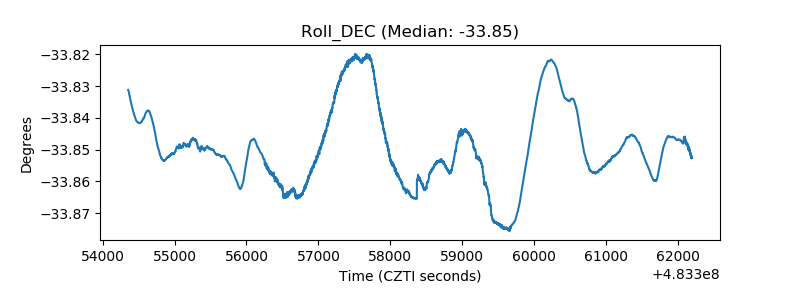 |
| _Roll_RA | 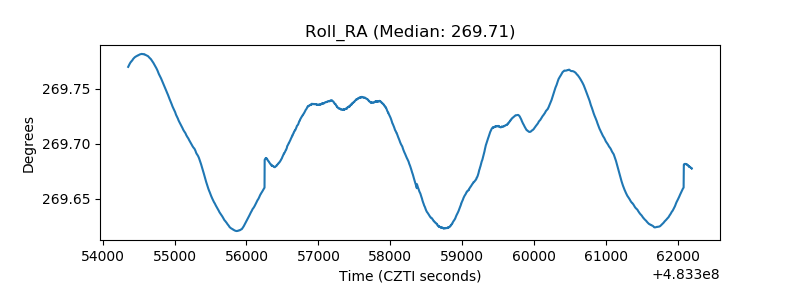 |
| Veto Counter | 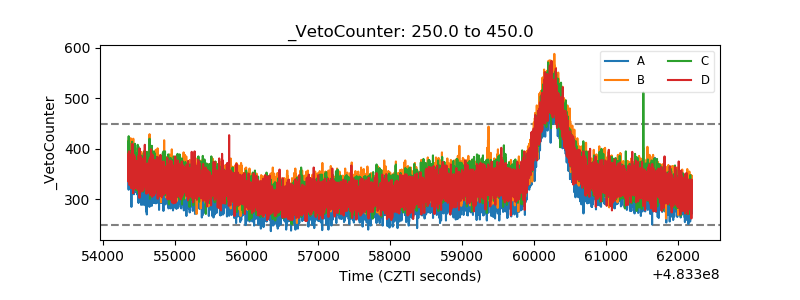 |