| Param | Original file | Final file |
|---|---|---|
| Filename | modeM0/AS1A13_090T01_9000006464_51805cztM0_level2.fits | modeM0/AS1A13_090T01_9000006464_51805cztM0_level2_quad_clean.evt |
| Size (bytes) | 721,175,040 | 110,557,440 |
| Size | 687.8 MB | 105.4 MB |
| Events in quadrant A | 5,676,125 | 723,727 |
| Events in quadrant B | 6,884,326 | 764,482 |
| Events in quadrant C | 5,860,953 | 687,022 |
| Events in quadrant D | 7,658,287 | 618,110 |
| Mode SS | |||
|---|---|---|---|
| Quadrant | BADHDUFLAG | Total packets | Discarded packets |
| A | 0 | 160 | 0 |
| B | 0 | 160 | 0 |
| C | 0 | 160 | 0 |
| D | 0 | 160 | 0 |
| Mode M0 | |||
|---|---|---|---|
| Quadrant | BADHDUFLAG | Total packets | Discarded packets |
| A | 0 | 22193 | 0 |
| B | 0 | 25917 | 0 |
| C | 0 | 22912 | 0 |
| D | 0 | 28235 | 2 |
| Quadrant | Total seconds | Saturated seconds | Saturation percentage |
|---|---|---|---|
| A | 7965 | 214 | 2.686755% |
| B | 7966 | 576 | 7.230731% |
| C | 7966 | 339 | 4.255586% |
| D | 7965 | 892 | 11.198996% |
Noise dominated data is calculated using 1-second bins in cleaned event files. If a bin has >2000 counts, and if more than 50% of those come from <1% of pixels, then it is considered to be noise-dominated and hence unusable.
| Quadrant | # 1 sec bins | Bins with >0 counts | Bins with >2000 counts | High rate bins dominated by noise | Noise dominated (total time) | Noise dominated (detector-on time) | Marked lightcurve |
|---|---|---|---|---|---|---|---|
| A | 7965 | 7965 | 190 | 190 | 2.39% | 2.39% | 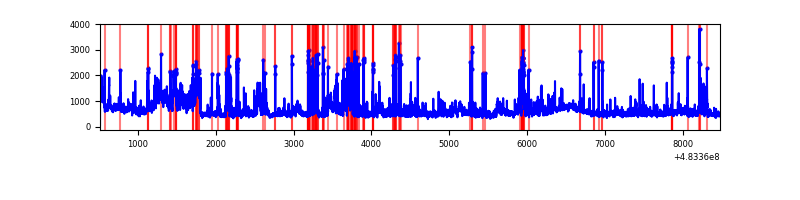 |
| B | 7966 | 7966 | 489 | 489 | 6.14% | 6.14% | 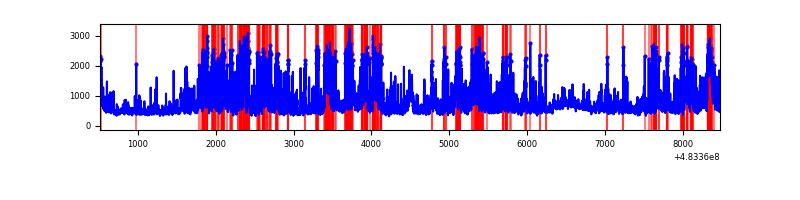 |
| C | 7966 | 7966 | 293 | 293 | 3.68% | 3.68% | 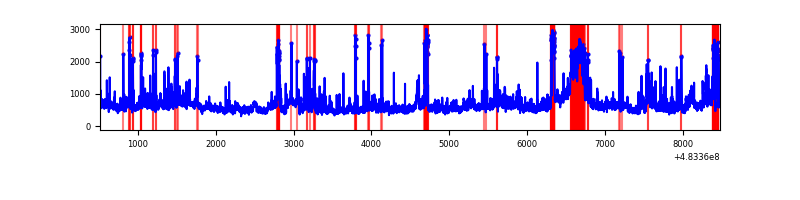 |
| D | 7965 | 7965 | 884 | 884 | 11.10% | 11.10% | 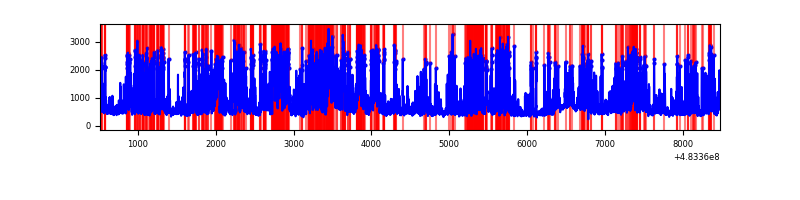 |
Top three noisy pixels from each quadrant. If the there are fewer than three noisy pixels in the level2.evt file, extra rows are filled as -1
| Pixel properties | Quadrant properties | ||||||
|---|---|---|---|---|---|---|---|
| Quadrant | DetID | PixID | Counts | Sigma | Mean | Median | Sigma |
| A | 12 | 3 | 603621 | 2899.68 | 852 | 831 | 207.9 |
| A | 11 | 3 | 387635 | 1860.69 | 852 | 831 | 207.9 |
| A | 4 | 175 | 342524 | 1643.69 | 852 | 831 | 207.9 |
| B | 10 | 128 | 1597572 | 8836.94 | 835 | 806 | 180.7 |
| B | 4 | 206 | 518123 | 2862.97 | 835 | 806 | 180.7 |
| B | 10 | 44 | 362553 | 2002.01 | 835 | 806 | 180.7 |
| C | 10 | 22 | 887399 | 3953.18 | 821 | 814 | 224.3 |
| C | 15 | 199 | 483905 | 2154.05 | 821 | 814 | 224.3 |
| C | 3 | 233 | 297360 | 1322.27 | 821 | 814 | 224.3 |
| D | 11 | 129 | 3232227 | 14602.36 | 800 | 773 | 221.3 |
| D | 0 | 18 | 267665 | 1206.03 | 800 | 773 | 221.3 |
| D | 3 | 12 | 211616 | 952.76 | 800 | 773 | 221.3 |
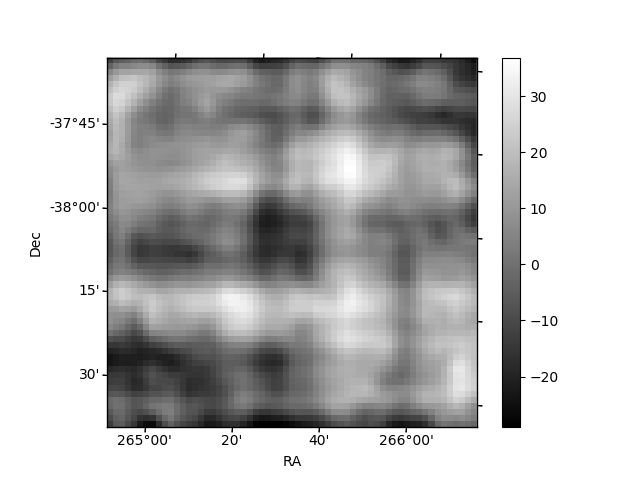
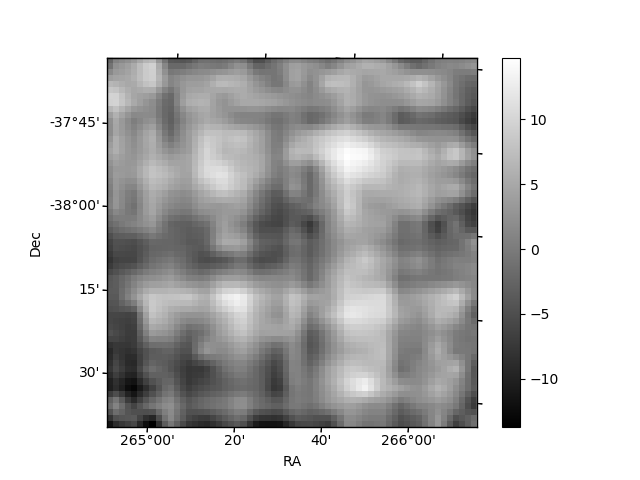
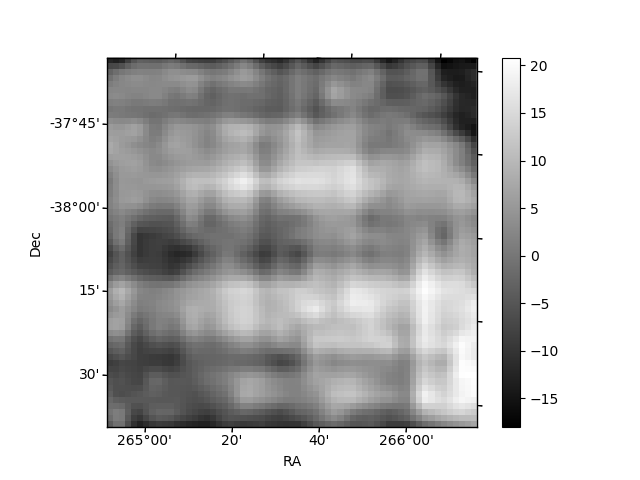
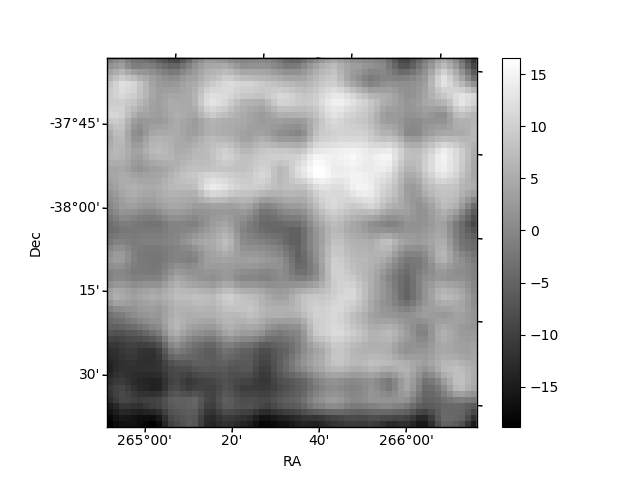
Histogram calculated using DETX and DETY for each event in the final _common_clean file
| Quadrant A | 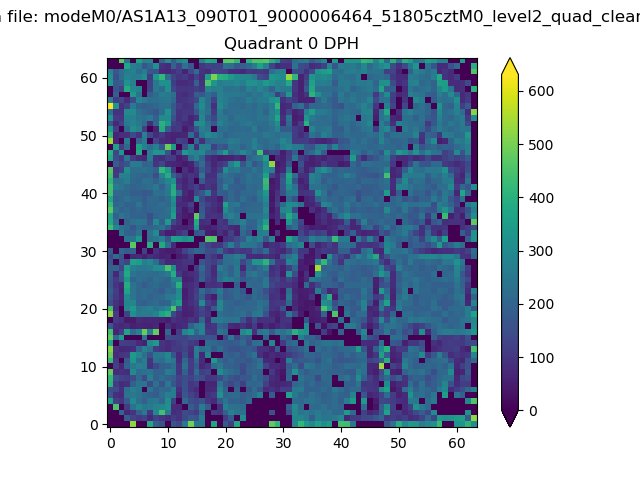 |
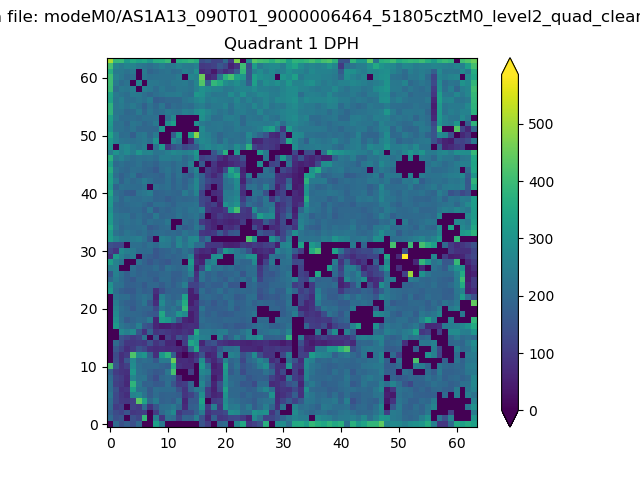 |
Quadrant B |
|---|---|---|---|
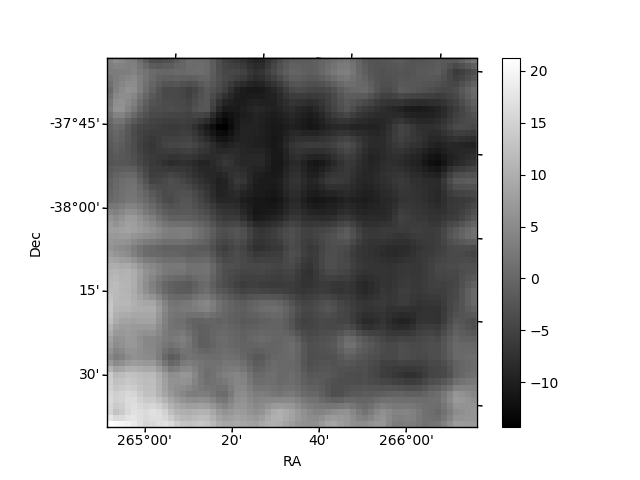
| Quadrant D | 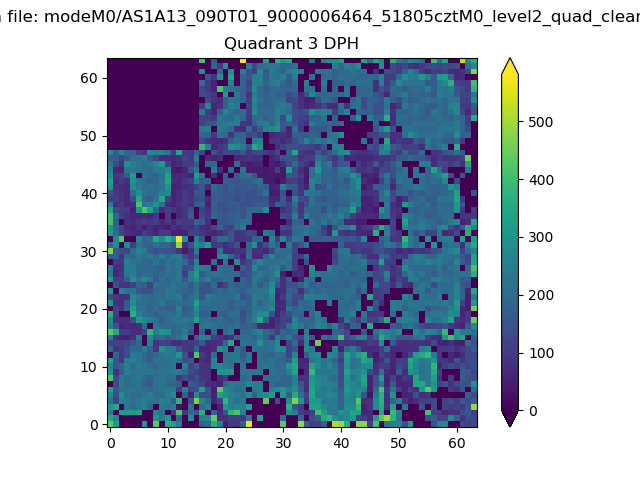 |
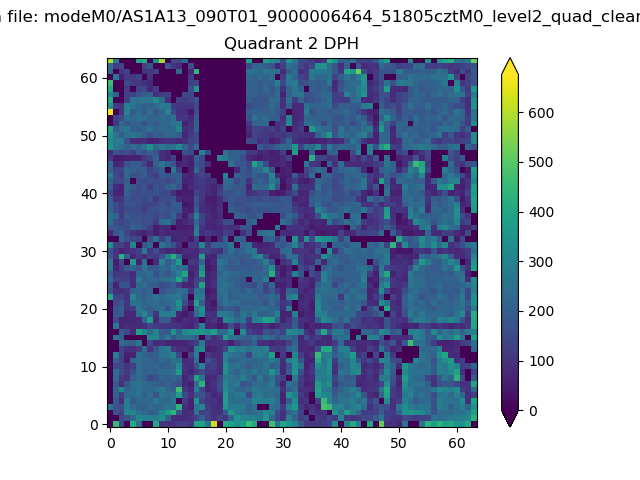 |
Quadrant C |
| Plot type | Count rate plots | Images |
|---|---|---|
| Comparison with Poisson distribution Blue bars denote a histogram of data divided into 1 sec bins. Red curve is a Poisson curve with rate = median count rate of data. |
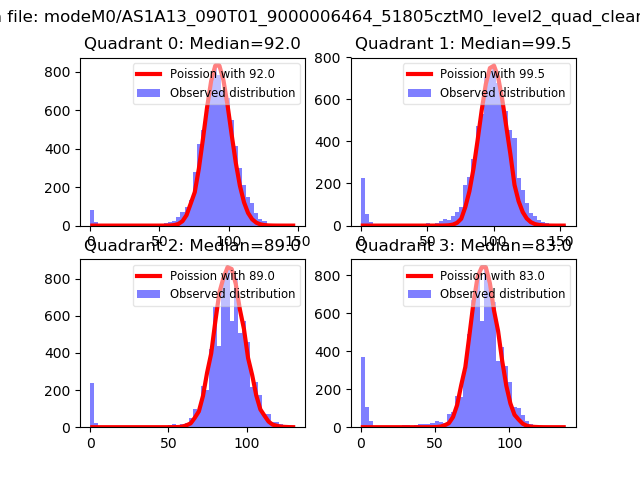 |
 |
| Quadrant-wise count rates Data is divided into 100 sec bins |
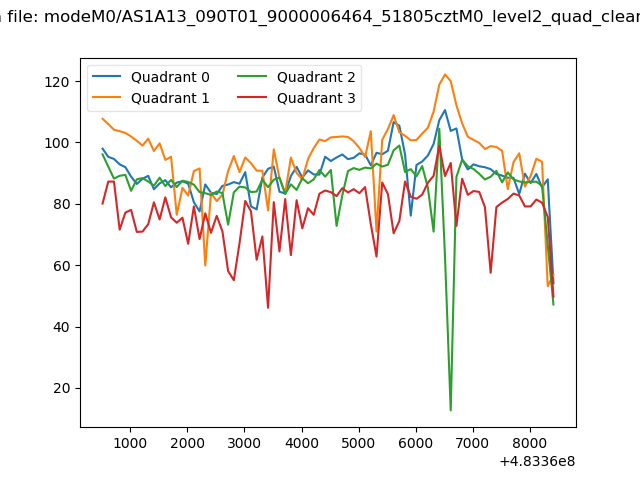 |
|
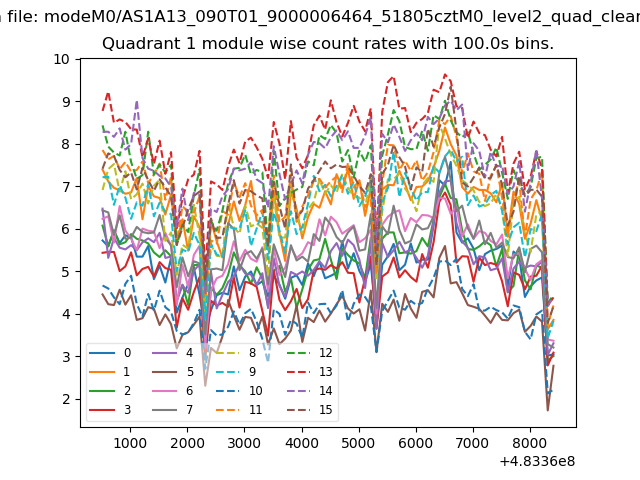
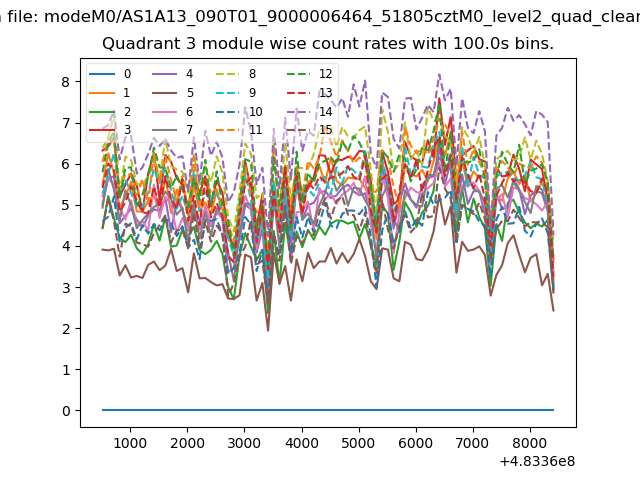
| Module-wise count rates for Quadrant A Data is divided into 100 sec bins |
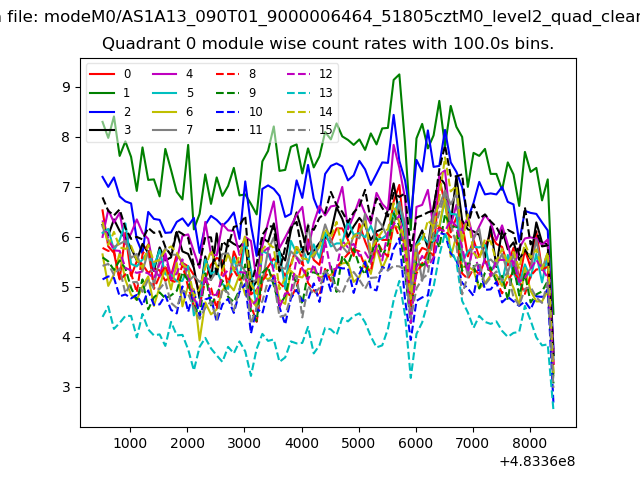 |
 |
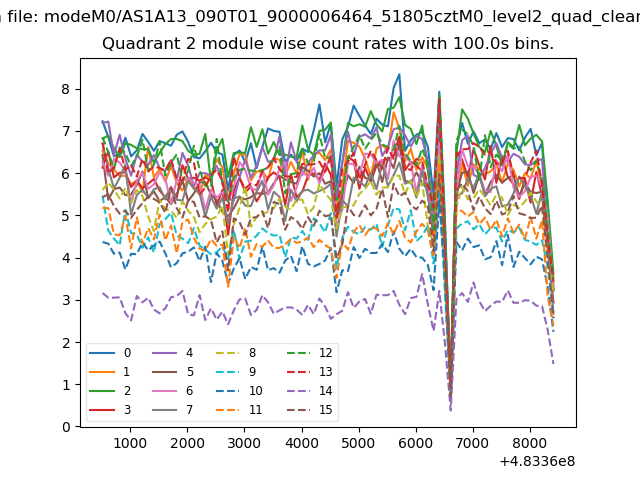
| Module-wise count rates for Quadrant B Data is divided into 100 sec bins |
 |
 |
| Module-wise count rates for Quadrant C Data is divided into 100 sec bins |
 |
 |
| Module-wise count rates for Quadrant D Data is divided into 100 sec bins |
 |
 |
| Parameter | Plot |
|---|---|
| CZT HV Monitor |  |
| D_VDD | 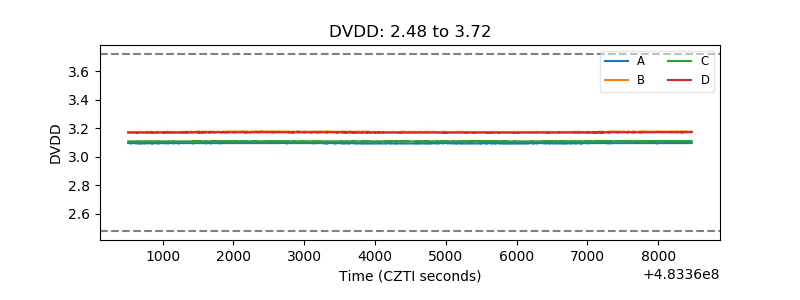 |
| Temperature 1 | 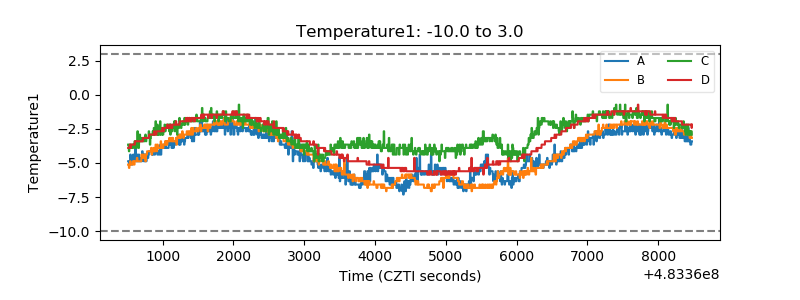 |
| Veto HV Monitor | 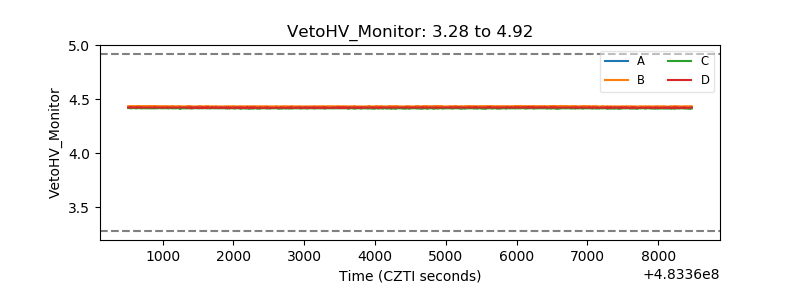 |
| Veto LLD | 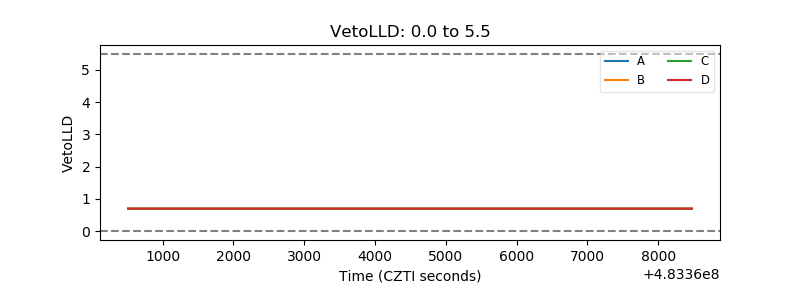 |
| Alpha Counter | 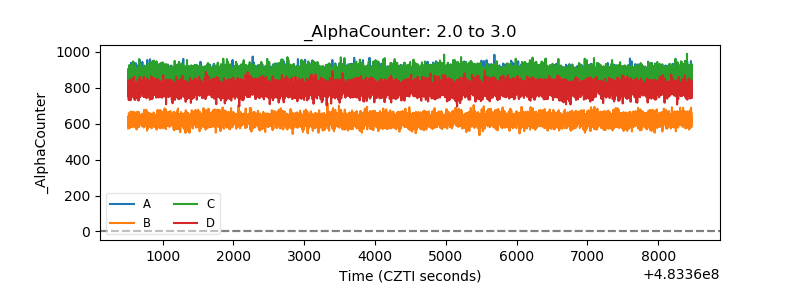 |
| _CPM_Rate | 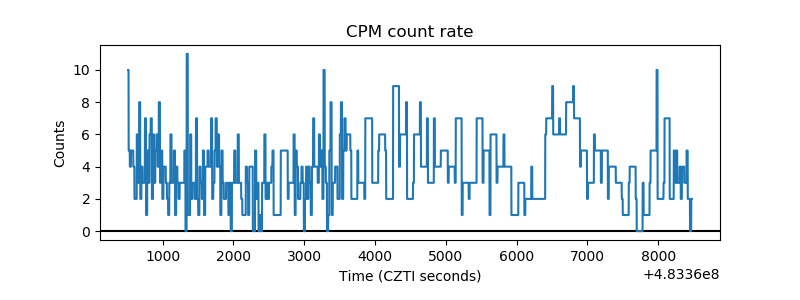 |
| CZT Counter | 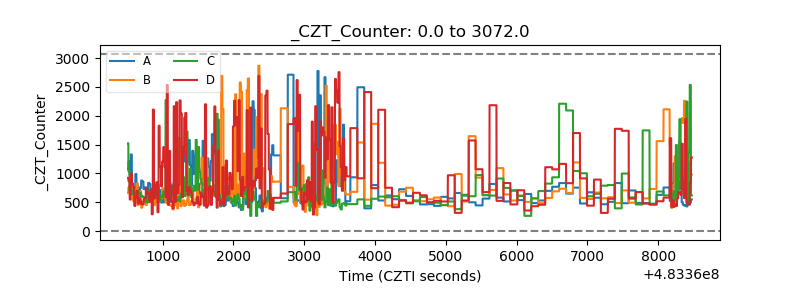 |
| +2.5 Volts monitor | 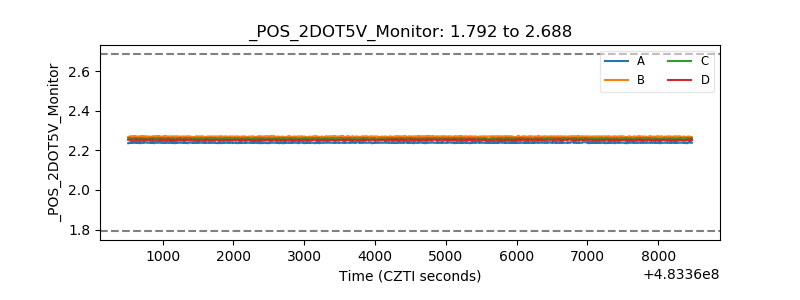 |
| +5 Volts monitor | 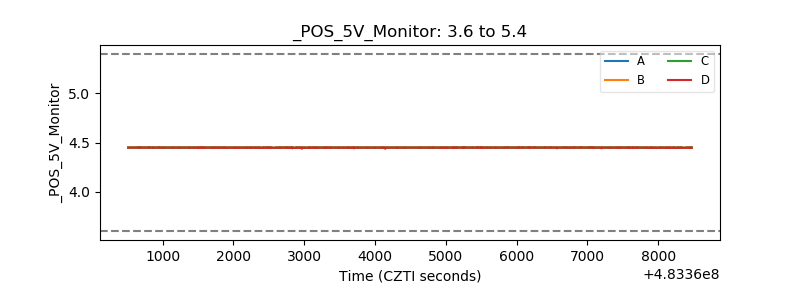 |
| _ROLL_ROT | 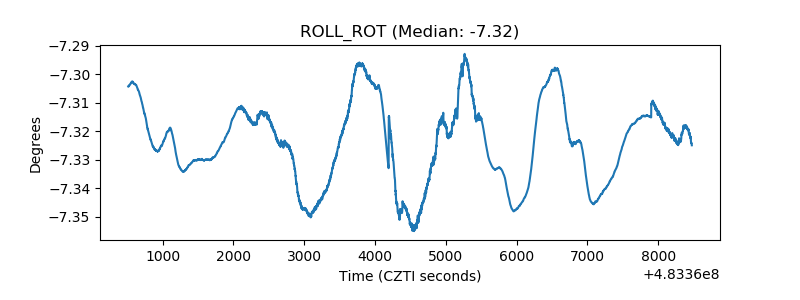 |
| _Roll_DEC | 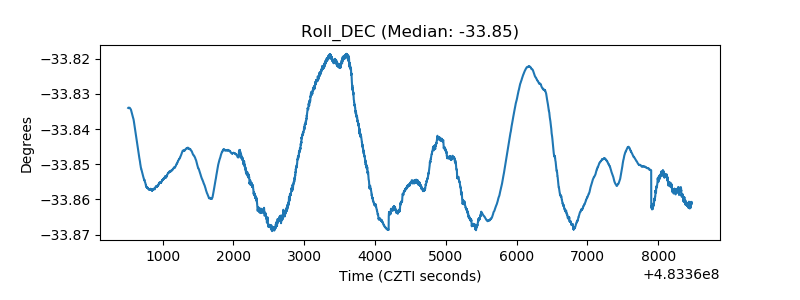 |
| _Roll_RA | 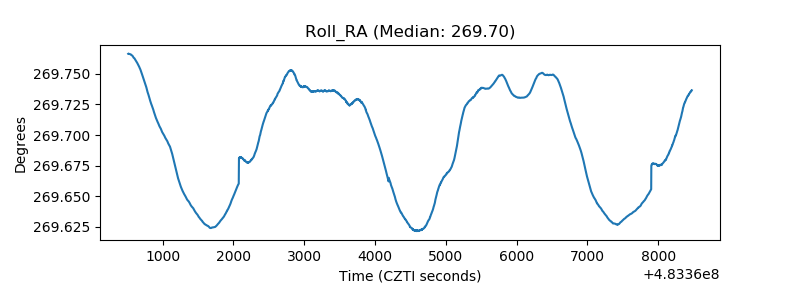 |
| Veto Counter | 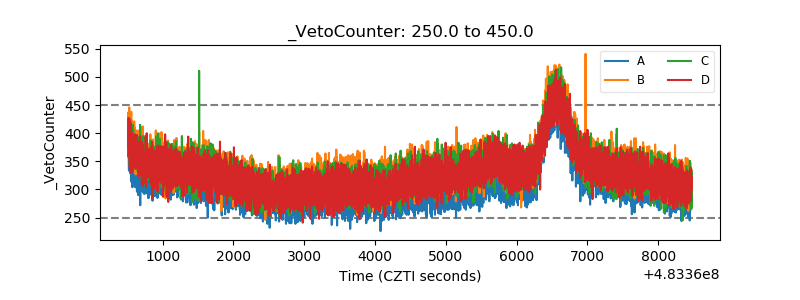 |