| Param | Original file | Final file |
|---|---|---|
| Filename | modeM0/AS1A13_090T01_9000006464_51809cztM0_level2.fits | modeM0/AS1A13_090T01_9000006464_51809cztM0_level2_quad_clean.evt |
| Size (bytes) | 2,430,227,520 | 342,720,000 |
| Size | 2.3 GB | 326.8 MB |
| Events in quadrant A | 21,013,901 | 2,214,592 |
| Events in quadrant B | 22,533,078 | 2,388,162 |
| Events in quadrant C | 16,493,025 | 2,208,376 |
| Events in quadrant D | 27,977,266 | 1,829,390 |
| Mode M9 | |||
|---|---|---|---|
| Quadrant | BADHDUFLAG | Total packets | Discarded packets |
| A | 0 | 15 | 0 |
| B | 0 | 15 | 0 |
| C | 0 | 15 | 0 |
| D | 0 | 15 | 0 |
| Mode SS | |||
|---|---|---|---|
| Quadrant | BADHDUFLAG | Total packets | Discarded packets |
| A | 0 | 512 | 0 |
| B | 0 | 512 | 0 |
| C | 0 | 512 | 0 |
| D | 0 | 512 | 0 |
| Mode M0 | |||
|---|---|---|---|
| Quadrant | BADHDUFLAG | Total packets | Discarded packets |
| A | 0 | 79829 | 3 |
| B | 0 | 84480 | 3 |
| C | 0 | 66809 | 3 |
| D | 0 | 100570 | 4 |
| Quadrant | Total seconds | Saturated seconds | Saturation percentage |
|---|---|---|---|
| A | 25217 | 2011 | 7.974779% |
| B | 25218 | 2287 | 9.068919% |
| C | 25218 | 993 | 3.937664% |
| D | 25217 | 4460 | 17.686481% |
Noise dominated data is calculated using 1-second bins in cleaned event files. If a bin has >2000 counts, and if more than 50% of those come from <1% of pixels, then it is considered to be noise-dominated and hence unusable.
| Quadrant | # 1 sec bins | Bins with >0 counts | Bins with >2000 counts | High rate bins dominated by noise | Noise dominated (total time) | Noise dominated (detector-on time) | Marked lightcurve |
|---|---|---|---|---|---|---|---|
| A | 26822 | 25220 | 1535 | 1535 | 5.72% | 6.09% |  |
| B | 26823 | 25221 | 1252 | 1252 | 4.67% | 4.96% |  |
| C | 26823 | 25221 | 775 | 775 | 2.89% | 3.07% | 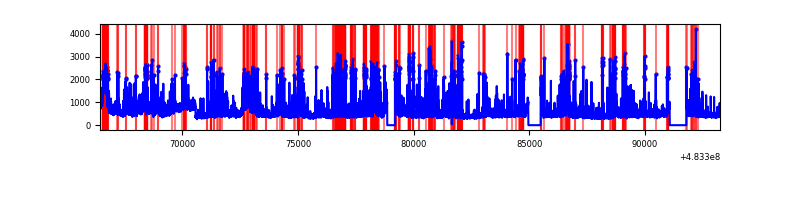 |
| D | 26822 | 25220 | 4056 | 4056 | 15.12% | 16.08% |  |
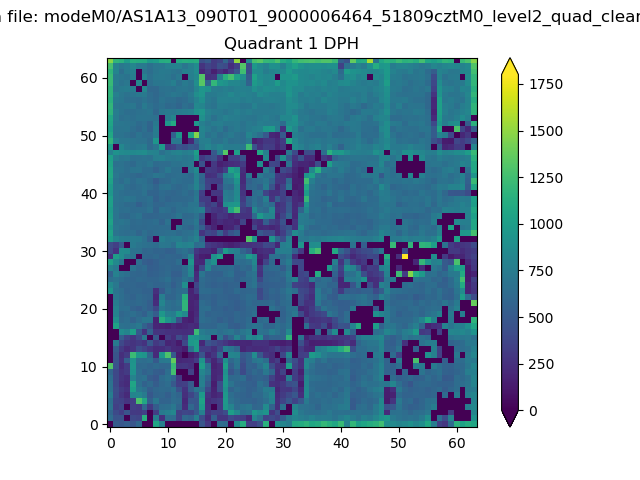
Top three noisy pixels from each quadrant. If the there are fewer than three noisy pixels in the level2.evt file, extra rows are filled as -1
| Pixel properties | Quadrant properties | ||||||
|---|---|---|---|---|---|---|---|
| Quadrant | DetID | PixID | Counts | Sigma | Mean | Median | Sigma |
| A | 13 | 248 | 3460540 | 5345.32 | 2651 | 2587 | 646.9 |
| A | 12 | 3 | 1845666 | 2849.04 | 2651 | 2587 | 646.9 |
| A | 15 | 174 | 1564662 | 2414.66 | 2651 | 2587 | 646.9 |
| B | 4 | 206 | 2612109 | 4597.8 | 2648 | 2550 | 567.6 |
| B | 10 | 44 | 2541811 | 4473.95 | 2648 | 2550 | 567.6 |
| B | 10 | 128 | 2370098 | 4171.4 | 2648 | 2550 | 567.6 |
| C | 13 | 3 | 1430642 | 1984.02 | 2631 | 2612 | 719.8 |
| C | 10 | 22 | 709855 | 982.6 | 2631 | 2612 | 719.8 |
| C | 15 | 192 | 494670 | 683.64 | 2631 | 2612 | 719.8 |
| D | 11 | 129 | 10672957 | 15835.38 | 2441 | 2353 | 673.8 |
| D | 0 | 18 | 1082023 | 1602.25 | 2441 | 2353 | 673.8 |
| D | 3 | 12 | 1054218 | 1560.99 | 2441 | 2353 | 673.8 |
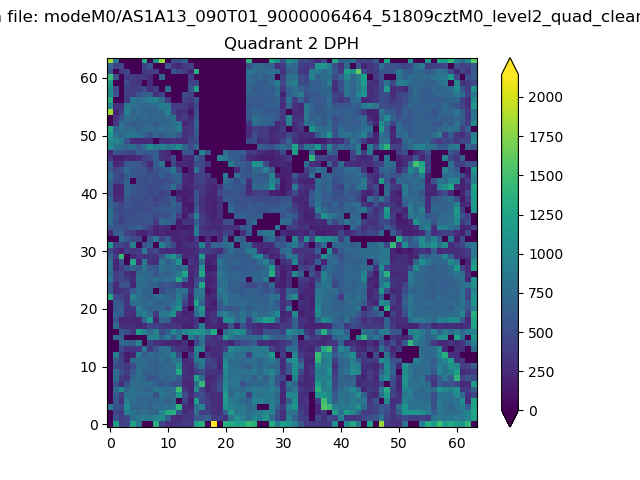
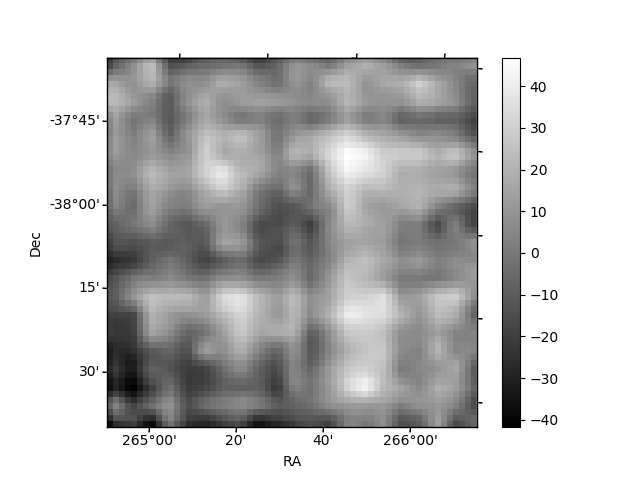
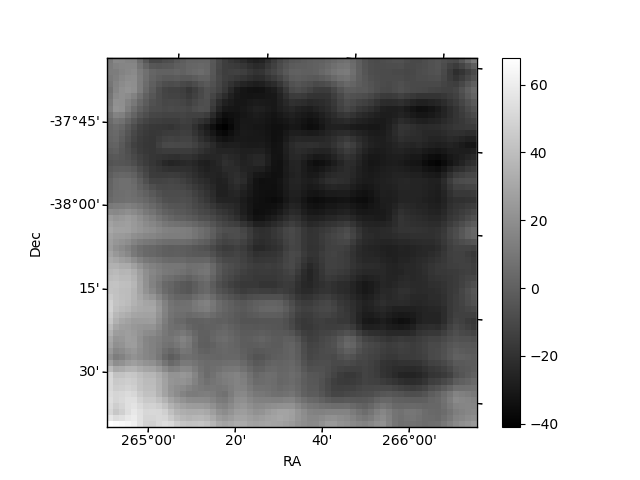
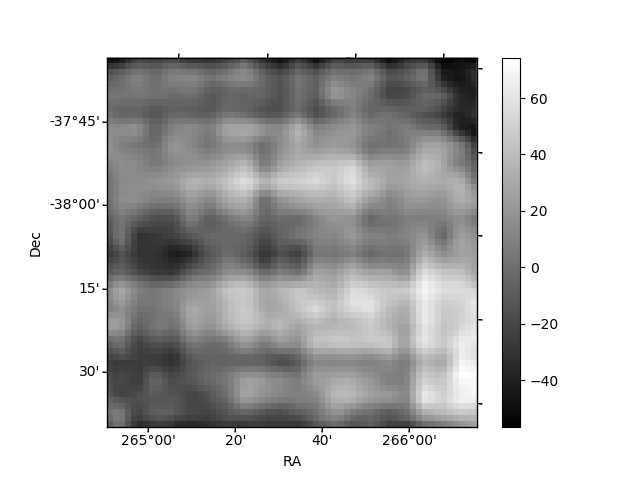
Histogram calculated using DETX and DETY for each event in the final _common_clean file
| Quadrant A | 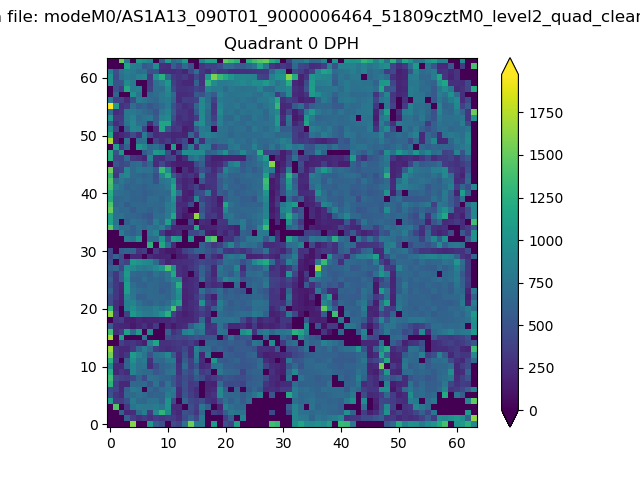 |
 |
Quadrant B |
|---|---|---|---|
| Quadrant D | 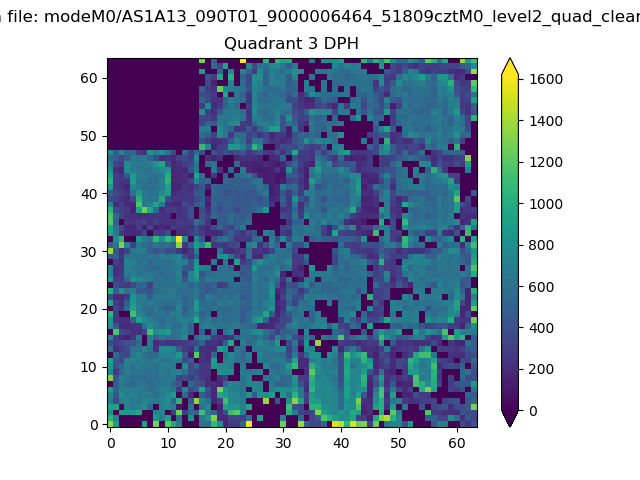 |
 |
Quadrant C |
| Plot type | Count rate plots | Images |
|---|---|---|
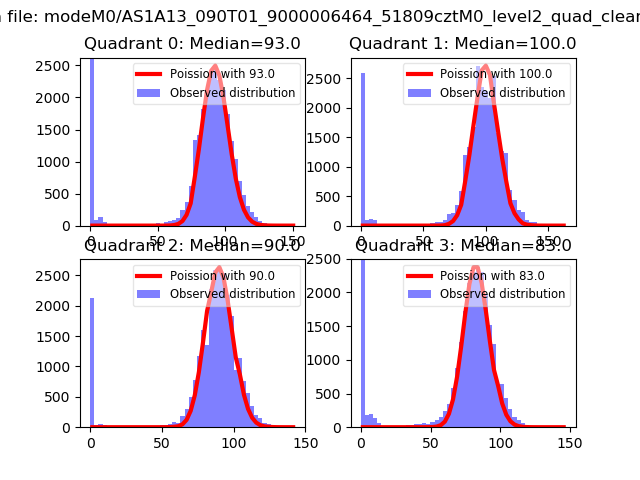
| Comparison with Poisson distribution Blue bars denote a histogram of data divided into 1 sec bins. Red curve is a Poisson curve with rate = median count rate of data. |
 |
 |
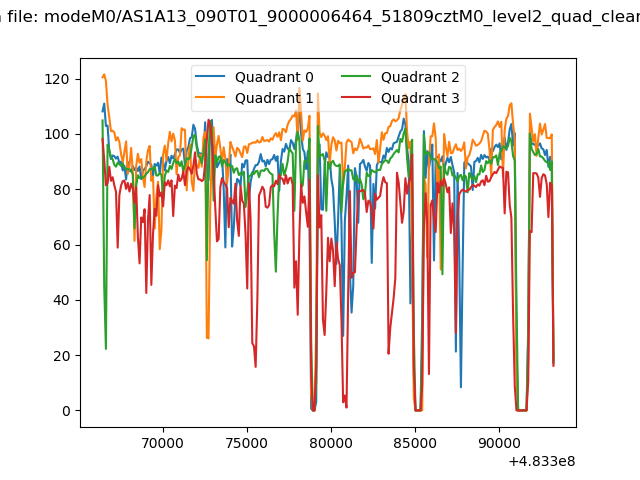
| Quadrant-wise count rates Data is divided into 100 sec bins |
 |
|
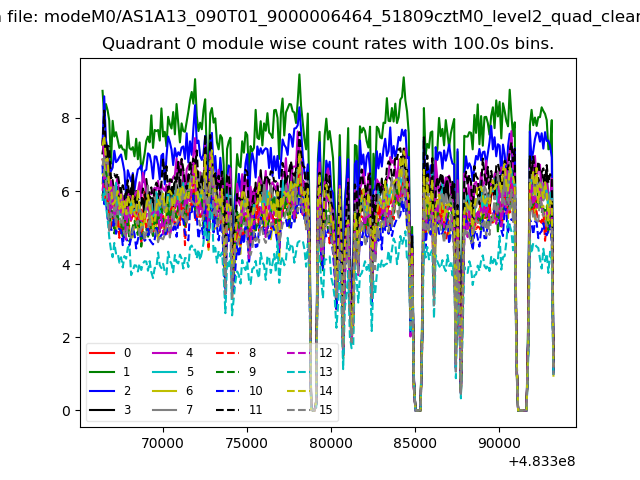
| Module-wise count rates for Quadrant A Data is divided into 100 sec bins |
 |
 |
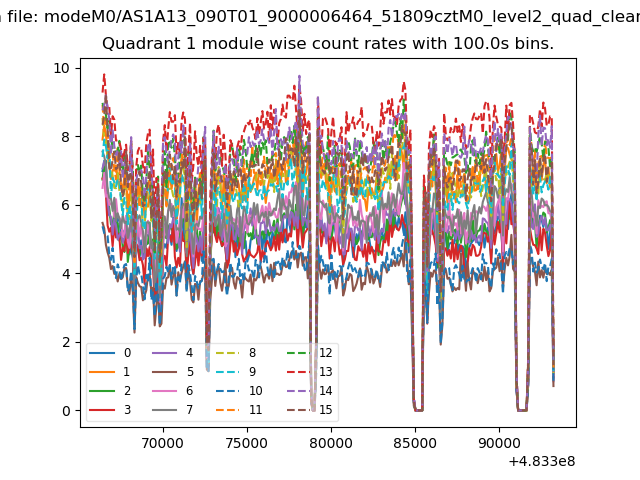
| Module-wise count rates for Quadrant B Data is divided into 100 sec bins |
 |
 |
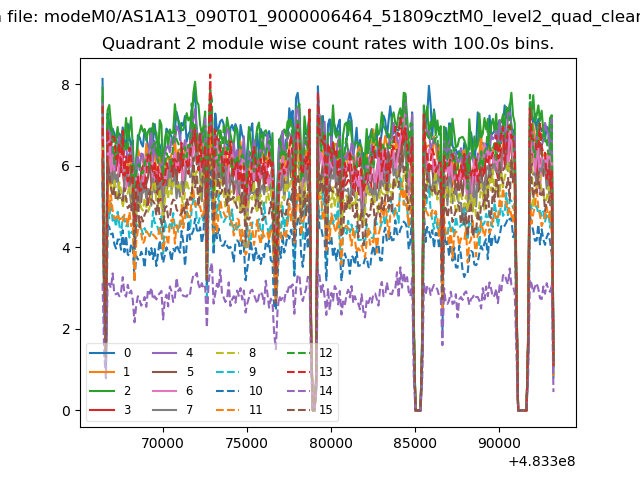
| Module-wise count rates for Quadrant C Data is divided into 100 sec bins |
 |
 |
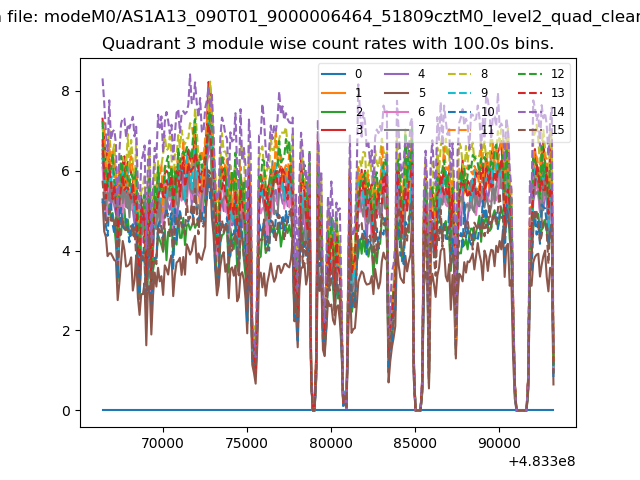
| Module-wise count rates for Quadrant D Data is divided into 100 sec bins |
 |
 |
| Parameter | Plot |
|---|---|
| CZT HV Monitor | 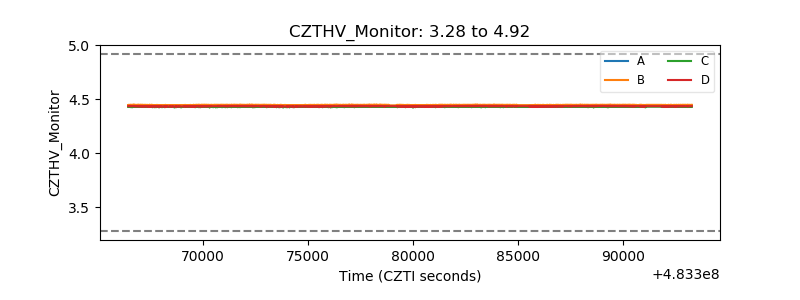 |
| D_VDD | 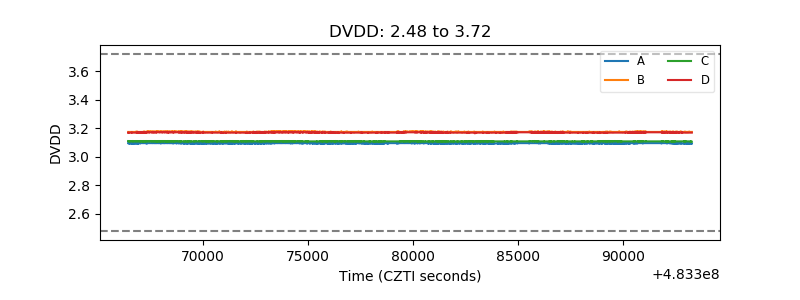 |
| Temperature 1 | 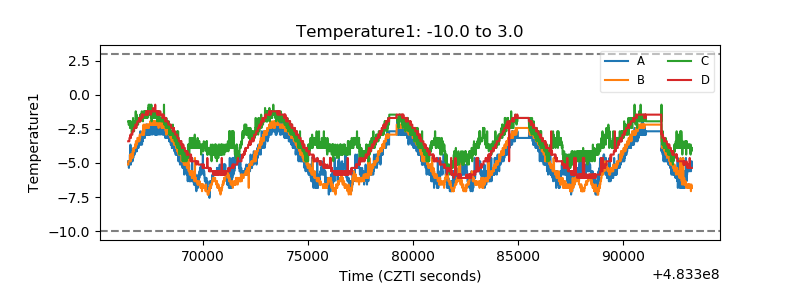 |
| Veto HV Monitor | 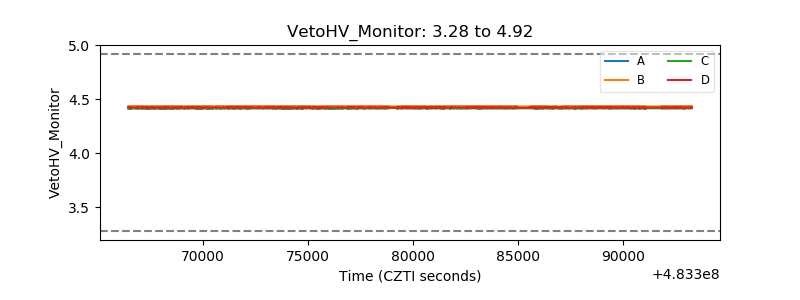 |
| Veto LLD | 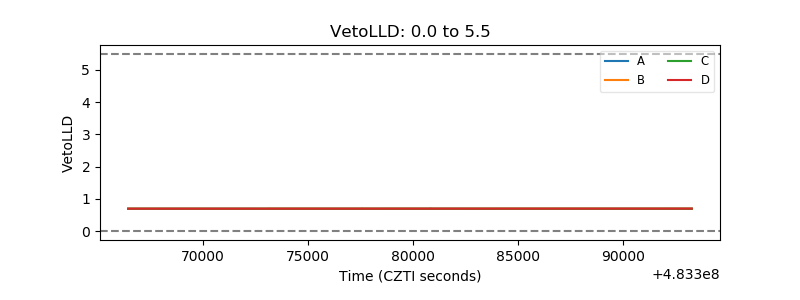 |
| Alpha Counter | 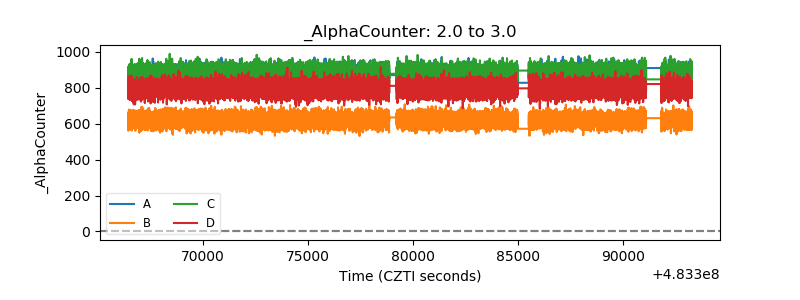 |
| _CPM_Rate | 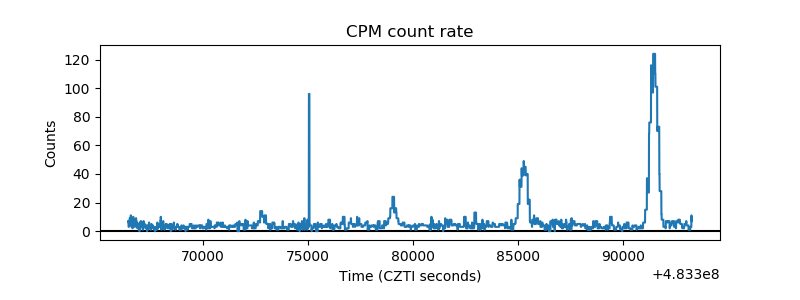 |
| CZT Counter | 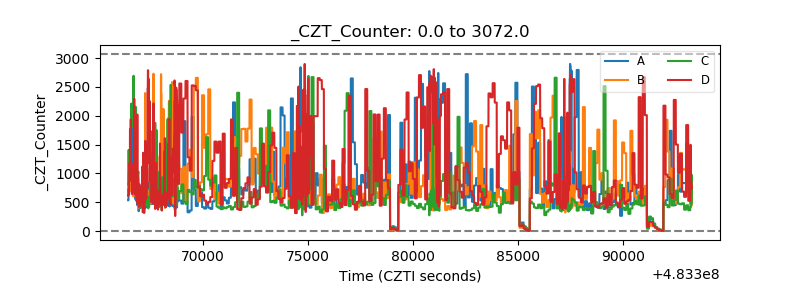 |
| +2.5 Volts monitor |  |
| +5 Volts monitor | 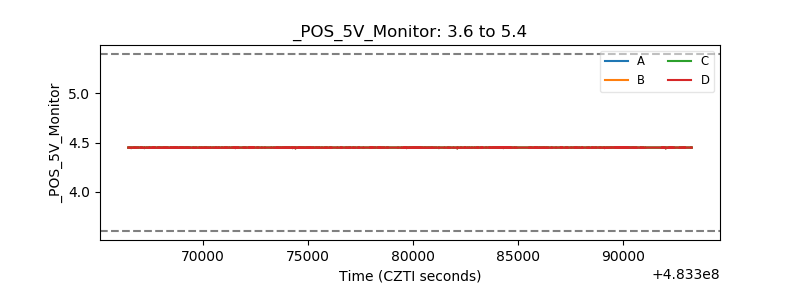 |
| _ROLL_ROT | 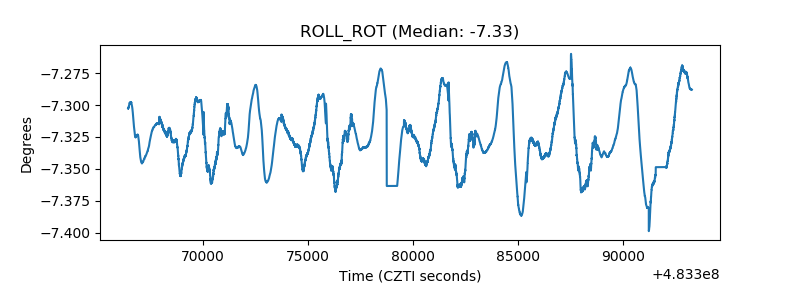 |
| _Roll_DEC | 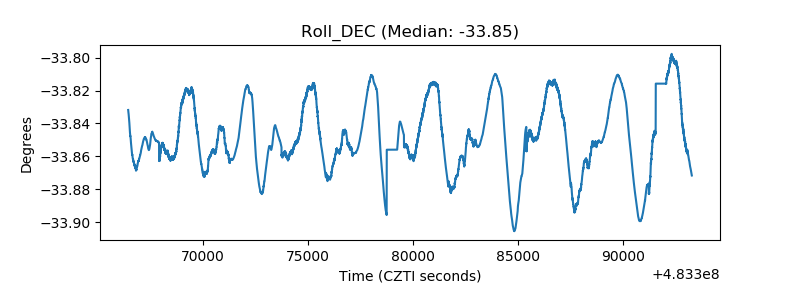 |
| _Roll_RA | 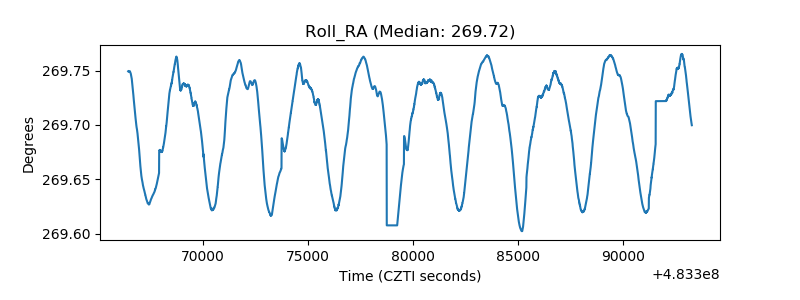 |
| Veto Counter | 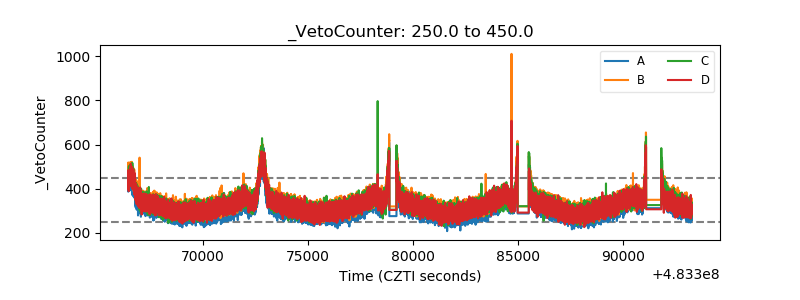 |