| Param | Original file | Final file |
|---|---|---|
| Filename | modeM0/AS1A13_090T01_9000006464_51810cztM0_level2.fits | modeM0/AS1A13_090T01_9000006464_51810cztM0_level2_quad_clean.evt |
| Size (bytes) | 566,161,920 | 96,543,360 |
| Size | 539.9 MB | 92.1 MB |
| Events in quadrant A | 5,976,697 | 616,343 |
| Events in quadrant B | 4,556,371 | 679,840 |
| Events in quadrant C | 3,928,169 | 605,447 |
| Events in quadrant D | 5,970,503 | 547,940 |
| Mode M9 | |||
|---|---|---|---|
| Quadrant | BADHDUFLAG | Total packets | Discarded packets |
| A | 0 | 9 | 0 |
| B | 0 | 9 | 0 |
| C | 0 | 9 | 0 |
| D | 0 | 9 | 0 |
| Mode SS | |||
|---|---|---|---|
| Quadrant | BADHDUFLAG | Total packets | Discarded packets |
| A | 0 | 140 | 0 |
| B | 0 | 140 | 0 |
| C | 0 | 140 | 0 |
| D | 0 | 140 | 0 |
| Mode M0 | |||
|---|---|---|---|
| Quadrant | BADHDUFLAG | Total packets | Discarded packets |
| A | 0 | 22441 | 2 |
| B | 0 | 18220 | 2 |
| C | 0 | 16565 | 2 |
| D | 0 | 22459 | 2 |
| Quadrant | Total seconds | Saturated seconds | Saturation percentage |
|---|---|---|---|
| A | 6787 | 329 | 4.847503% |
| B | 6788 | 220 | 3.241014% |
| C | 6788 | 175 | 2.578079% |
| D | 6788 | 461 | 6.791397% |
Noise dominated data is calculated using 1-second bins in cleaned event files. If a bin has >2000 counts, and if more than 50% of those come from <1% of pixels, then it is considered to be noise-dominated and hence unusable.
| Quadrant | # 1 sec bins | Bins with >0 counts | Bins with >2000 counts | High rate bins dominated by noise | Noise dominated (total time) | Noise dominated (detector-on time) | Marked lightcurve |
|---|---|---|---|---|---|---|---|
| A | 7732 | 6788 | 282 | 282 | 3.65% | 4.15% | 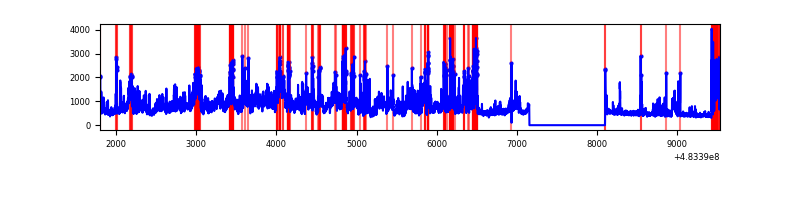 |
| B | 7733 | 6789 | 82 | 82 | 1.06% | 1.21% | 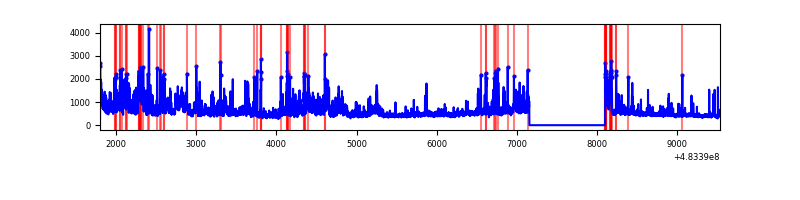 |
| C | 7733 | 6789 | 152 | 152 | 1.97% | 2.24% | 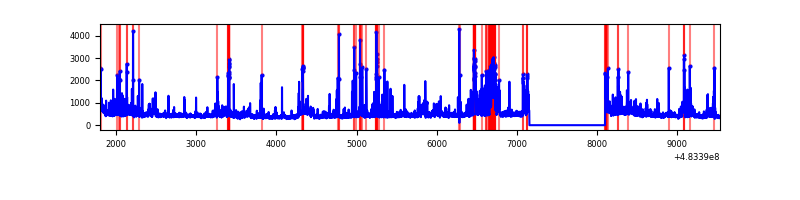 |
| D | 7733 | 6789 | 442 | 442 | 5.72% | 6.51% | 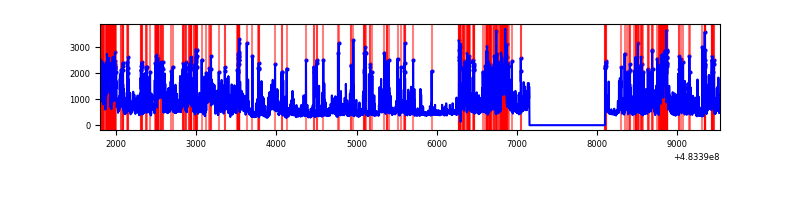 |
Top three noisy pixels from each quadrant. If the there are fewer than three noisy pixels in the level2.evt file, extra rows are filled as -1
| Pixel properties | Quadrant properties | ||||||
|---|---|---|---|---|---|---|---|
| Quadrant | DetID | PixID | Counts | Sigma | Mean | Median | Sigma |
| A | 15 | 174 | 1148767 | 6604.68 | 707 | 688 | 173.8 |
| A | 12 | 3 | 1092885 | 6283.2 | 707 | 688 | 173.8 |
| A | 4 | 175 | 478539 | 2748.99 | 707 | 688 | 173.8 |
| B | 10 | 128 | 332849 | 2166.19 | 713 | 688 | 153.3 |
| B | 4 | 81 | 313869 | 2042.41 | 713 | 688 | 153.3 |
| B | 10 | 44 | 249122 | 1620.16 | 713 | 688 | 153.3 |
| C | 12 | 254 | 381669 | 1961.77 | 699 | 693 | 194.2 |
| C | 13 | 3 | 100106 | 511.91 | 699 | 693 | 194.2 |
| C | 15 | 192 | 96386 | 492.75 | 699 | 693 | 194.2 |
| D | 11 | 129 | 1117772 | 5812.24 | 678 | 651 | 192.2 |
| D | 10 | 199 | 803398 | 4176.59 | 678 | 651 | 192.2 |
| D | 3 | 12 | 730860 | 3799.18 | 678 | 651 | 192.2 |
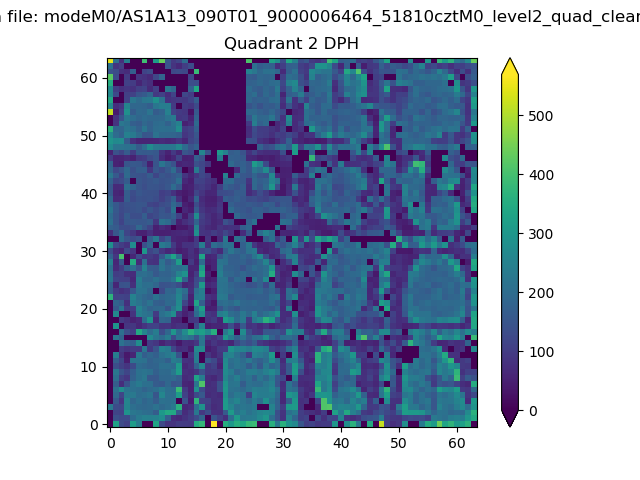
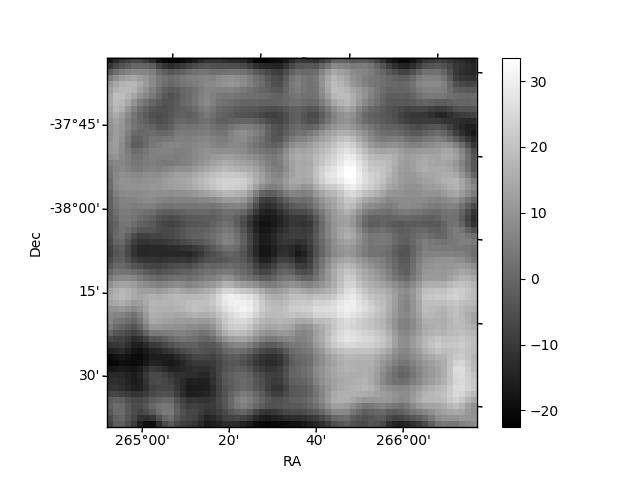
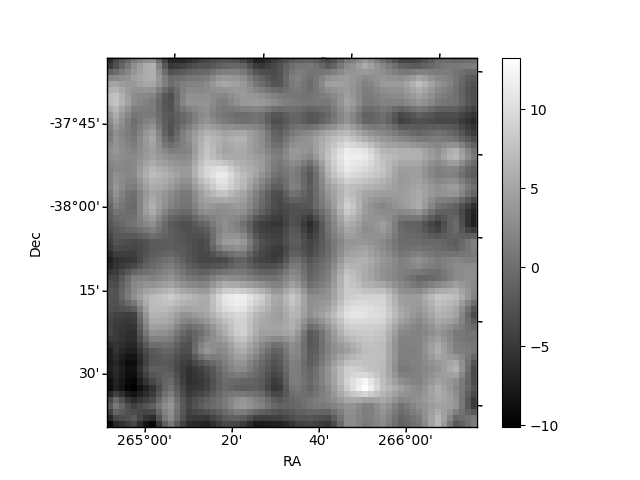
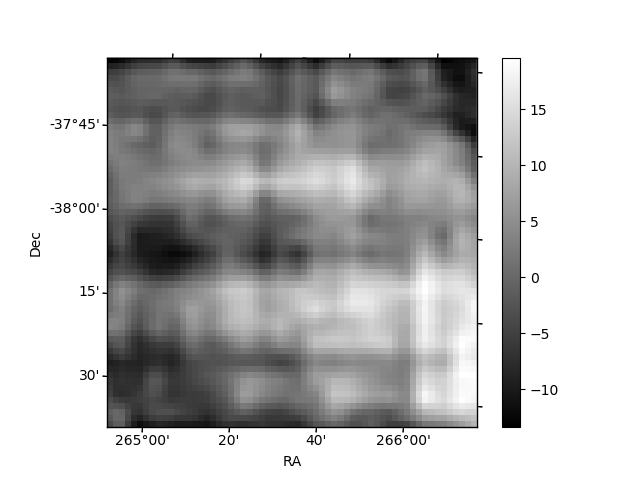
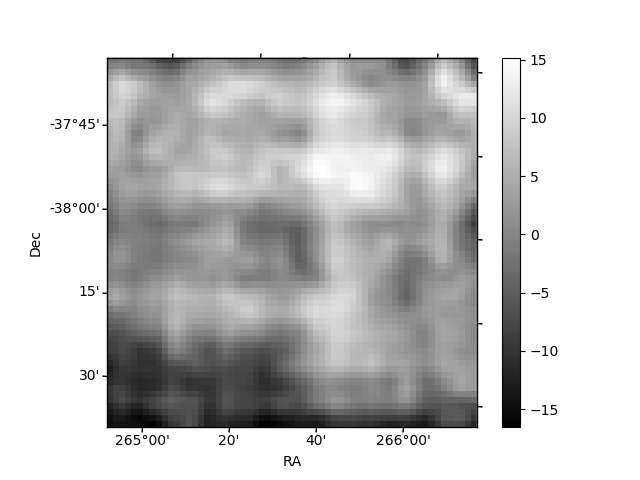
Histogram calculated using DETX and DETY for each event in the final _common_clean file
| Quadrant A | 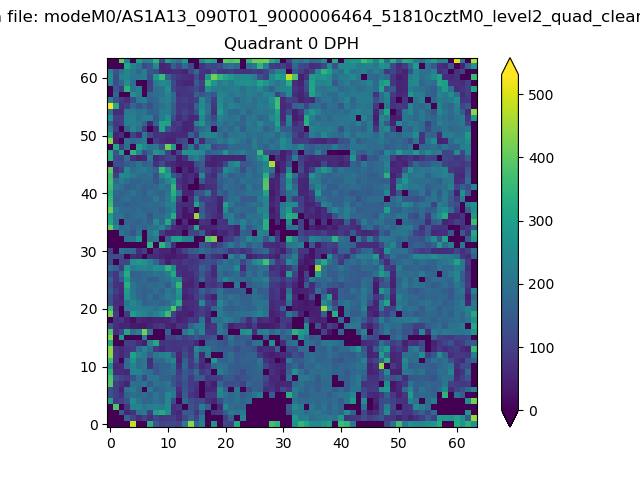 |
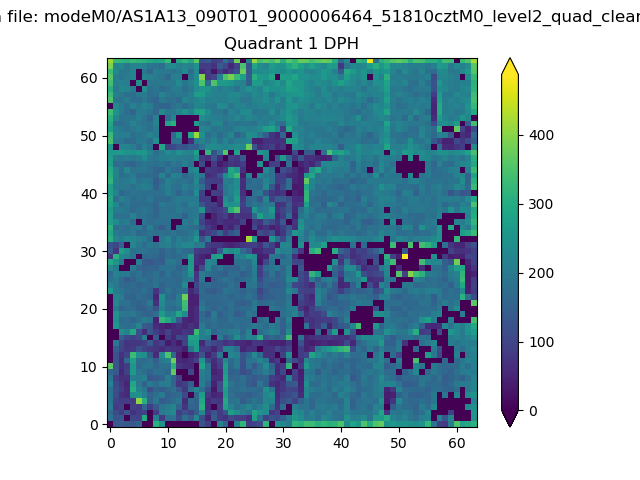 |
Quadrant B |
|---|---|---|---|
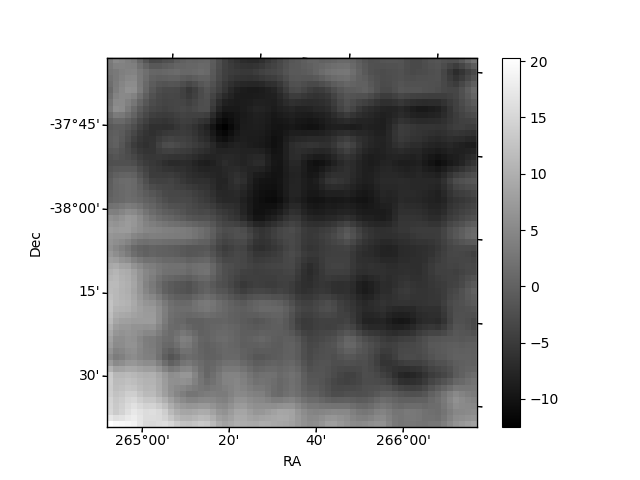
| Quadrant D | 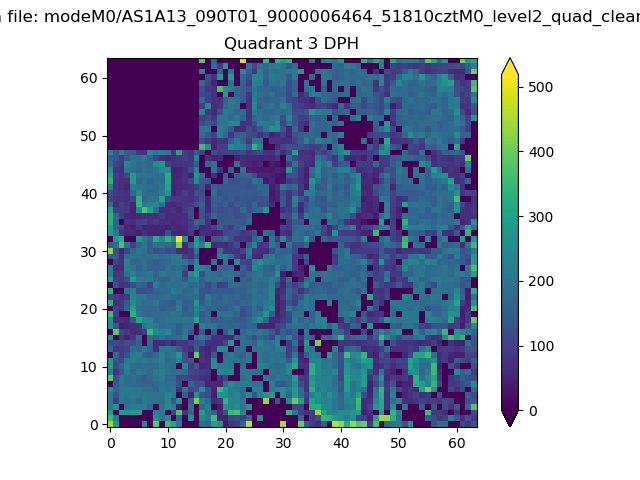 |
 |
Quadrant C |
| Plot type | Count rate plots | Images |
|---|---|---|
| Comparison with Poisson distribution Blue bars denote a histogram of data divided into 1 sec bins. Red curve is a Poisson curve with rate = median count rate of data. |
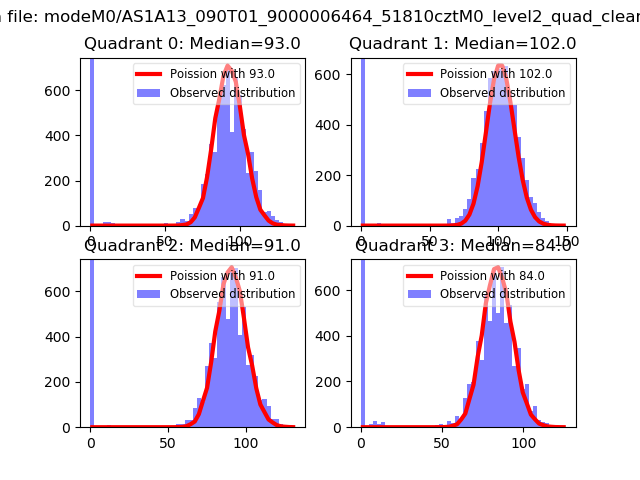 |
 |
| Quadrant-wise count rates Data is divided into 100 sec bins |
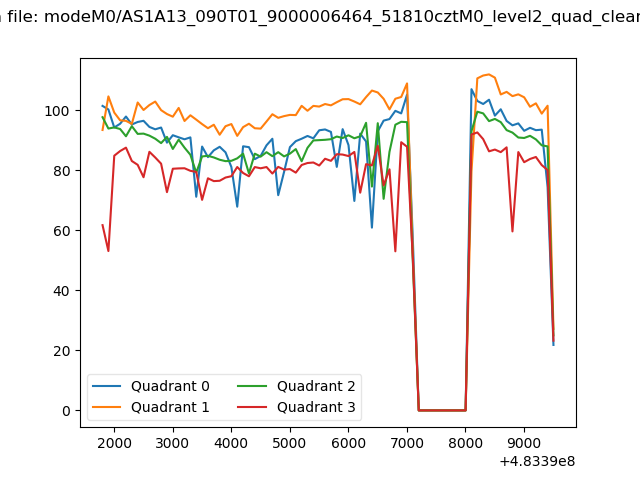 |
|
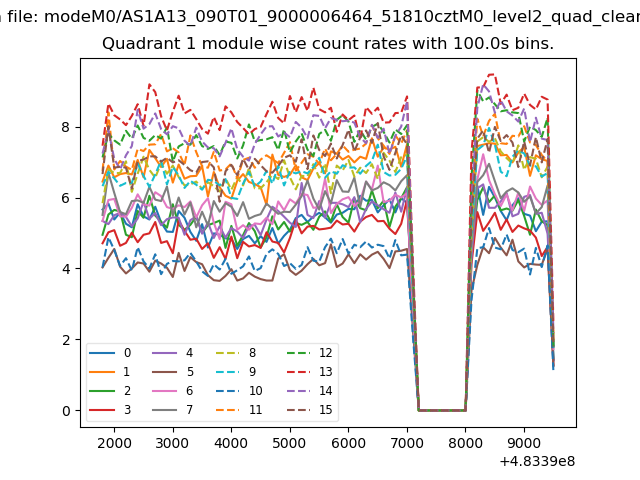
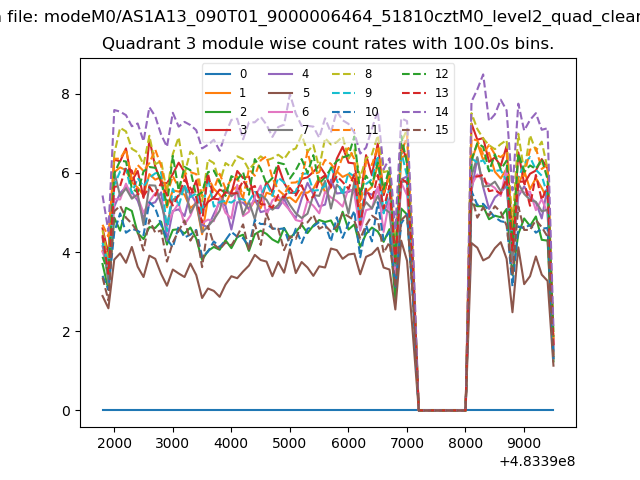
| Module-wise count rates for Quadrant A Data is divided into 100 sec bins |
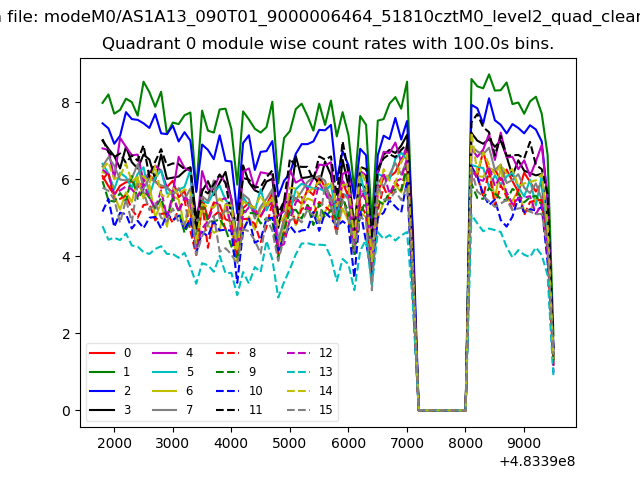 |
 |
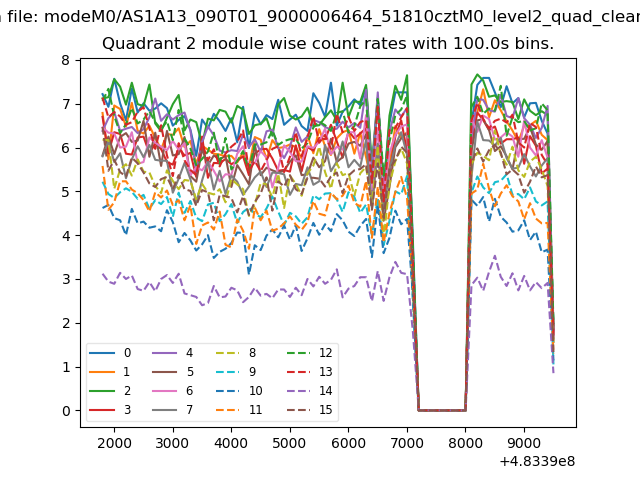
| Module-wise count rates for Quadrant B Data is divided into 100 sec bins |
 |
 |
| Module-wise count rates for Quadrant C Data is divided into 100 sec bins |
 |
 |
| Module-wise count rates for Quadrant D Data is divided into 100 sec bins |
 |
 |
| Parameter | Plot |
|---|---|
| CZT HV Monitor | 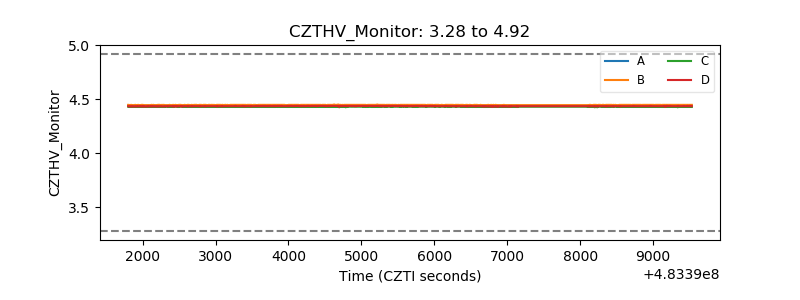 |
| D_VDD | 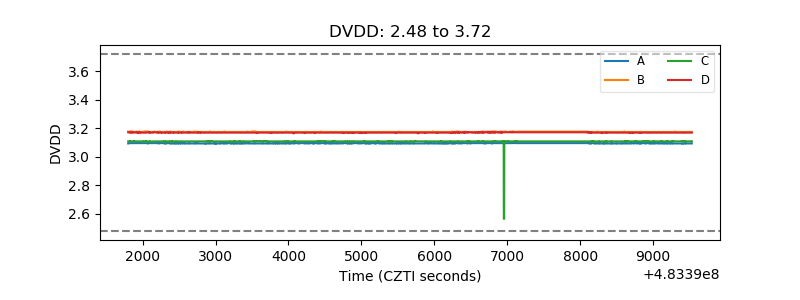 |
| Temperature 1 | 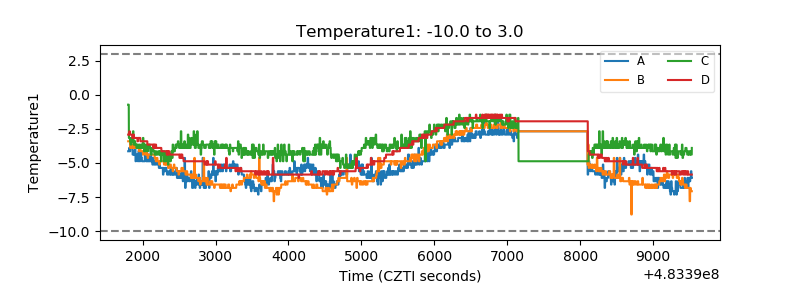 |
| Veto HV Monitor | 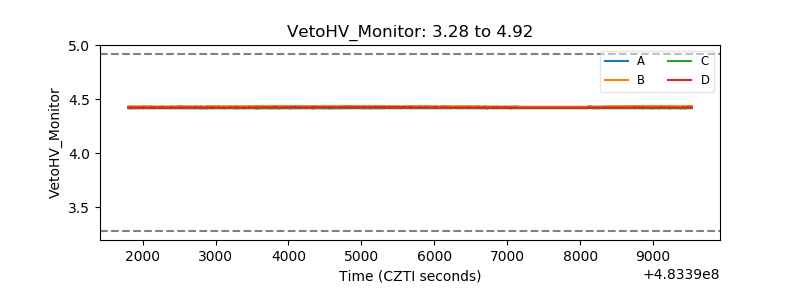 |
| Veto LLD | 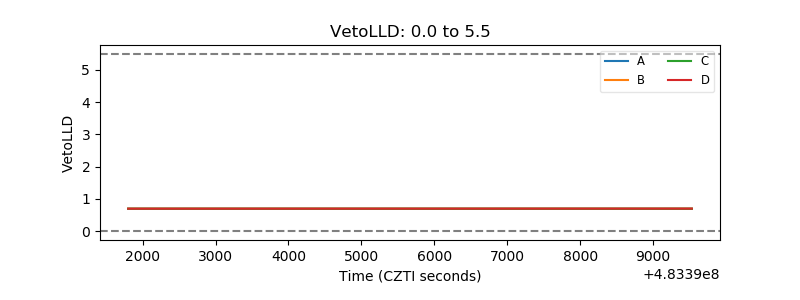 |
| Alpha Counter | 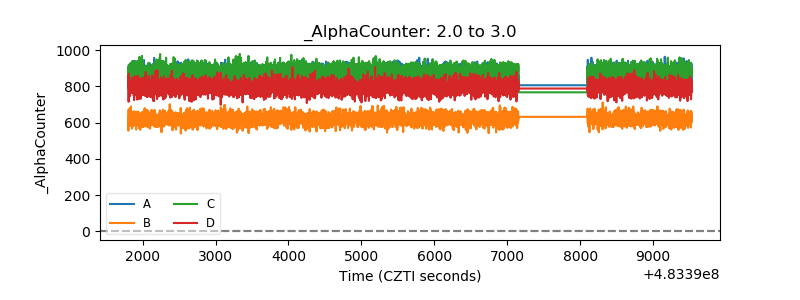 |
| _CPM_Rate | 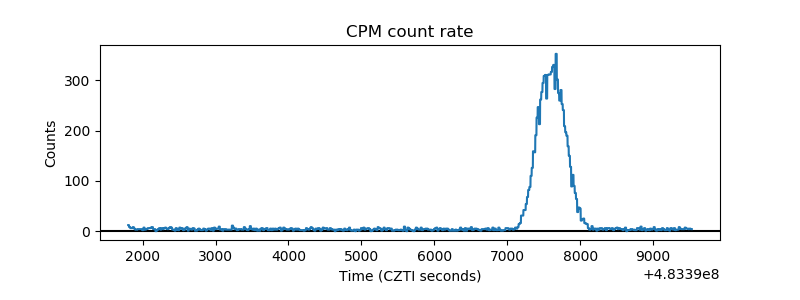 |
| CZT Counter | 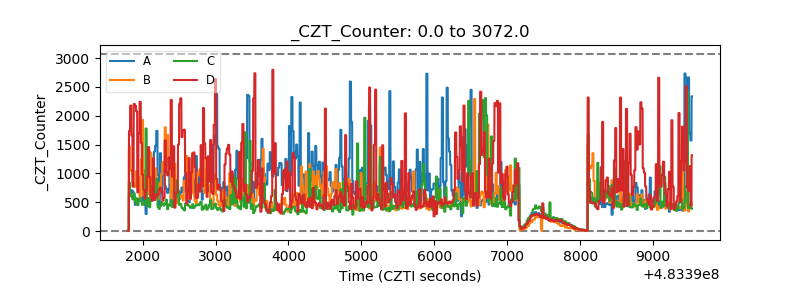 |
| +2.5 Volts monitor | 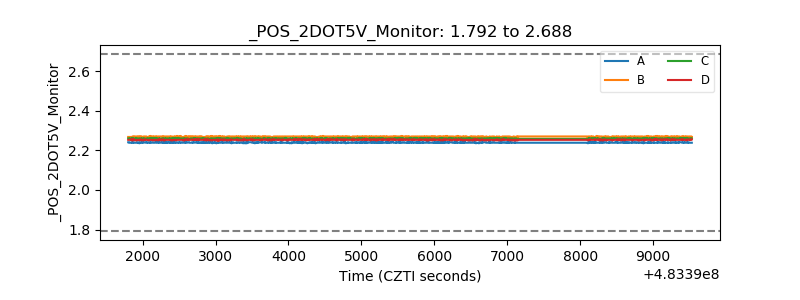 |
| +5 Volts monitor | 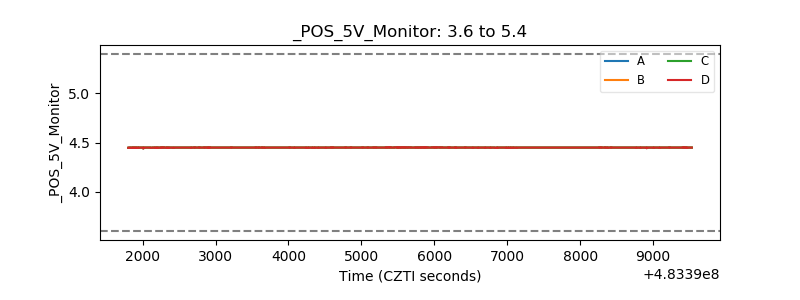 |
| _ROLL_ROT | 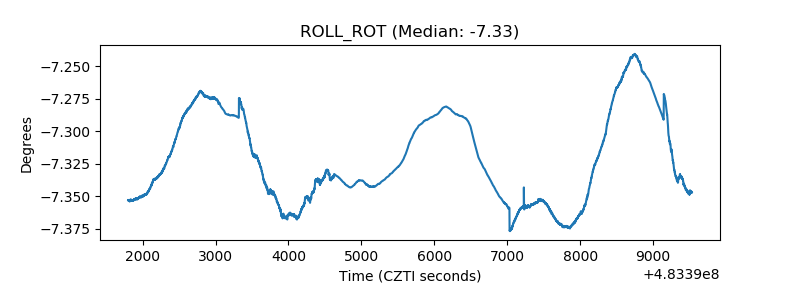 |
| _Roll_DEC | 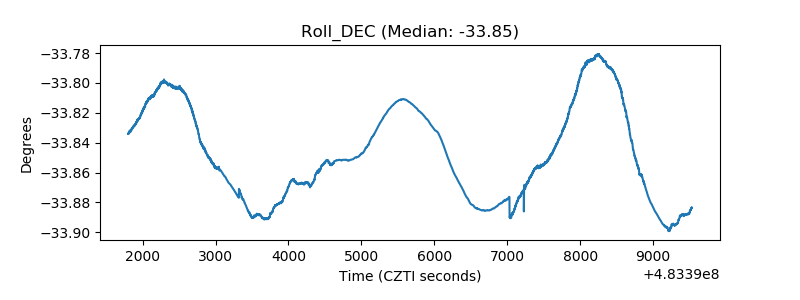 |
| _Roll_RA | 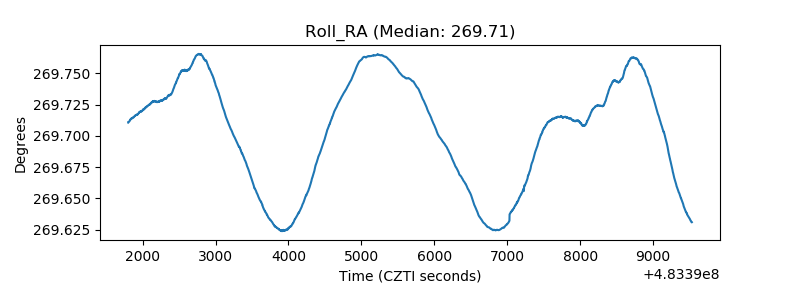 |
| Veto Counter | 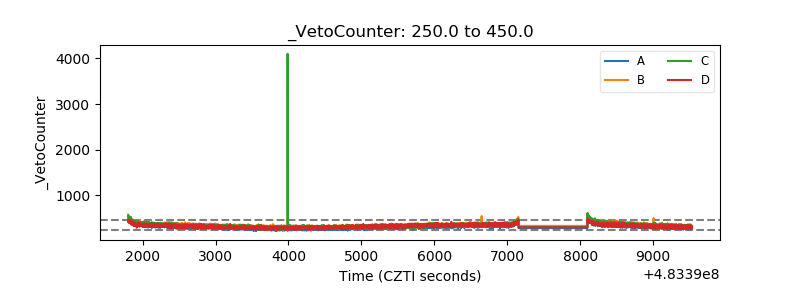 |