| Param | Original file | Final file |
|---|---|---|
| Filename | modeM0/AS1A13_090T01_9000006464_51812cztM0_level2.fits | modeM0/AS1A13_090T01_9000006464_51812cztM0_level2_quad_clean.evt |
| Size (bytes) | 652,573,440 | 102,130,560 |
| Size | 622.3 MB | 97.4 MB |
| Events in quadrant A | 5,550,523 | 669,300 |
| Events in quadrant B | 4,030,471 | 749,810 |
| Events in quadrant C | 4,190,844 | 663,561 |
| Events in quadrant D | 9,819,530 | 502,636 |
| Mode M9 | |||
|---|---|---|---|
| Quadrant | BADHDUFLAG | Total packets | Discarded packets |
| A | 0 | 20 | 0 |
| B | 0 | 20 | 0 |
| C | 0 | 20 | 0 |
| D | 0 | 20 | 0 |
| Mode SS | |||
|---|---|---|---|
| Quadrant | BADHDUFLAG | Total packets | Discarded packets |
| A | 0 | 148 | 0 |
| B | 0 | 148 | 0 |
| C | 0 | 148 | 0 |
| D | 0 | 148 | 0 |
| Mode M0 | |||
|---|---|---|---|
| Quadrant | BADHDUFLAG | Total packets | Discarded packets |
| A | 0 | 21477 | 3 |
| B | 0 | 17107 | 2 |
| C | 0 | 17687 | 2 |
| D | 0 | 34240 | 2 |
| Quadrant | Total seconds | Saturated seconds | Saturation percentage |
|---|---|---|---|
| A | 7288 | 341 | 4.678924% |
| B | 7288 | 187 | 2.565862% |
| C | 7288 | 177 | 2.428650% |
| D | 7289 | 1759 | 24.132254% |
Noise dominated data is calculated using 1-second bins in cleaned event files. If a bin has >2000 counts, and if more than 50% of those come from <1% of pixels, then it is considered to be noise-dominated and hence unusable.
| Quadrant | # 1 sec bins | Bins with >0 counts | Bins with >2000 counts | High rate bins dominated by noise | Noise dominated (total time) | Noise dominated (detector-on time) | Marked lightcurve |
|---|---|---|---|---|---|---|---|
| A | 9253 | 7290 | 287 | 287 | 3.10% | 3.94% | 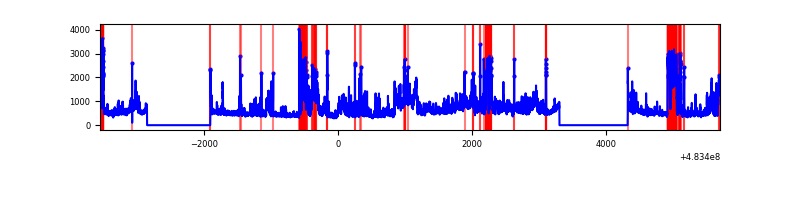 |
| B | 9253 | 7290 | 61 | 61 | 0.66% | 0.84% | 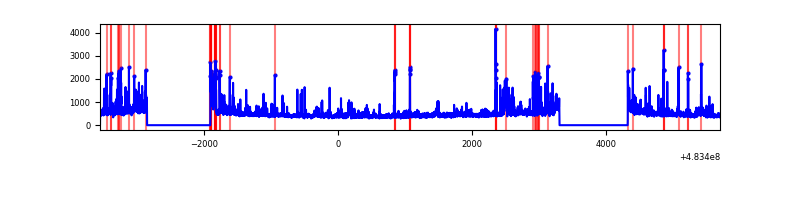 |
| C | 9253 | 7290 | 151 | 151 | 1.63% | 2.07% | 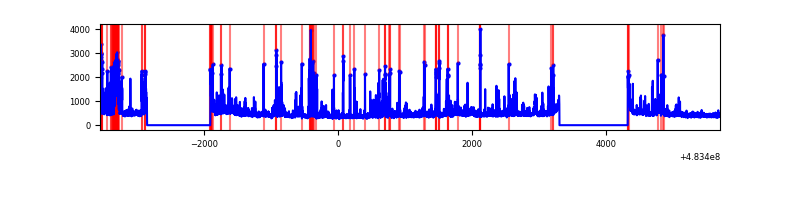 |
| D | 9254 | 7291 | 1638 | 1638 | 17.70% | 22.47% | 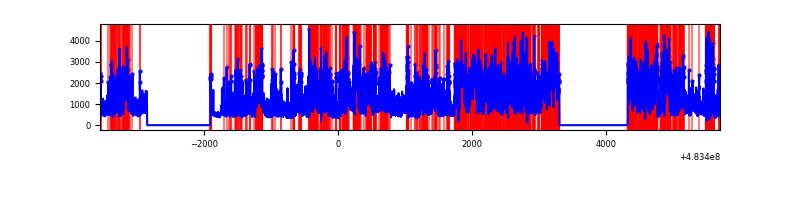 |
Top three noisy pixels from each quadrant. If the there are fewer than three noisy pixels in the level2.evt file, extra rows are filled as -1
| Pixel properties | Quadrant properties | ||||||
|---|---|---|---|---|---|---|---|
| Quadrant | DetID | PixID | Counts | Sigma | Mean | Median | Sigma |
| A | 4 | 175 | 933585 | 4917.73 | 774 | 753 | 189.7 |
| A | 15 | 174 | 792290 | 4172.84 | 774 | 753 | 189.7 |
| A | 12 | 3 | 145619 | 763.71 | 774 | 753 | 189.7 |
| B | 0 | 171 | 215118 | 1276.6 | 784 | 756 | 167.9 |
| B | 0 | 213 | 141119 | 835.91 | 784 | 756 | 167.9 |
| B | 4 | 81 | 92415 | 545.86 | 784 | 756 | 167.9 |
| C | 12 | 254 | 426070 | 1992.46 | 772 | 768 | 213.5 |
| C | 13 | 3 | 219652 | 1025.43 | 772 | 768 | 213.5 |
| C | 14 | 254 | 81886 | 380.02 | 772 | 768 | 213.5 |
| D | 11 | 129 | 4891521 | 25400.88 | 682 | 657 | 192.5 |
| D | 0 | 18 | 1149623 | 5967.2 | 682 | 657 | 192.5 |
| D | 3 | 12 | 612755 | 3178.95 | 682 | 657 | 192.5 |
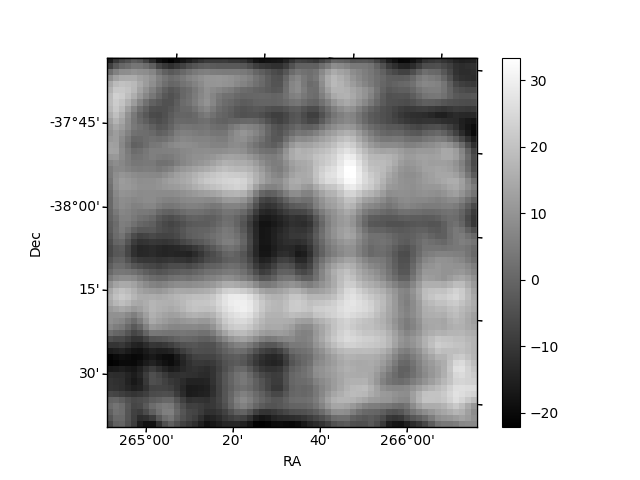
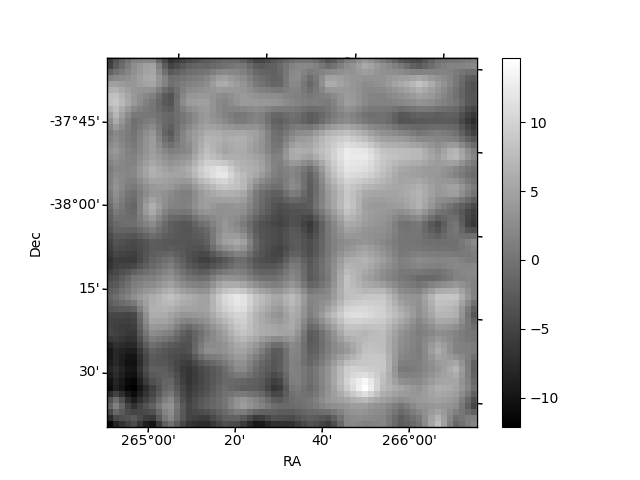
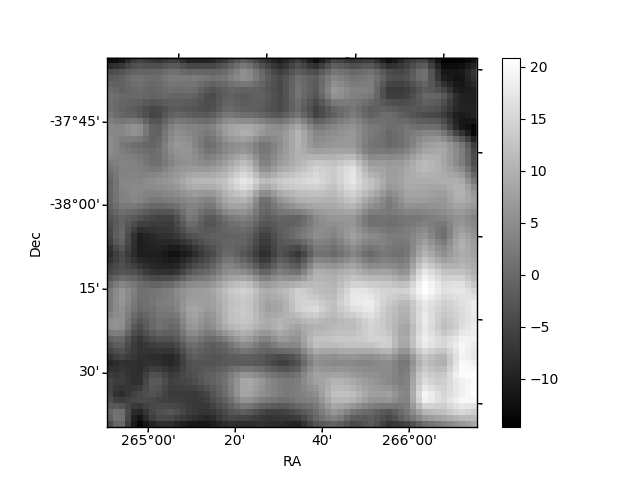
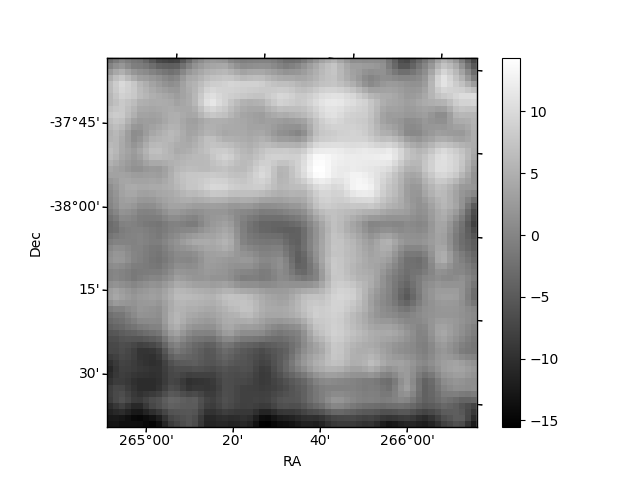
Histogram calculated using DETX and DETY for each event in the final _common_clean file
| Quadrant A | 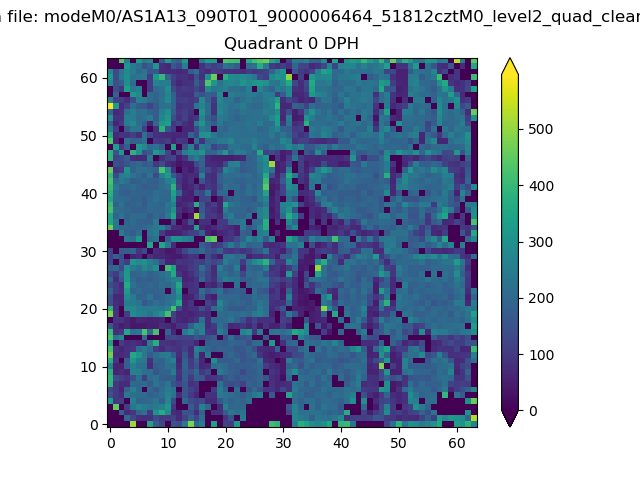 |
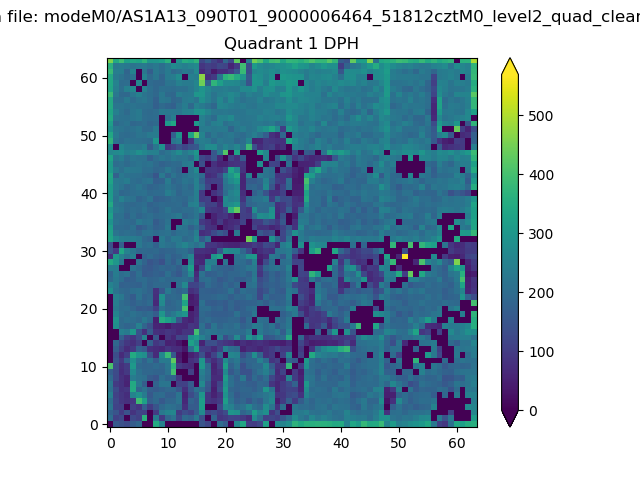 |
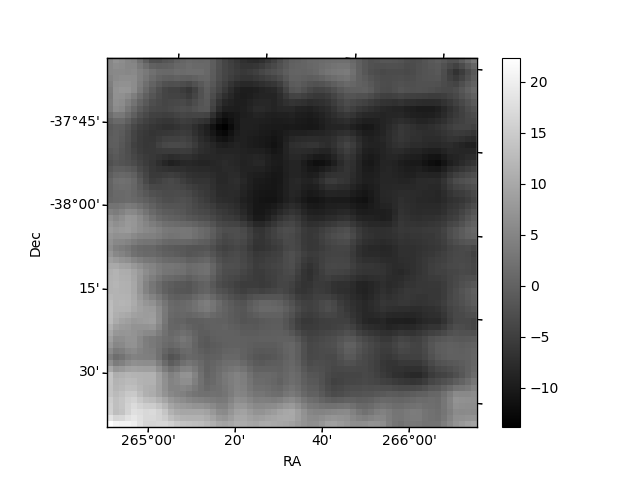
Quadrant B |
|---|---|---|---|
| Quadrant D | 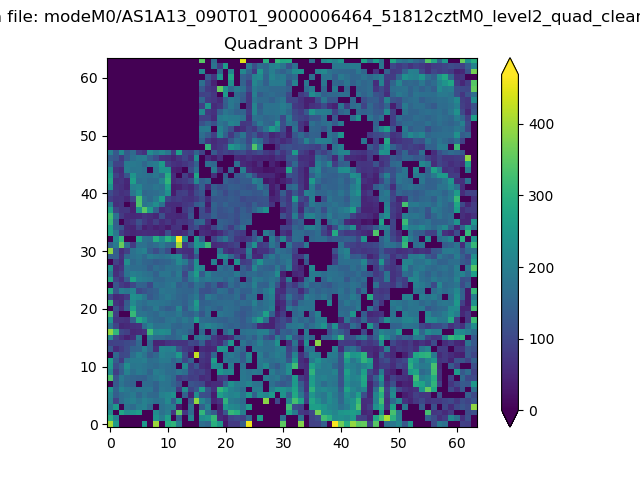 |
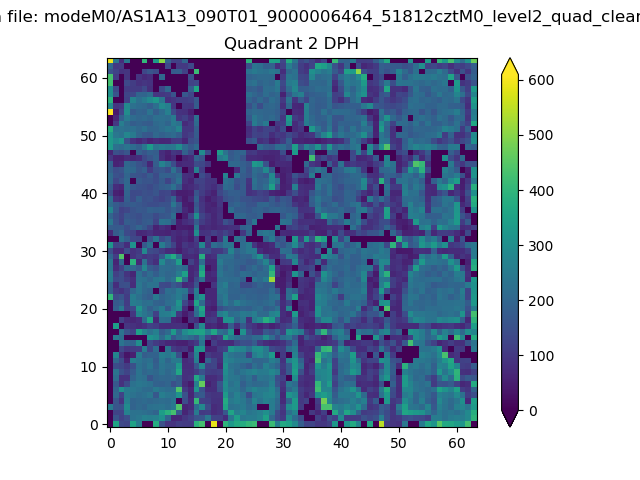 |
Quadrant C |
| Plot type | Count rate plots | Images |
|---|---|---|
| Comparison with Poisson distribution Blue bars denote a histogram of data divided into 1 sec bins. Red curve is a Poisson curve with rate = median count rate of data. |
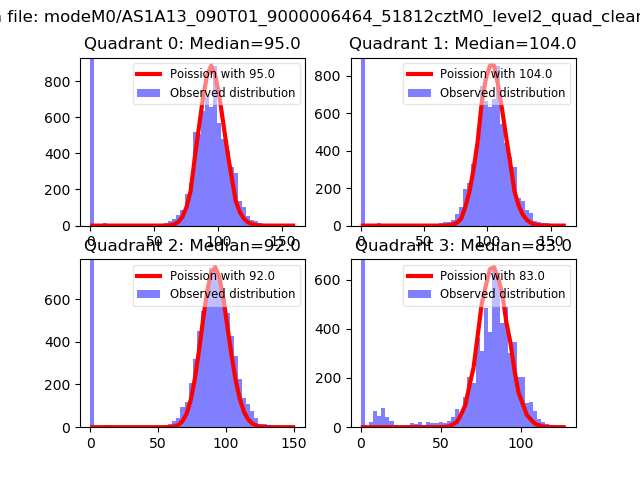 |
 |
| Quadrant-wise count rates Data is divided into 100 sec bins |
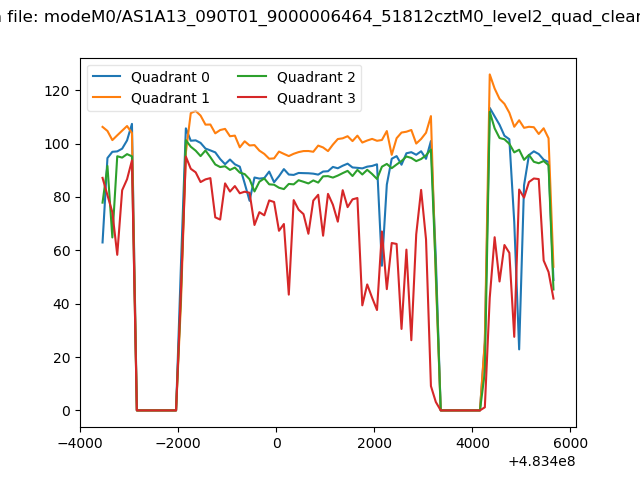 |
|
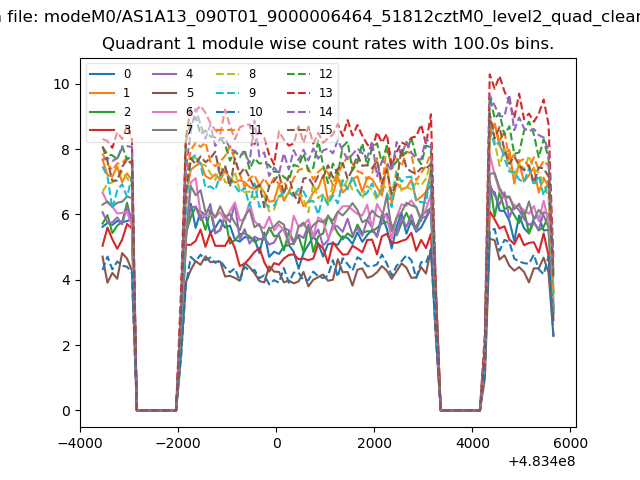
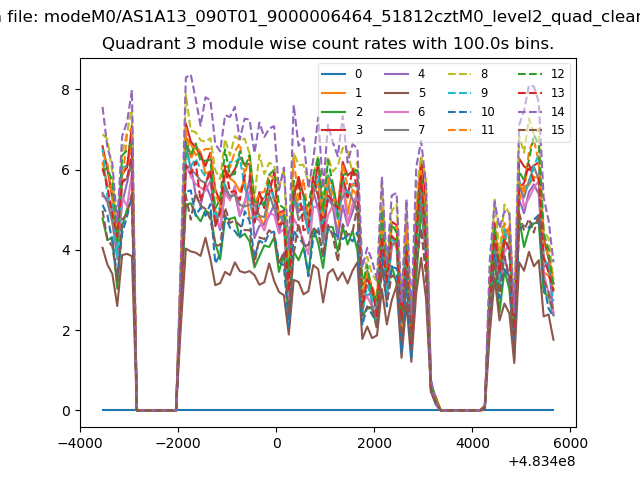
| Module-wise count rates for Quadrant A Data is divided into 100 sec bins |
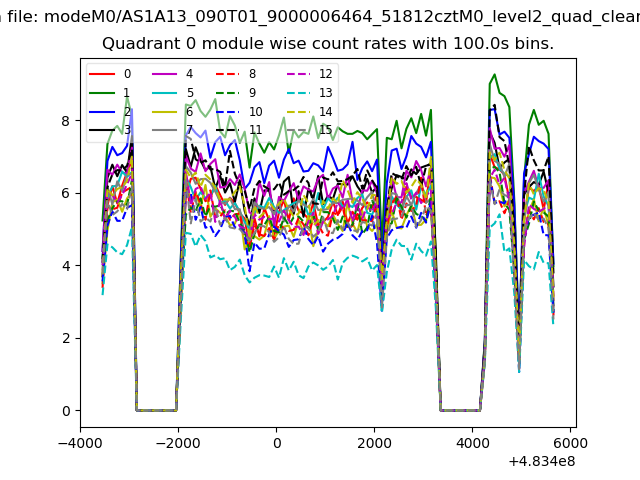 |
 |
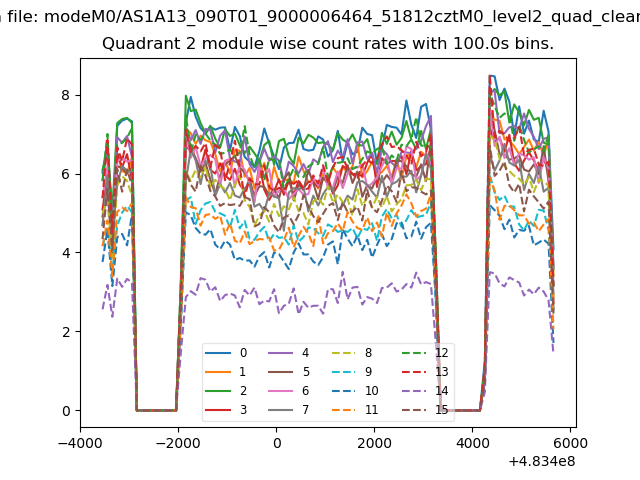
| Module-wise count rates for Quadrant B Data is divided into 100 sec bins |
 |
 |
| Module-wise count rates for Quadrant C Data is divided into 100 sec bins |
 |
 |
| Module-wise count rates for Quadrant D Data is divided into 100 sec bins |
 |
 |
| Parameter | Plot |
|---|---|
| CZT HV Monitor | 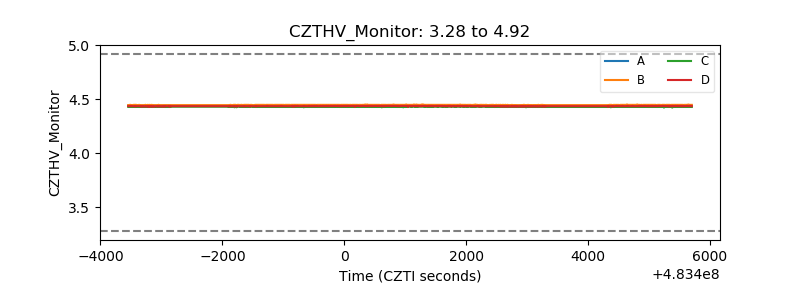 |
| D_VDD |  |
| Temperature 1 | 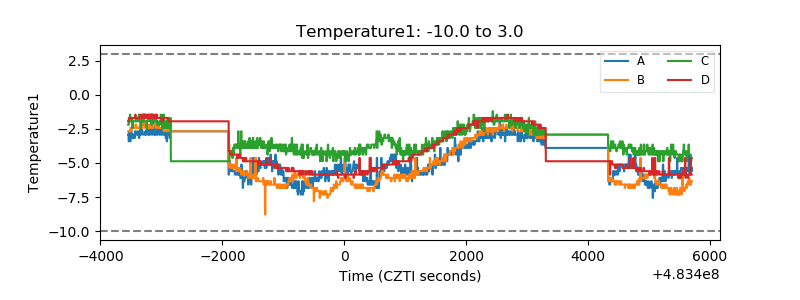 |
| Veto HV Monitor | 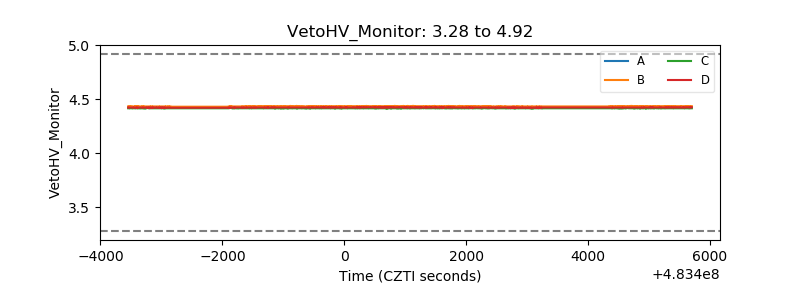 |
| Veto LLD | 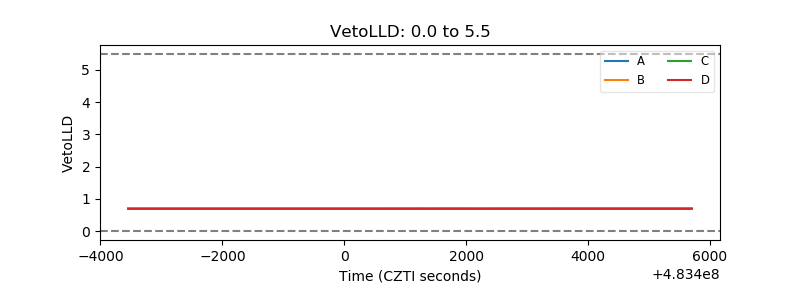 |
| Alpha Counter | 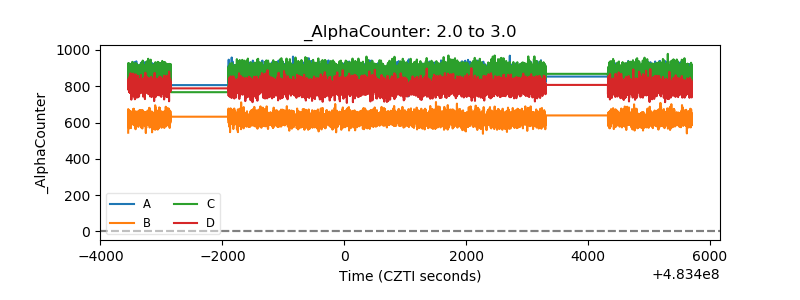 |
| _CPM_Rate | 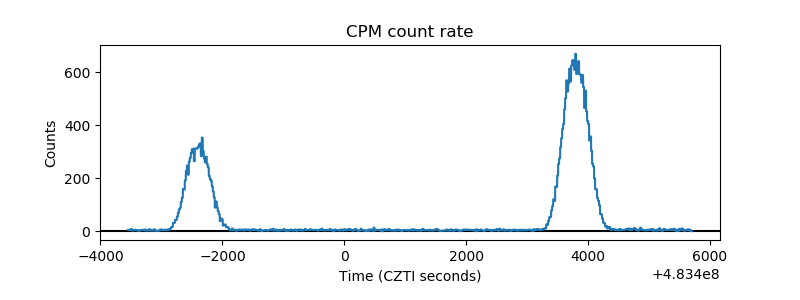 |
| CZT Counter | 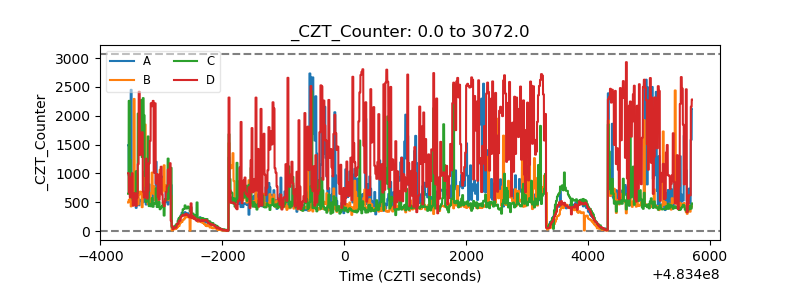 |
| +2.5 Volts monitor | 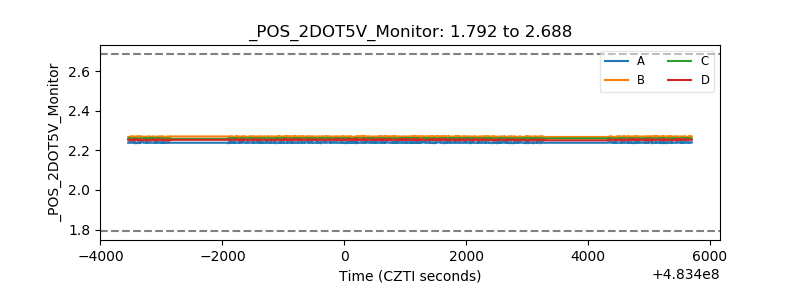 |
| +5 Volts monitor | 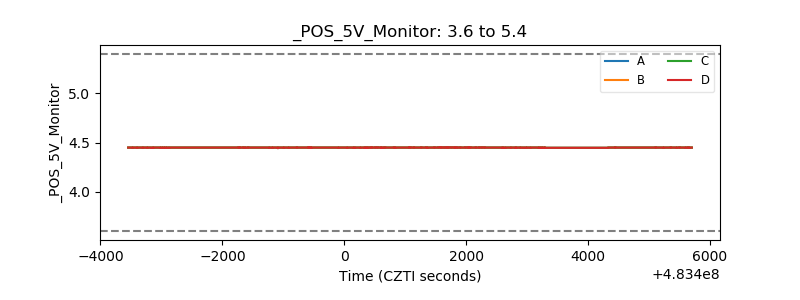 |
| _ROLL_ROT | 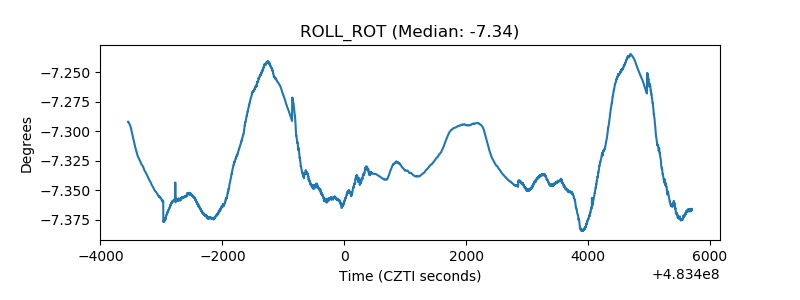 |
| _Roll_DEC | 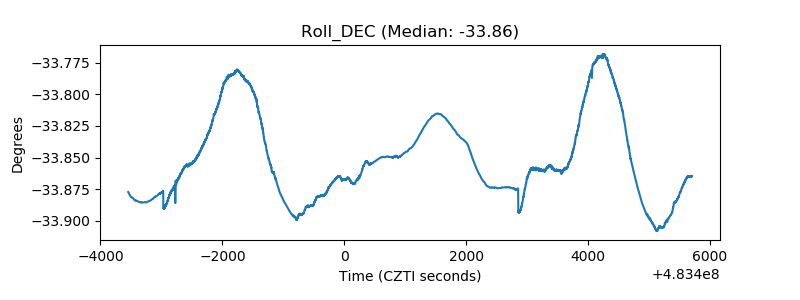 |
| _Roll_RA | 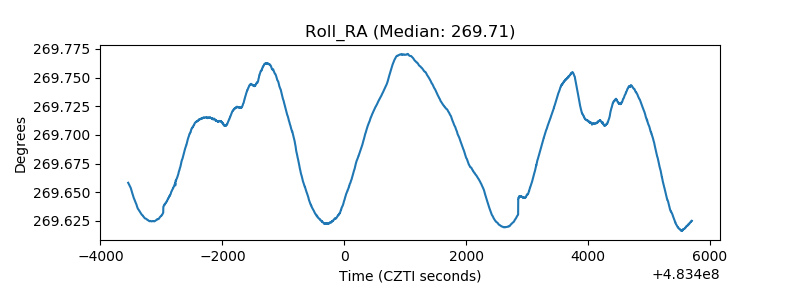 |
| Veto Counter | 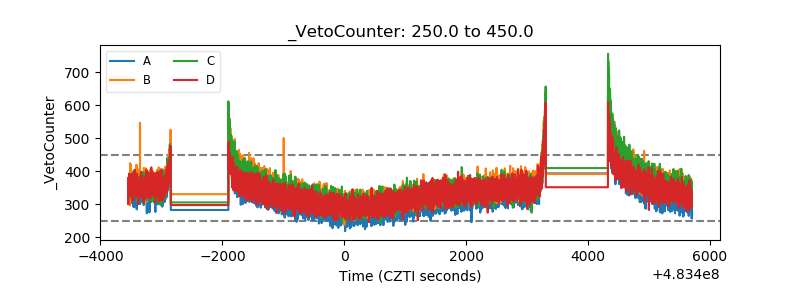 |