| Param | Original file | Final file |
|---|---|---|
| Filename | modeM0/AS1A13_090T01_9000006464_51813cztM0_level2.fits | modeM0/AS1A13_090T01_9000006464_51813cztM0_level2_quad_clean.evt |
| Size (bytes) | 537,940,800 | 99,705,600 |
| Size | 513.0 MB | 95.1 MB |
| Events in quadrant A | 4,582,831 | 647,491 |
| Events in quadrant B | 3,741,833 | 725,873 |
| Events in quadrant C | 3,997,031 | 640,937 |
| Events in quadrant D | 7,056,220 | 524,562 |
| Mode M9 | |||
|---|---|---|---|
| Quadrant | BADHDUFLAG | Total packets | Discarded packets |
| A | 0 | 21 | 0 |
| B | 0 | 21 | 0 |
| C | 0 | 21 | 0 |
| D | 0 | 21 | 0 |
| Mode SS | |||
|---|---|---|---|
| Quadrant | BADHDUFLAG | Total packets | Discarded packets |
| A | 0 | 142 | 0 |
| B | 0 | 142 | 0 |
| C | 0 | 142 | 0 |
| D | 0 | 142 | 0 |
| Mode M0 | |||
|---|---|---|---|
| Quadrant | BADHDUFLAG | Total packets | Discarded packets |
| A | 0 | 18173 | 3 |
| B | 0 | 15976 | 3 |
| C | 0 | 16611 | 3 |
| D | 0 | 25748 | 3 |
| Quadrant | Total seconds | Saturated seconds | Saturation percentage |
|---|---|---|---|
| A | 6888 | 285 | 4.137631% |
| B | 6889 | 125 | 1.814487% |
| C | 6889 | 181 | 2.627377% |
| D | 6889 | 1109 | 16.098127% |
Noise dominated data is calculated using 1-second bins in cleaned event files. If a bin has >2000 counts, and if more than 50% of those come from <1% of pixels, then it is considered to be noise-dominated and hence unusable.
| Quadrant | # 1 sec bins | Bins with >0 counts | Bins with >2000 counts | High rate bins dominated by noise | Noise dominated (total time) | Noise dominated (detector-on time) | Marked lightcurve |
|---|---|---|---|---|---|---|---|
| A | 9013 | 6890 | 246 | 246 | 2.73% | 3.57% | 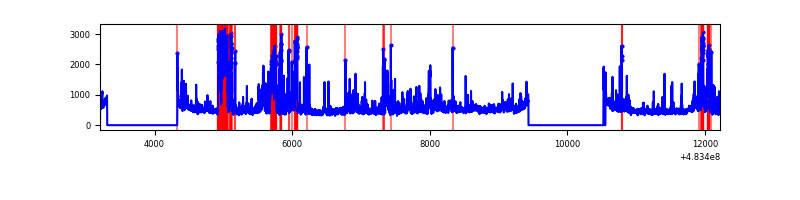 |
| B | 9014 | 6891 | 33 | 33 | 0.37% | 0.48% | 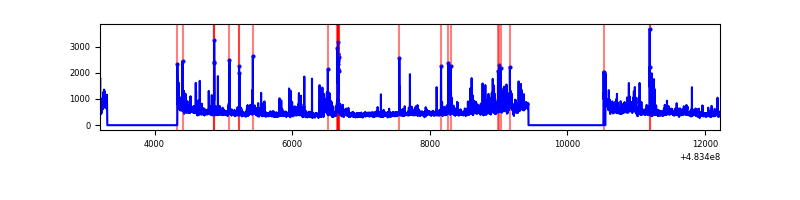 |
| C | 9014 | 6891 | 109 | 109 | 1.21% | 1.58% | 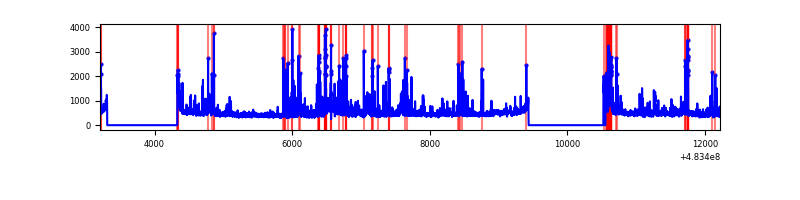 |
| D | 9014 | 6891 | 941 | 941 | 10.44% | 13.66% | 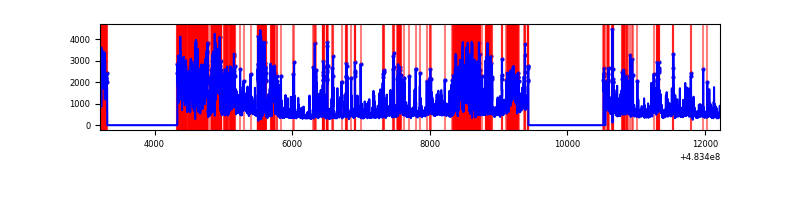 |
Top three noisy pixels from each quadrant. If the there are fewer than three noisy pixels in the level2.evt file, extra rows are filled as -1
| Pixel properties | Quadrant properties | ||||||
|---|---|---|---|---|---|---|---|
| Quadrant | DetID | PixID | Counts | Sigma | Mean | Median | Sigma |
| A | 4 | 175 | 768050 | 4228.91 | 740 | 722 | 181.4 |
| A | 15 | 174 | 418682 | 2303.47 | 740 | 722 | 181.4 |
| A | 4 | 3 | 168232 | 923.18 | 740 | 722 | 181.4 |
| B | 0 | 171 | 151715 | 935.58 | 750 | 723 | 161.4 |
| B | 10 | 128 | 135286 | 833.78 | 750 | 723 | 161.4 |
| B | 10 | 254 | 75923 | 465.95 | 750 | 723 | 161.4 |
| C | 13 | 3 | 185841 | 913.26 | 739 | 734 | 202.7 |
| C | 15 | 192 | 179446 | 881.71 | 739 | 734 | 202.7 |
| C | 1 | 3 | 117300 | 575.1 | 739 | 734 | 202.7 |
| D | 11 | 129 | 3532717 | 18657.21 | 675 | 649 | 189.3 |
| D | 0 | 18 | 387064 | 2041.13 | 675 | 649 | 189.3 |
| D | 8 | 176 | 149529 | 786.42 | 675 | 649 | 189.3 |
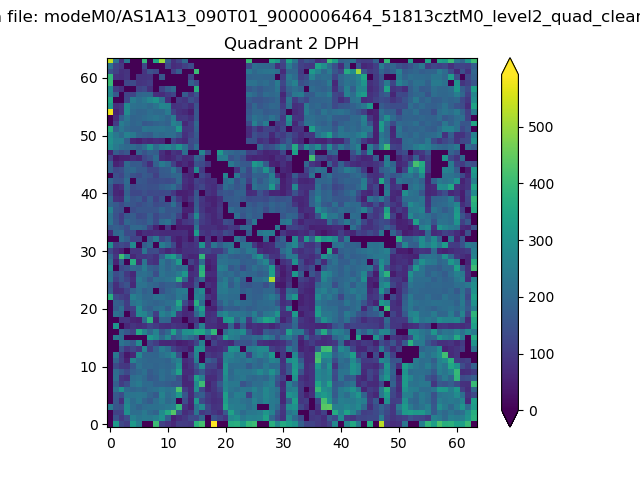
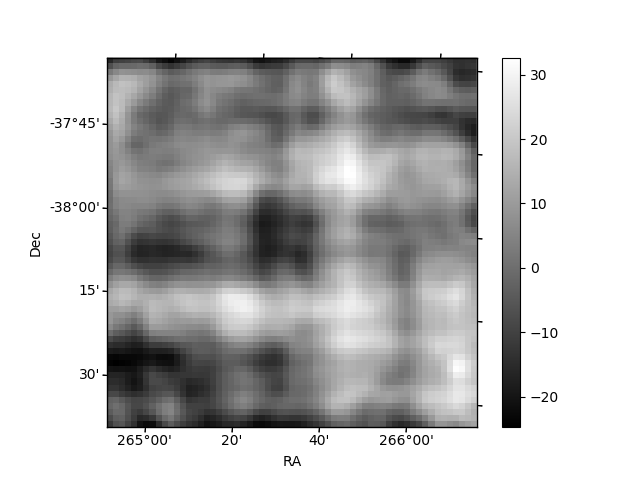
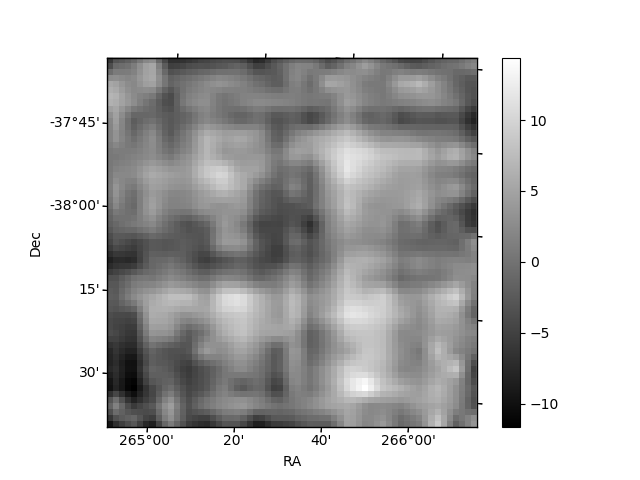
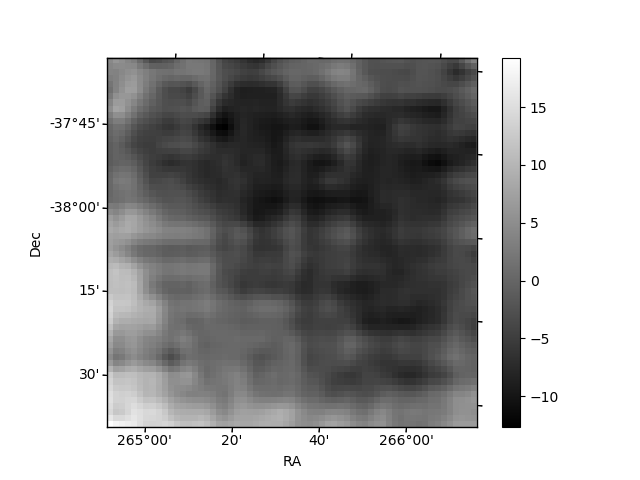
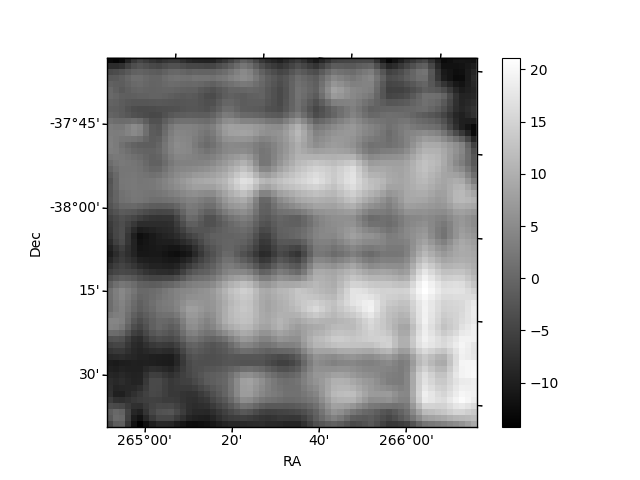
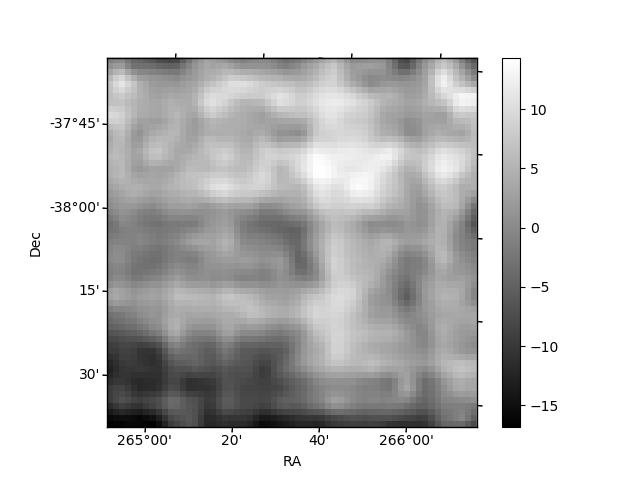
Histogram calculated using DETX and DETY for each event in the final _common_clean file
| Quadrant A | 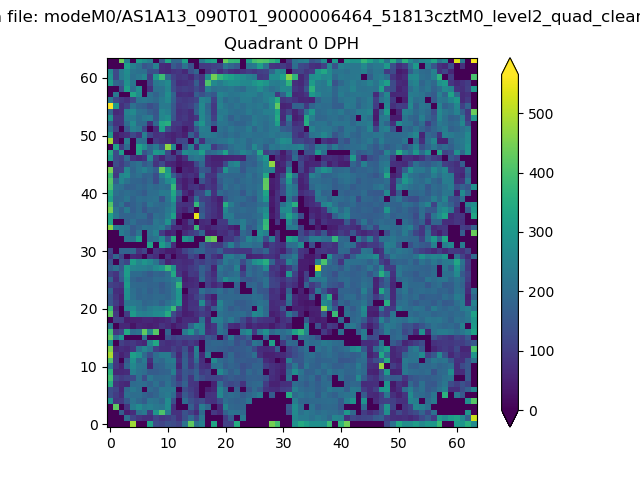 |
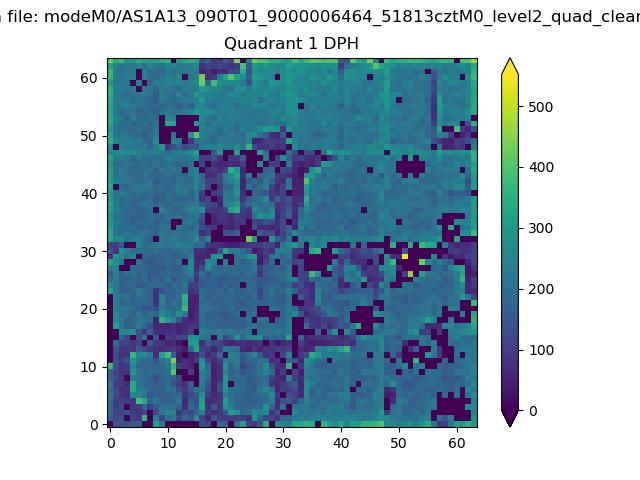 |
Quadrant B |
|---|---|---|---|
| Quadrant D | 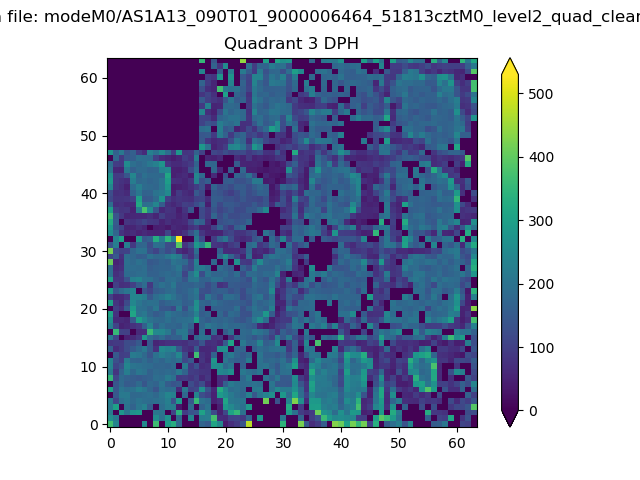 |
 |
Quadrant C |
| Plot type | Count rate plots | Images |
|---|---|---|
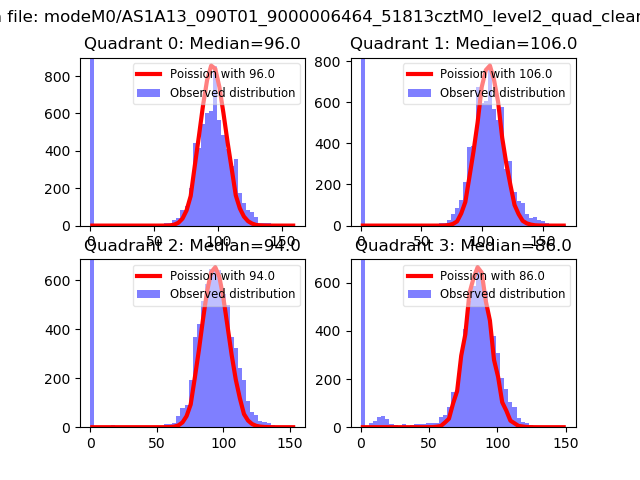
| Comparison with Poisson distribution Blue bars denote a histogram of data divided into 1 sec bins. Red curve is a Poisson curve with rate = median count rate of data. |
 |
 |
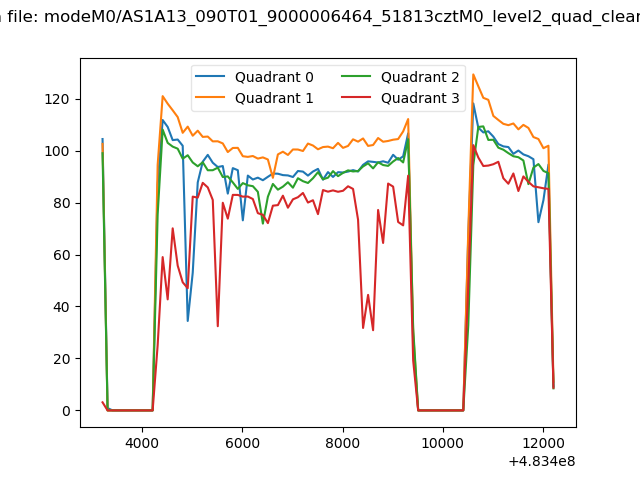
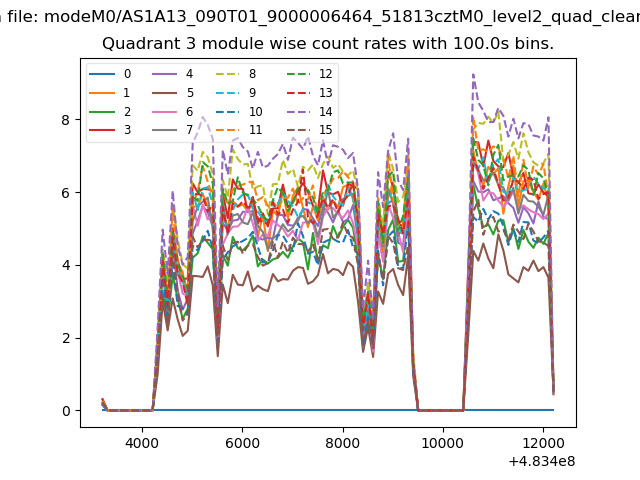
| Quadrant-wise count rates Data is divided into 100 sec bins |
 |
|
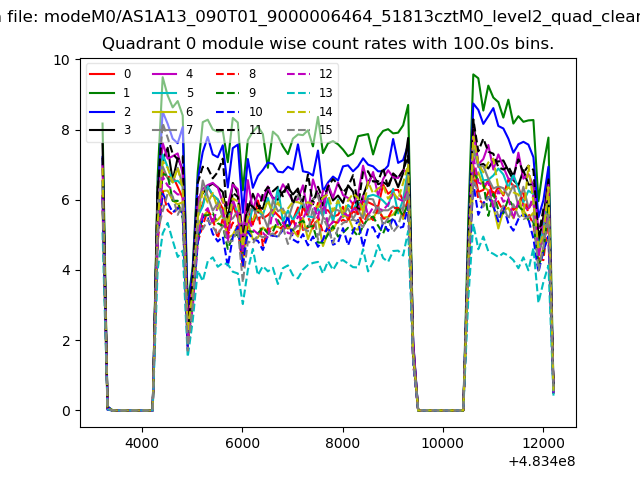
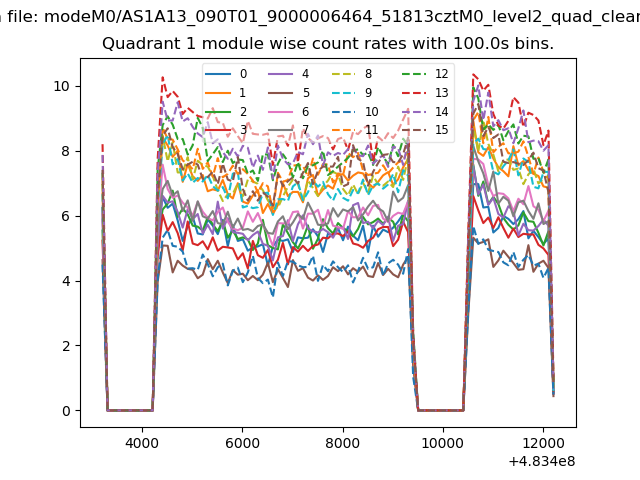
| Module-wise count rates for Quadrant A Data is divided into 100 sec bins |
 |
 |
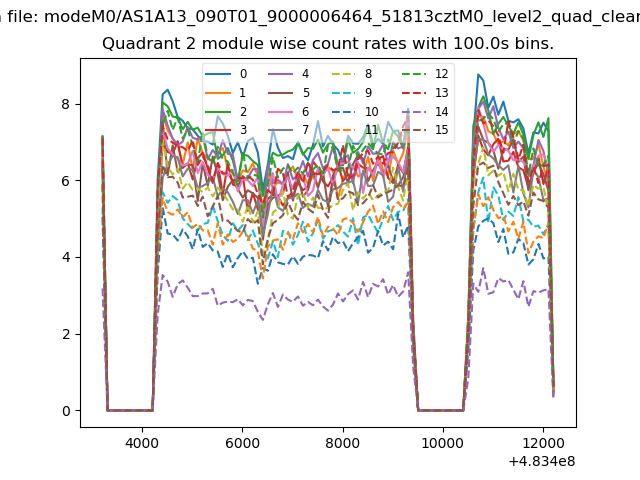
| Module-wise count rates for Quadrant B Data is divided into 100 sec bins |
 |
 |
| Module-wise count rates for Quadrant C Data is divided into 100 sec bins |
 |
 |
| Module-wise count rates for Quadrant D Data is divided into 100 sec bins |
 |
 |
| Parameter | Plot |
|---|---|
| CZT HV Monitor | 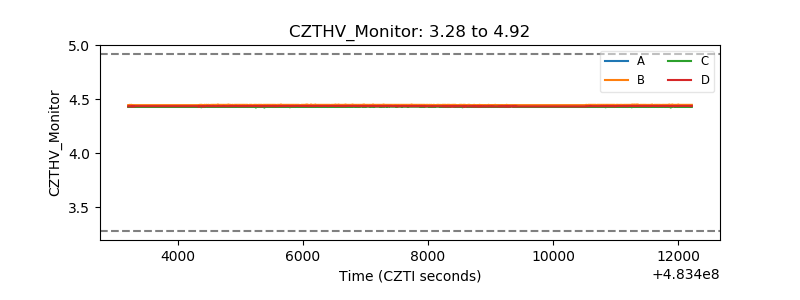 |
| D_VDD | 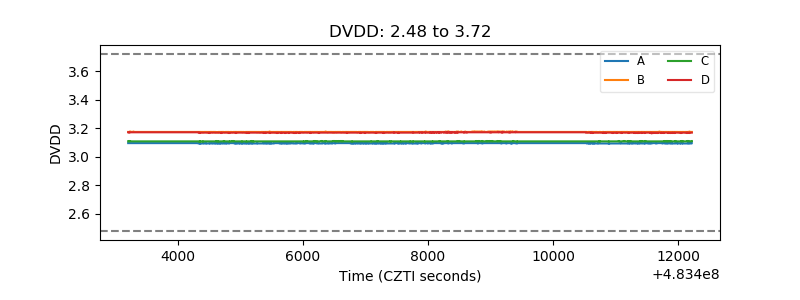 |
| Temperature 1 | 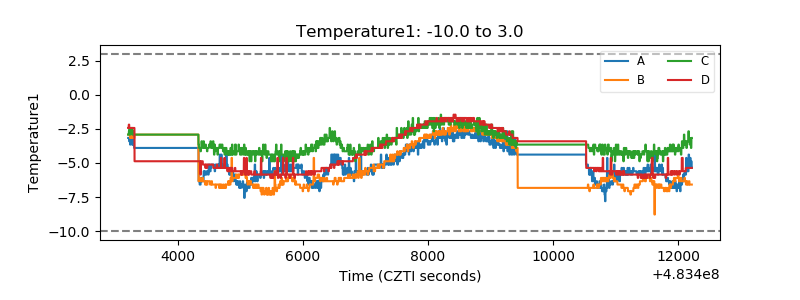 |
| Veto HV Monitor | 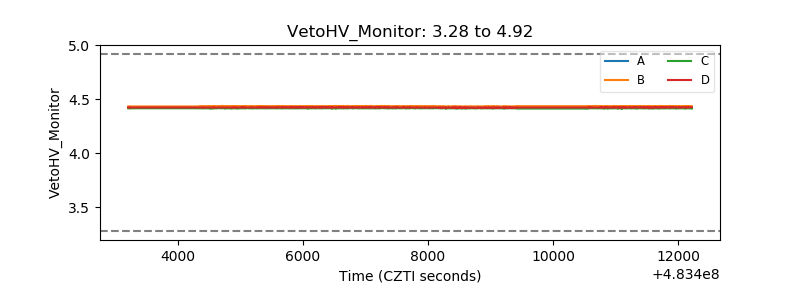 |
| Veto LLD | 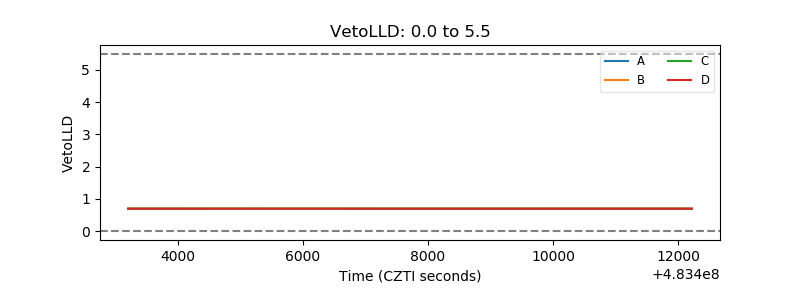 |
| Alpha Counter | 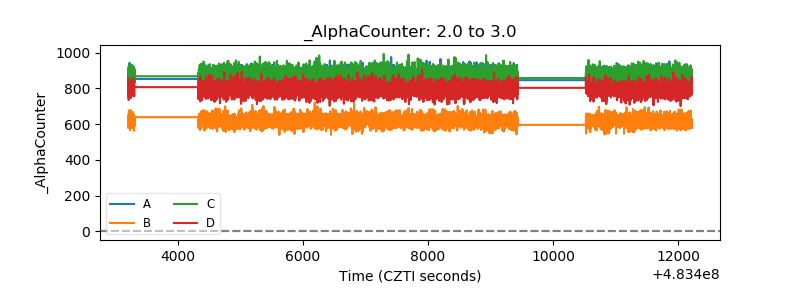 |
| _CPM_Rate | 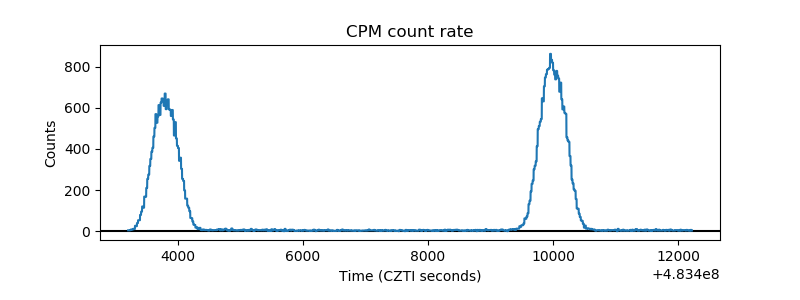 |
| CZT Counter | 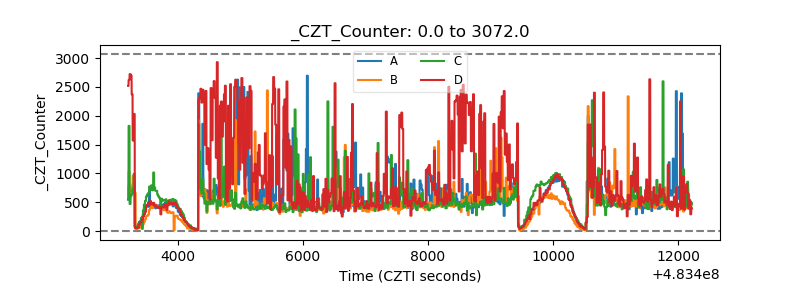 |
| +2.5 Volts monitor | 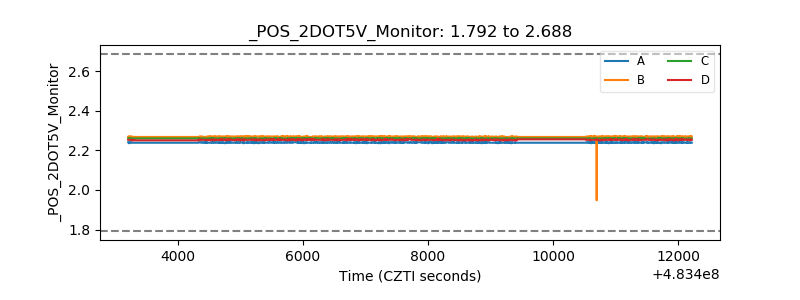 |
| +5 Volts monitor | 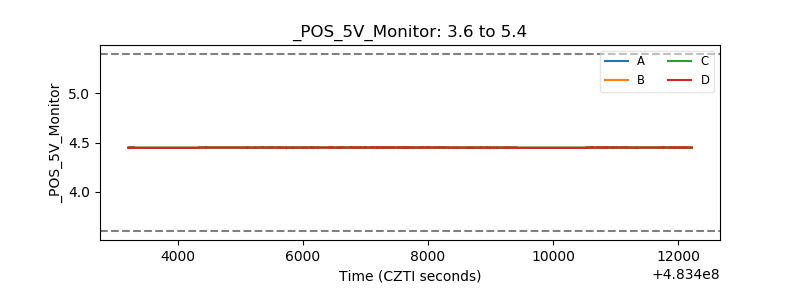 |
| _ROLL_ROT | 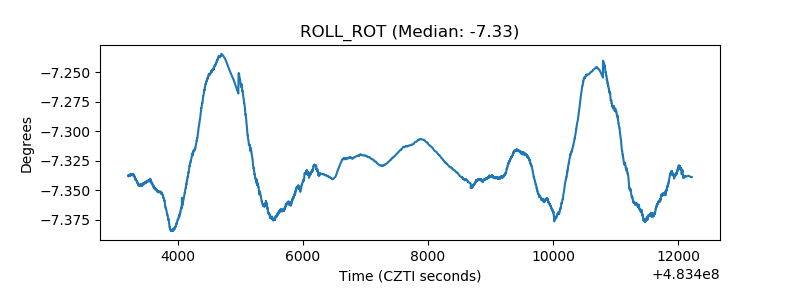 |
| _Roll_DEC | 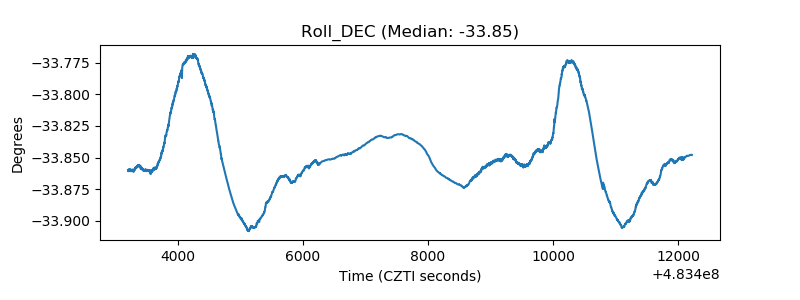 |
| _Roll_RA | 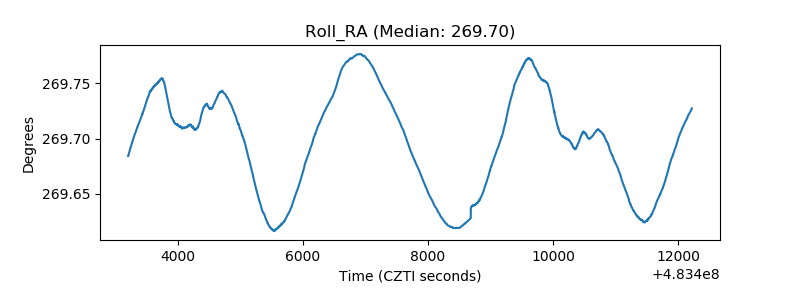 |
| Veto Counter | 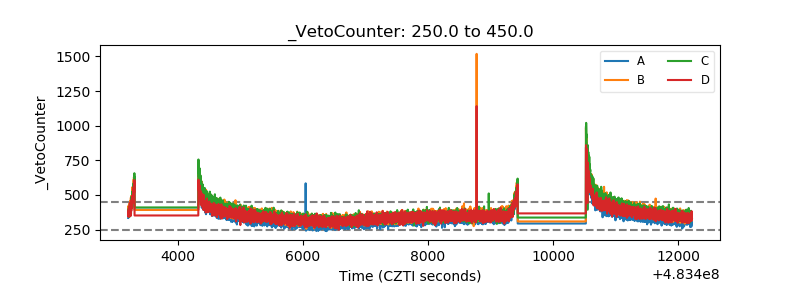 |