| Param | Original file | Final file |
|---|---|---|
| Filename | modeM0/AS1A13_090T01_9000006464_51814cztM0_level2.fits | modeM0/AS1A13_090T01_9000006464_51814cztM0_level2_quad_clean.evt |
| Size (bytes) | 512,732,160 | 101,784,960 |
| Size | 489.0 MB | 97.1 MB |
| Events in quadrant A | 5,055,965 | 659,221 |
| Events in quadrant B | 4,091,798 | 716,522 |
| Events in quadrant C | 4,120,895 | 641,308 |
| Events in quadrant D | 5,183,394 | 590,605 |
| Mode M9 | |||
|---|---|---|---|
| Quadrant | BADHDUFLAG | Total packets | Discarded packets |
| A | 0 | 17 | 0 |
| B | 0 | 18 | 0 |
| C | 0 | 18 | 0 |
| D | 0 | 18 | 0 |
| Mode SS | |||
|---|---|---|---|
| Quadrant | BADHDUFLAG | Total packets | Discarded packets |
| A | 0 | 140 | 0 |
| B | 0 | 140 | 0 |
| C | 0 | 140 | 0 |
| D | 0 | 140 | 0 |
| Mode M0 | |||
|---|---|---|---|
| Quadrant | BADHDUFLAG | Total packets | Discarded packets |
| A | 0 | 19653 | 3 |
| B | 0 | 16869 | 3 |
| C | 0 | 16811 | 3 |
| D | 0 | 20161 | 4 |
| Quadrant | Total seconds | Saturated seconds | Saturation percentage |
|---|---|---|---|
| A | 6802 | 180 | 2.646281% |
| B | 6802 | 246 | 3.616583% |
| C | 6802 | 224 | 3.293149% |
| D | 6801 | 321 | 4.719894% |
Noise dominated data is calculated using 1-second bins in cleaned event files. If a bin has >2000 counts, and if more than 50% of those come from <1% of pixels, then it is considered to be noise-dominated and hence unusable.
| Quadrant | # 1 sec bins | Bins with >0 counts | Bins with >2000 counts | High rate bins dominated by noise | Noise dominated (total time) | Noise dominated (detector-on time) | Marked lightcurve |
|---|---|---|---|---|---|---|---|
| A | 7956 | 6803 | 121 | 121 | 1.52% | 1.78% | 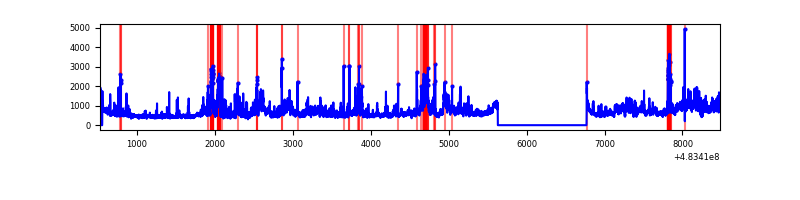 |
| B | 7956 | 6803 | 141 | 141 | 1.77% | 2.07% | 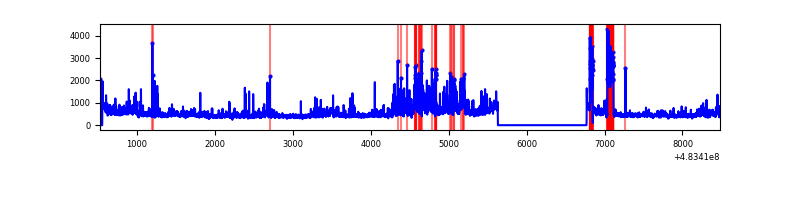 |
| C | 7956 | 6803 | 107 | 107 | 1.34% | 1.57% | 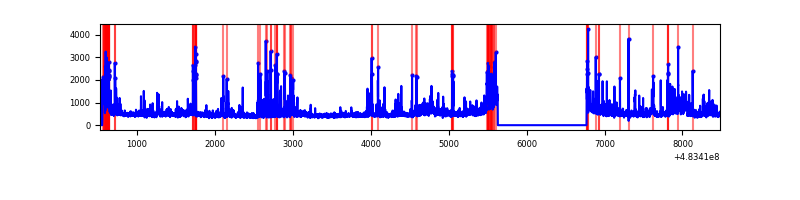 |
| D | 7955 | 6802 | 230 | 230 | 2.89% | 3.38% | 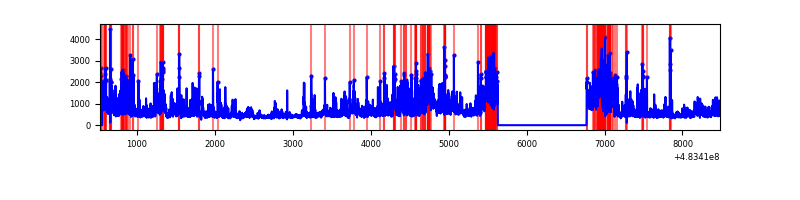 |
Top three noisy pixels from each quadrant. If the there are fewer than three noisy pixels in the level2.evt file, extra rows are filled as -1
| Pixel properties | Quadrant properties | ||||||
|---|---|---|---|---|---|---|---|
| Quadrant | DetID | PixID | Counts | Sigma | Mean | Median | Sigma |
| A | 4 | 175 | 703622 | 3825.64 | 743 | 725 | 183.7 |
| A | 12 | 3 | 497621 | 2704.44 | 743 | 725 | 183.7 |
| A | 15 | 174 | 304826 | 1655.12 | 743 | 725 | 183.7 |
| B | 15 | 54 | 291803 | 1853.46 | 733 | 707 | 157.1 |
| B | 10 | 128 | 200915 | 1274.76 | 733 | 707 | 157.1 |
| B | 4 | 81 | 176359 | 1118.41 | 733 | 707 | 157.1 |
| C | 1 | 3 | 241032 | 1188.42 | 736 | 730 | 202.2 |
| C | 12 | 254 | 167923 | 826.86 | 736 | 730 | 202.2 |
| C | 9 | 38 | 159924 | 787.3 | 736 | 730 | 202.2 |
| D | 11 | 129 | 1428579 | 7117.28 | 718 | 692 | 200.6 |
| D | 0 | 18 | 443645 | 2207.89 | 718 | 692 | 200.6 |
| D | 9 | 49 | 130230 | 645.68 | 718 | 692 | 200.6 |
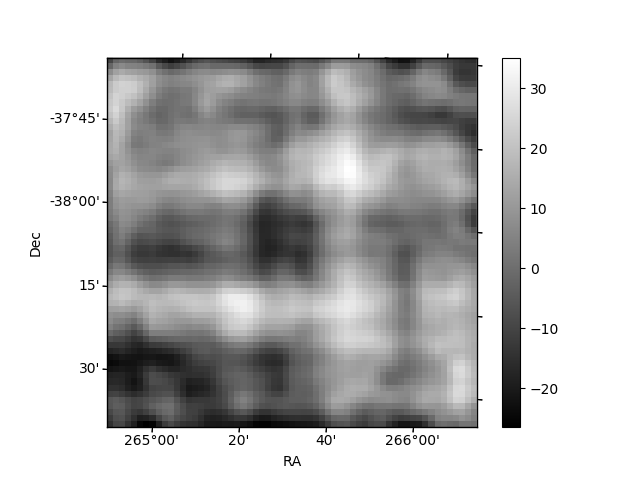
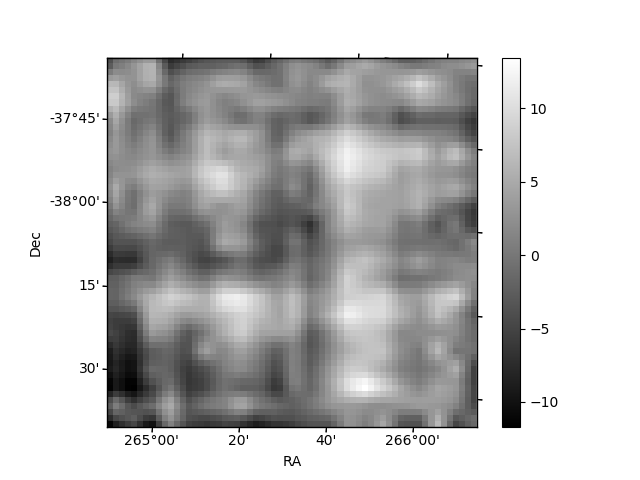
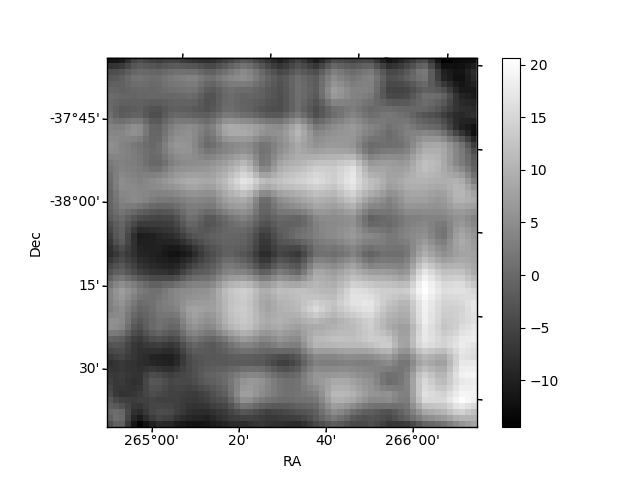
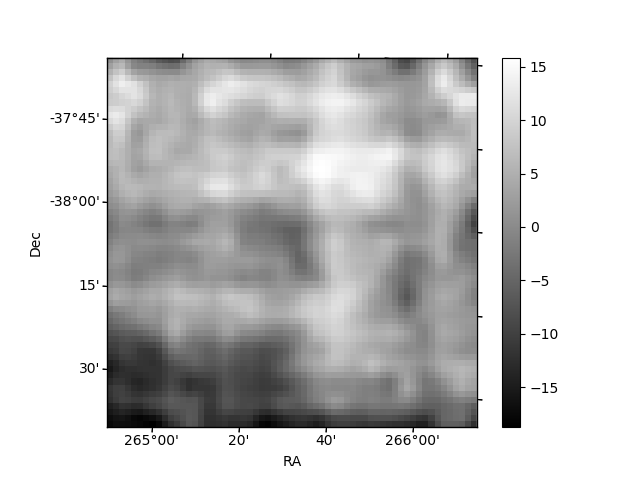
Histogram calculated using DETX and DETY for each event in the final _common_clean file
| Quadrant A | 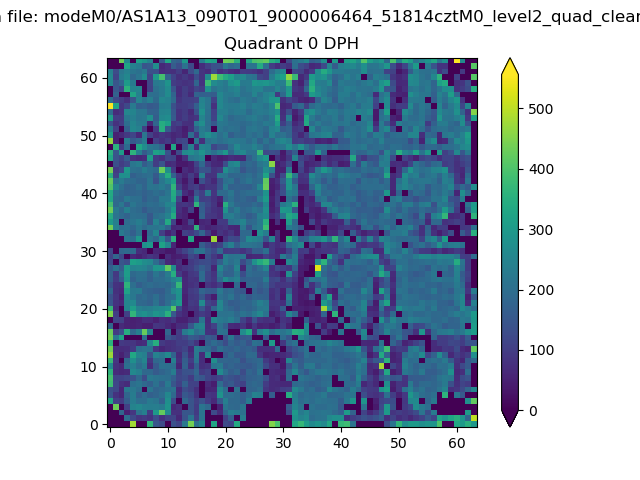 |
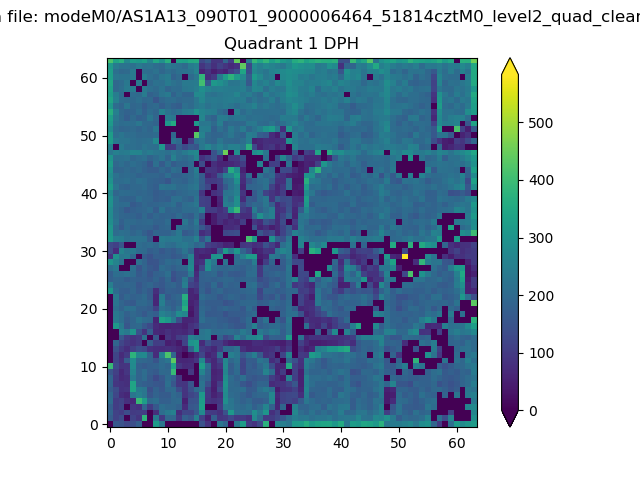 |
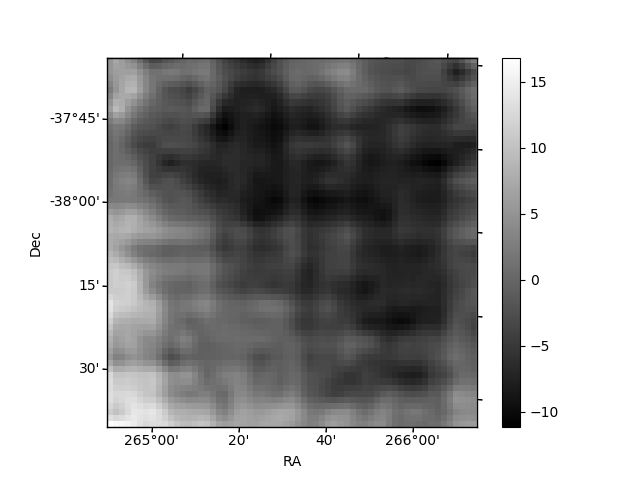
Quadrant B |
|---|---|---|---|
| Quadrant D | 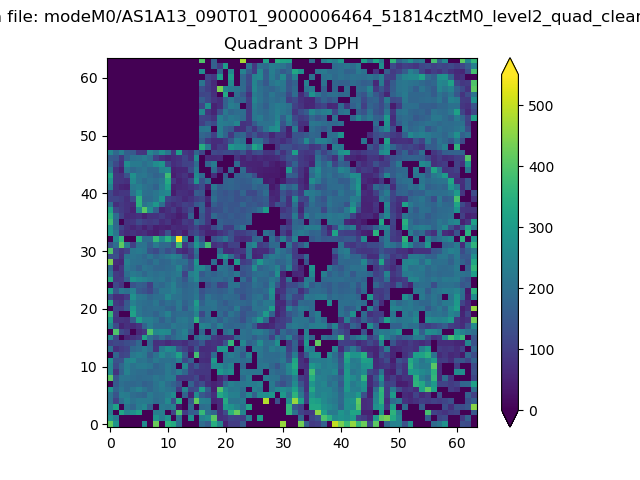 |
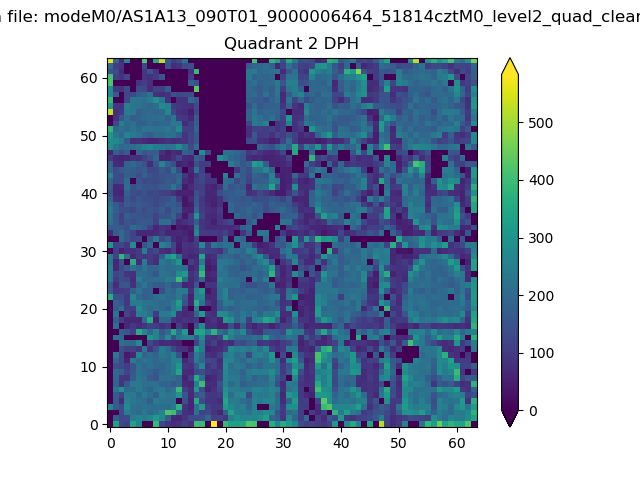 |
Quadrant C |
| Plot type | Count rate plots | Images |
|---|---|---|
| Comparison with Poisson distribution Blue bars denote a histogram of data divided into 1 sec bins. Red curve is a Poisson curve with rate = median count rate of data. |
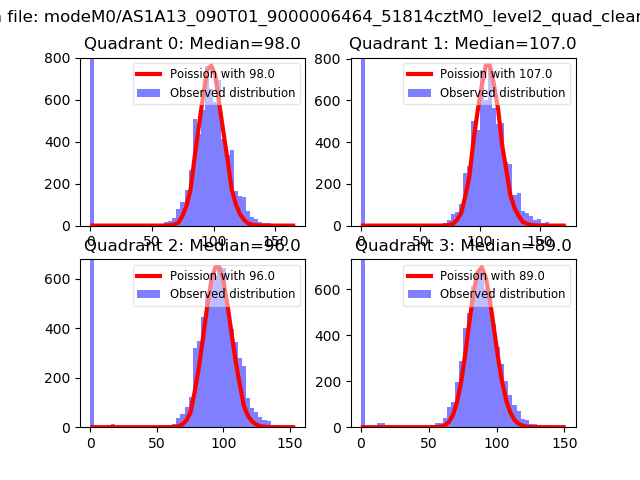 |
 |
| Quadrant-wise count rates Data is divided into 100 sec bins |
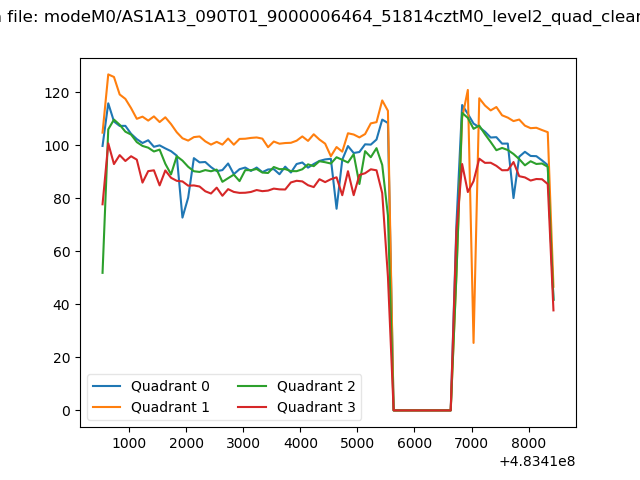 |
|
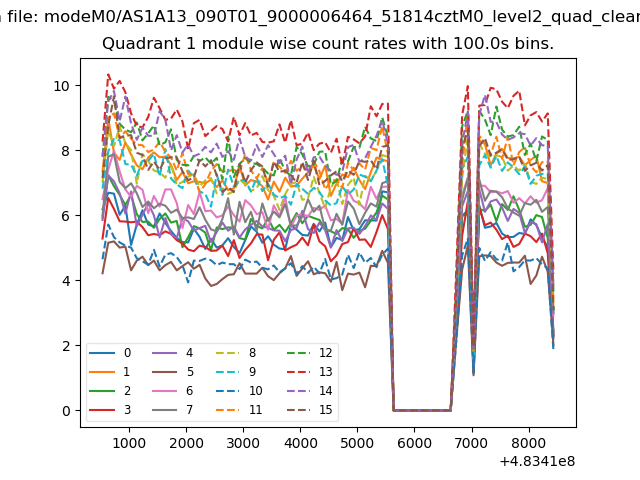
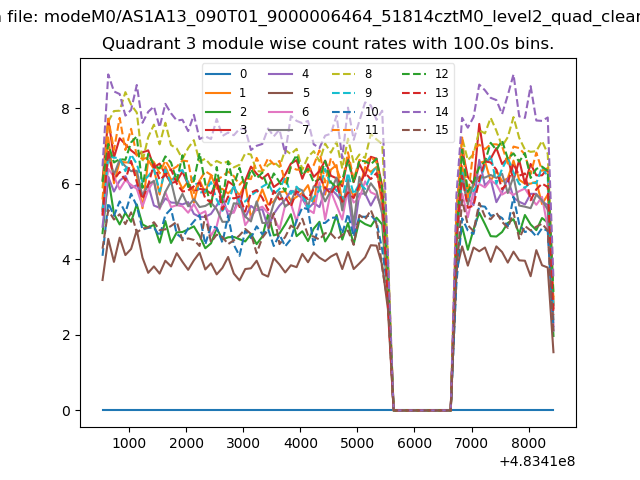
| Module-wise count rates for Quadrant A Data is divided into 100 sec bins |
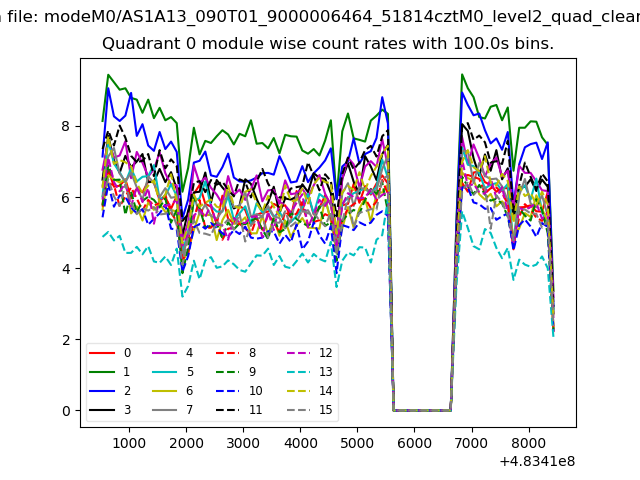 |
 |
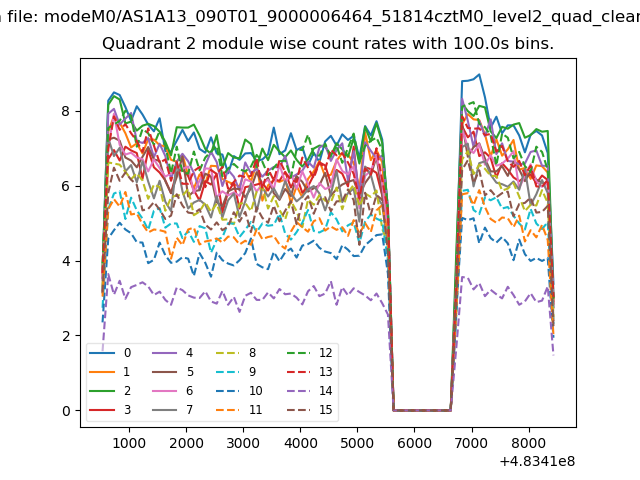
| Module-wise count rates for Quadrant B Data is divided into 100 sec bins |
 |
 |
| Module-wise count rates for Quadrant C Data is divided into 100 sec bins |
 |
 |
| Module-wise count rates for Quadrant D Data is divided into 100 sec bins |
 |
 |
| Parameter | Plot |
|---|---|
| CZT HV Monitor | 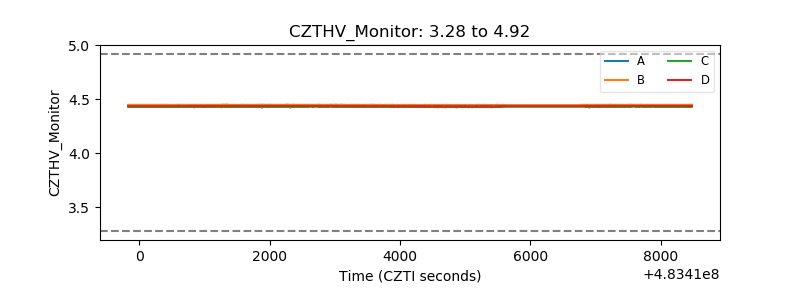 |
| D_VDD | 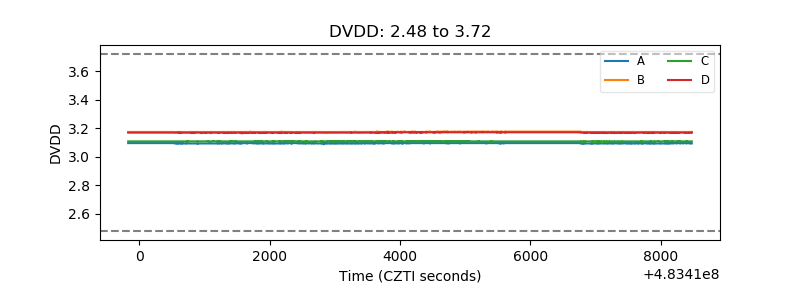 |
| Temperature 1 | 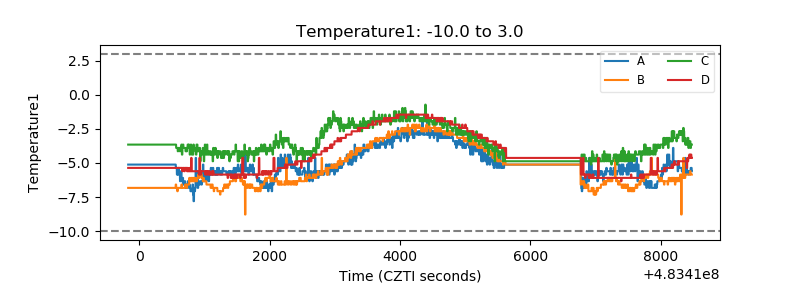 |
| Veto HV Monitor | 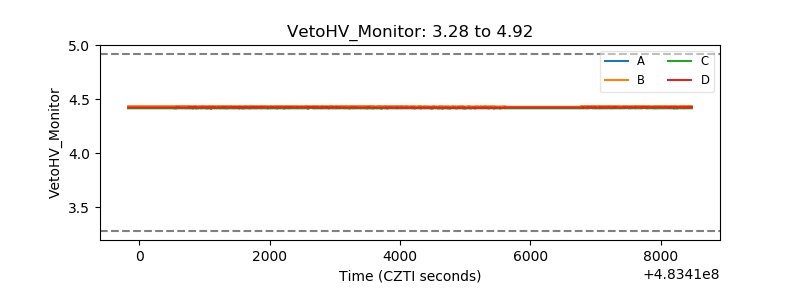 |
| Veto LLD | 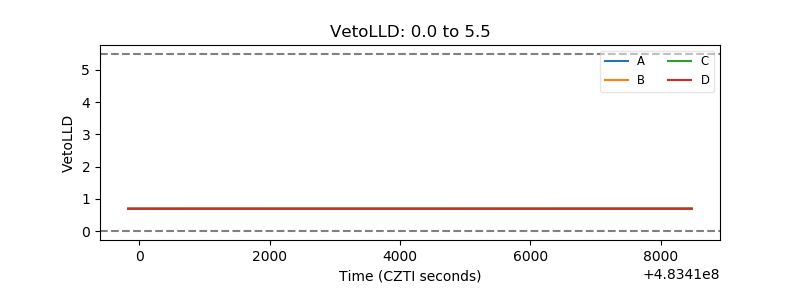 |
| Alpha Counter | 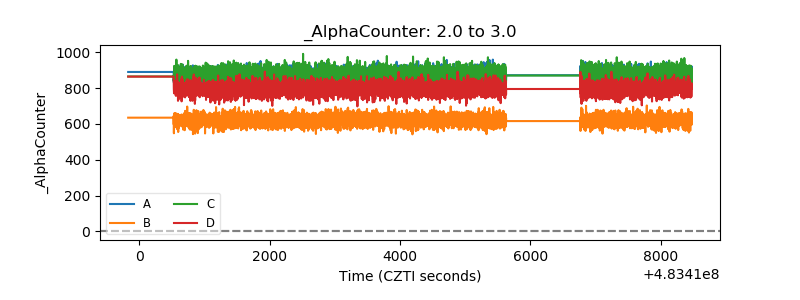 |
| _CPM_Rate | 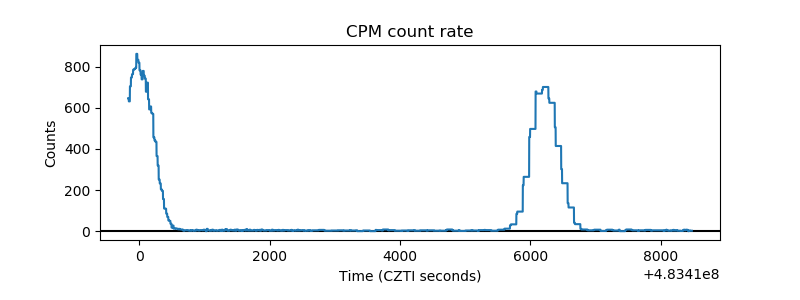 |
| CZT Counter | 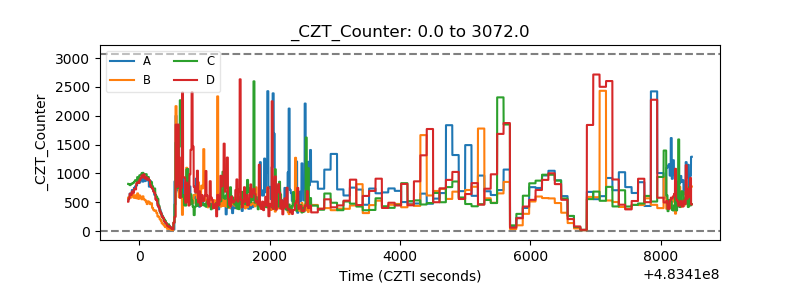 |
| +2.5 Volts monitor | 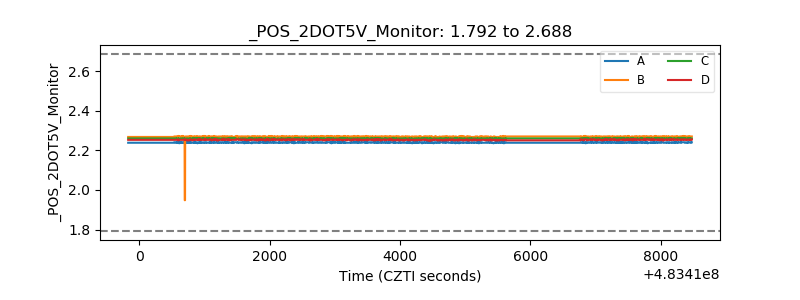 |
| +5 Volts monitor | 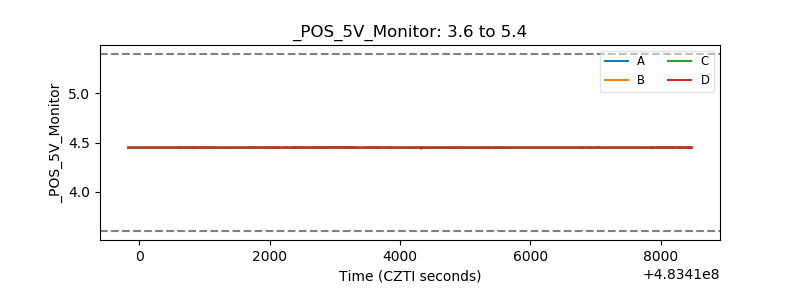 |
| _ROLL_ROT | 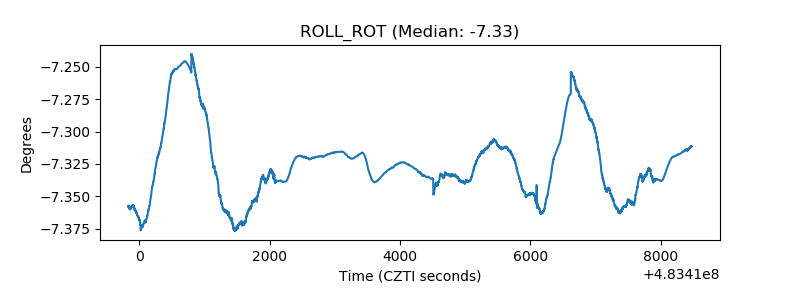 |
| _Roll_DEC | 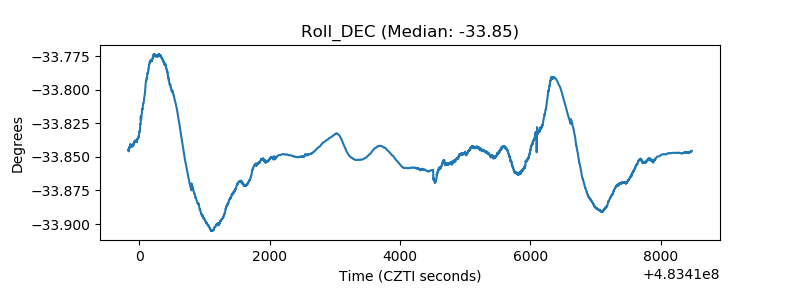 |
| _Roll_RA | 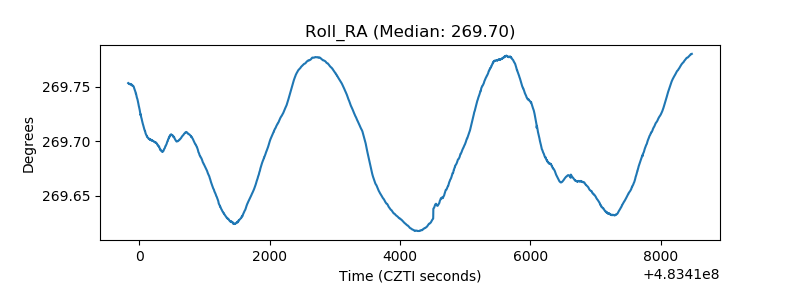 |
| Veto Counter | 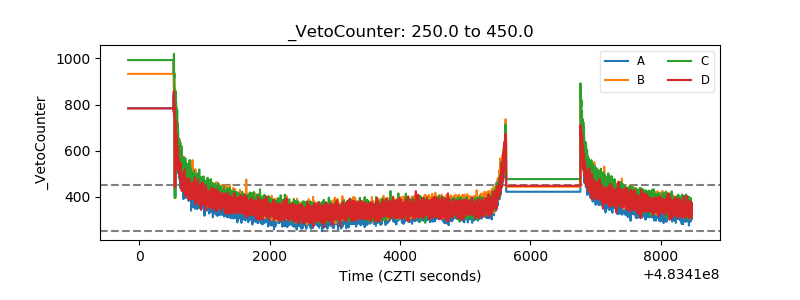 |