| Param | Original file | Final file |
|---|---|---|
| Filename | modeM0/AS1A13_090T01_9000006464_51816cztM0_level2.fits | modeM0/AS1A13_090T01_9000006464_51816cztM0_level2_quad_clean.evt |
| Size (bytes) | 590,241,600 | 93,764,160 |
| Size | 562.9 MB | 89.4 MB |
| Events in quadrant A | 4,222,582 | 635,669 |
| Events in quadrant B | 4,150,818 | 692,490 |
| Events in quadrant C | 4,722,120 | 587,791 |
| Events in quadrant D | 8,233,565 | 456,060 |
| Mode M9 | |||
|---|---|---|---|
| Quadrant | BADHDUFLAG | Total packets | Discarded packets |
| A | 0 | 12 | 0 |
| B | 0 | 13 | 0 |
| C | 0 | 13 | 0 |
| D | 0 | 13 | 0 |
| Mode SS | |||
|---|---|---|---|
| Quadrant | BADHDUFLAG | Total packets | Discarded packets |
| A | 0 | 136 | 0 |
| B | 0 | 136 | 0 |
| C | 0 | 136 | 0 |
| D | 0 | 136 | 0 |
| Mode M0 | |||
|---|---|---|---|
| Quadrant | BADHDUFLAG | Total packets | Discarded packets |
| A | 0 | 17034 | 2 |
| B | 0 | 16894 | 2 |
| C | 0 | 18801 | 2 |
| D | 0 | 29098 | 2 |
| Quadrant | Total seconds | Saturated seconds | Saturation percentage |
|---|---|---|---|
| A | 6700 | 189 | 2.820896% |
| B | 6700 | 224 | 3.343284% |
| C | 6700 | 565 | 8.432836% |
| D | 6700 | 1732 | 25.850746% |
Noise dominated data is calculated using 1-second bins in cleaned event files. If a bin has >2000 counts, and if more than 50% of those come from <1% of pixels, then it is considered to be noise-dominated and hence unusable.
| Quadrant | # 1 sec bins | Bins with >0 counts | Bins with >2000 counts | High rate bins dominated by noise | Noise dominated (total time) | Noise dominated (detector-on time) | Marked lightcurve |
|---|---|---|---|---|---|---|---|
| A | 7700 | 6702 | 77 | 77 | 1.00% | 1.15% | 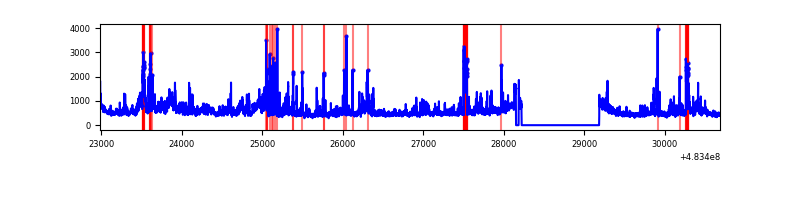 |
| B | 7700 | 6702 | 71 | 71 | 0.92% | 1.06% | 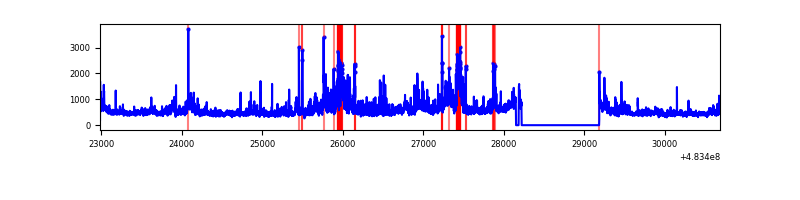 |
| C | 7700 | 6702 | 459 | 459 | 5.96% | 6.85% | 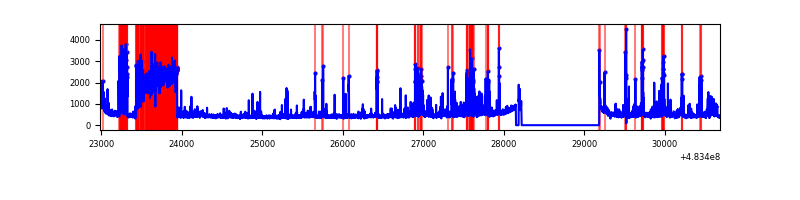 |
| D | 7700 | 6702 | 1397 | 1397 | 18.14% | 20.84% | 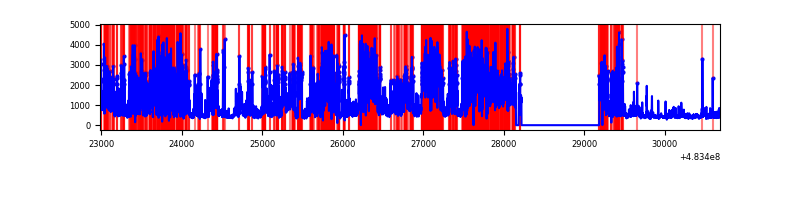 |
Top three noisy pixels from each quadrant. If the there are fewer than three noisy pixels in the level2.evt file, extra rows are filled as -1
| Pixel properties | Quadrant properties | ||||||
|---|---|---|---|---|---|---|---|
| Quadrant | DetID | PixID | Counts | Sigma | Mean | Median | Sigma |
| A | 15 | 174 | 332315 | 1847.36 | 736 | 717 | 179.5 |
| A | 12 | 3 | 311865 | 1733.43 | 736 | 717 | 179.5 |
| A | 11 | 3 | 173497 | 962.57 | 736 | 717 | 179.5 |
| B | 1 | 207 | 211506 | 1342.58 | 730 | 703 | 157.0 |
| B | 4 | 81 | 186560 | 1183.7 | 730 | 703 | 157.0 |
| B | 10 | 254 | 142335 | 902.04 | 730 | 703 | 157.0 |
| C | 9 | 38 | 953330 | 4892.5 | 713 | 709 | 194.7 |
| C | 12 | 254 | 194754 | 996.58 | 713 | 709 | 194.7 |
| C | 1 | 3 | 186636 | 954.89 | 713 | 709 | 194.7 |
| D | 11 | 129 | 4475668 | 25121.1 | 635 | 613 | 178.1 |
| D | 12 | 6 | 542202 | 3040.26 | 635 | 613 | 178.1 |
| D | 0 | 18 | 419674 | 2352.43 | 635 | 613 | 178.1 |
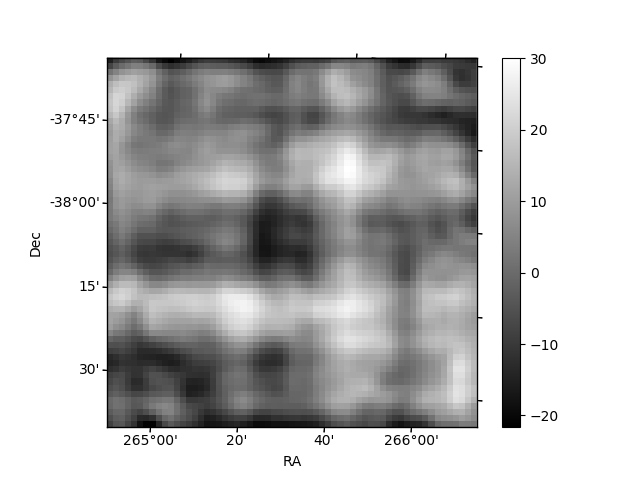
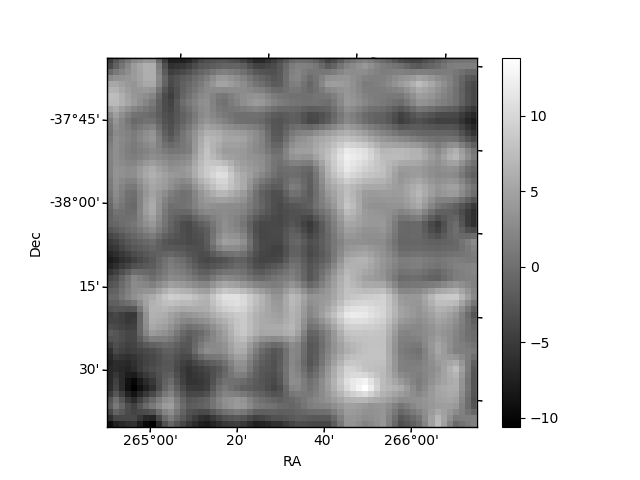
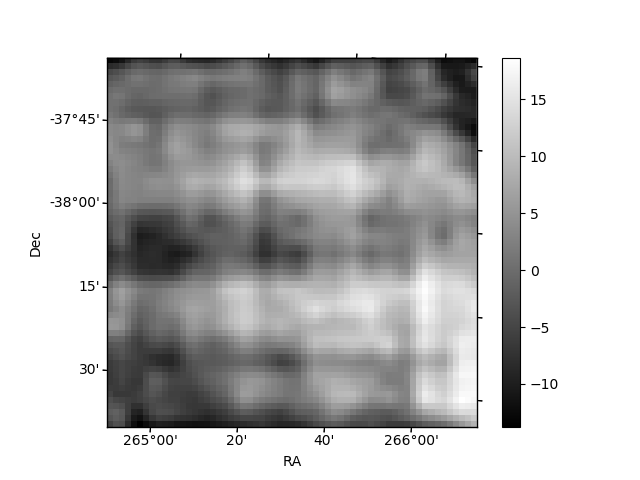
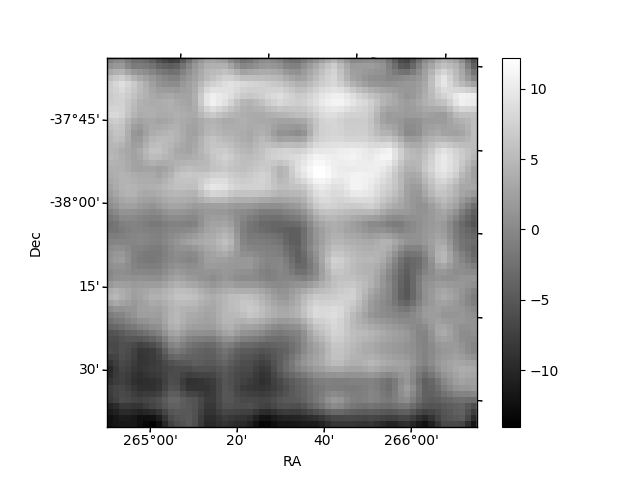
Histogram calculated using DETX and DETY for each event in the final _common_clean file
| Quadrant A | 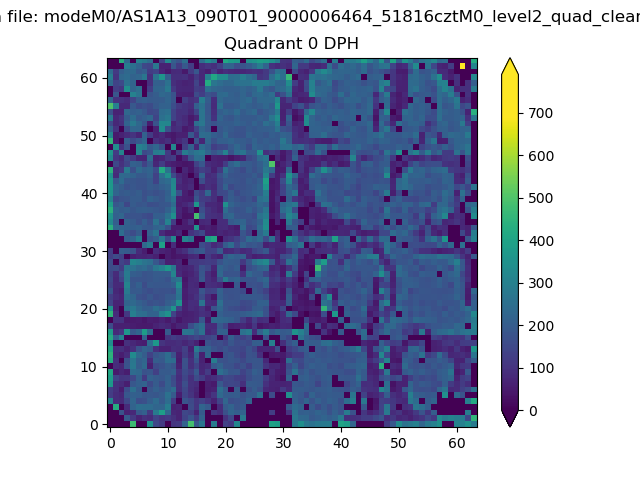 |
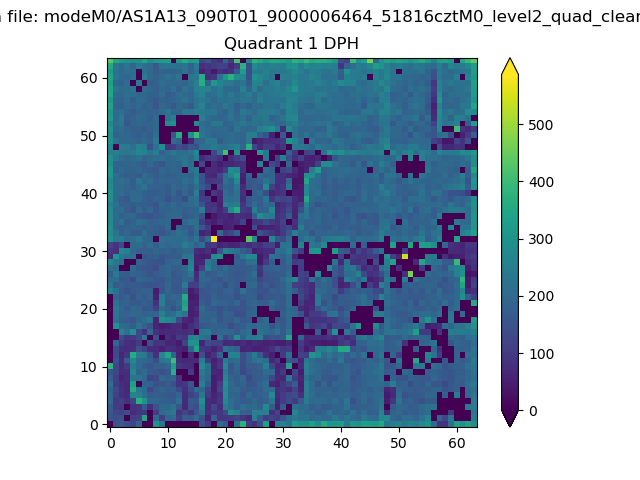 |
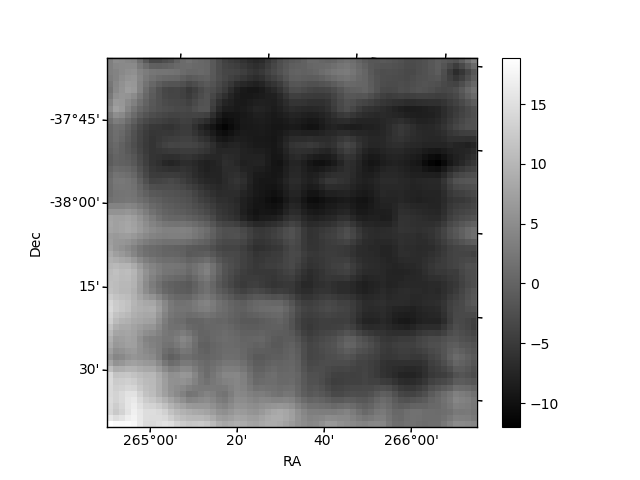
Quadrant B |
|---|---|---|---|
| Quadrant D | 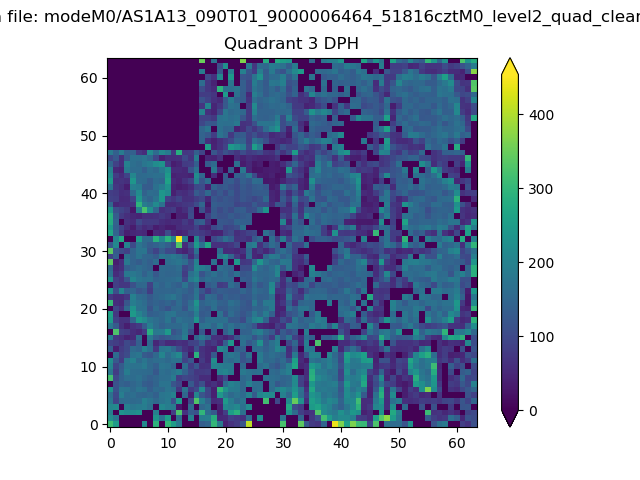 |
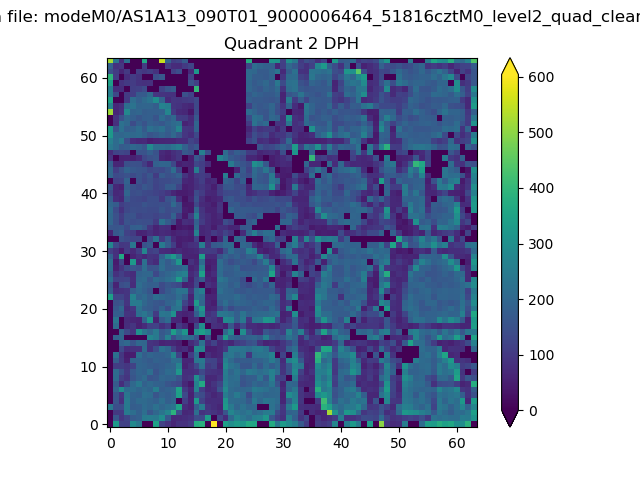 |
Quadrant C |
| Plot type | Count rate plots | Images |
|---|---|---|
| Comparison with Poisson distribution Blue bars denote a histogram of data divided into 1 sec bins. Red curve is a Poisson curve with rate = median count rate of data. |
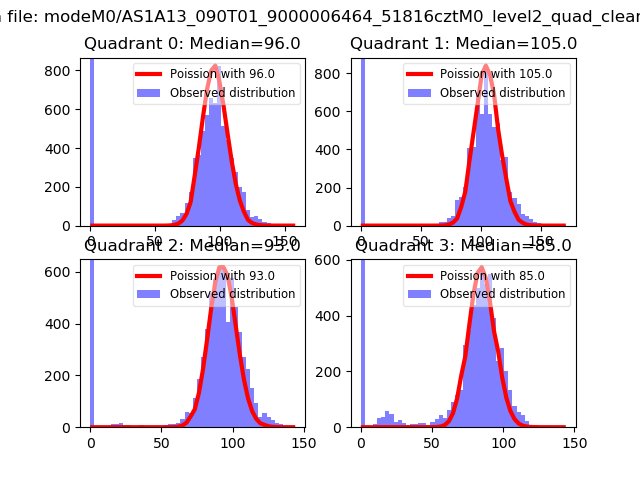 |
 |
| Quadrant-wise count rates Data is divided into 100 sec bins |
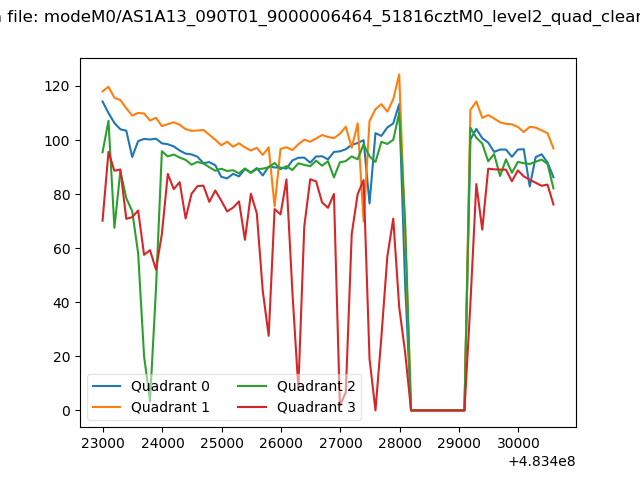 |
|
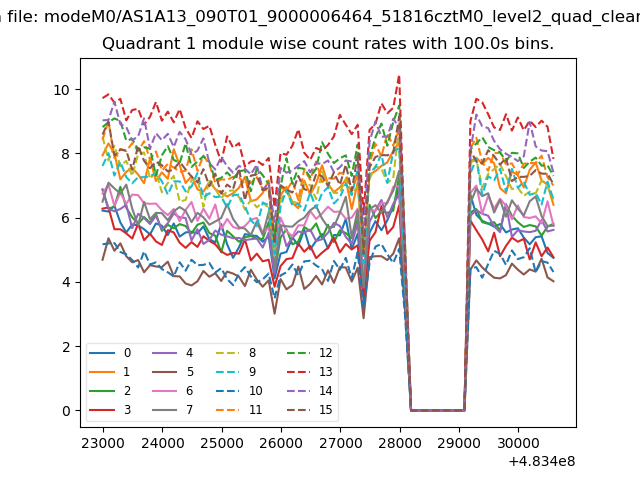
| Module-wise count rates for Quadrant A Data is divided into 100 sec bins |
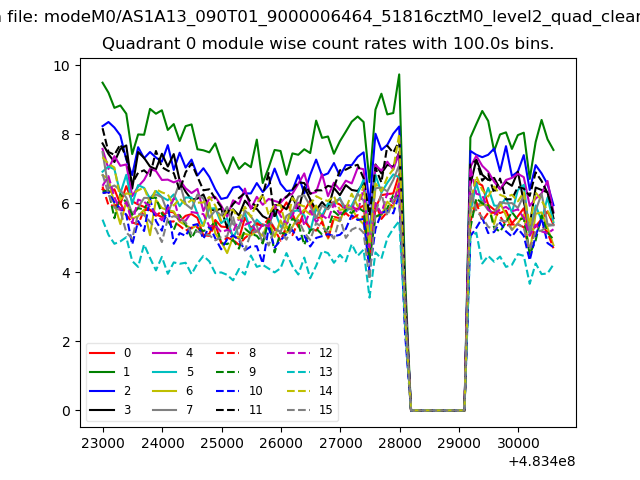 |
 |
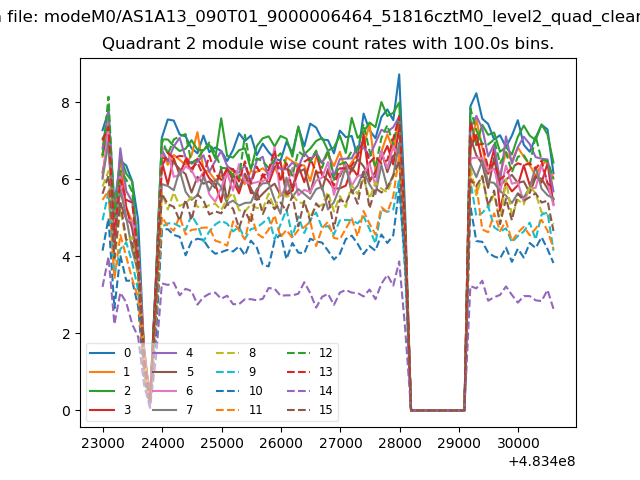
| Module-wise count rates for Quadrant B Data is divided into 100 sec bins |
 |
 |
| Module-wise count rates for Quadrant C Data is divided into 100 sec bins |
 |
 |
| Module-wise count rates for Quadrant D Data is divided into 100 sec bins |
 |
 |
| Parameter | Plot |
|---|---|
| CZT HV Monitor | 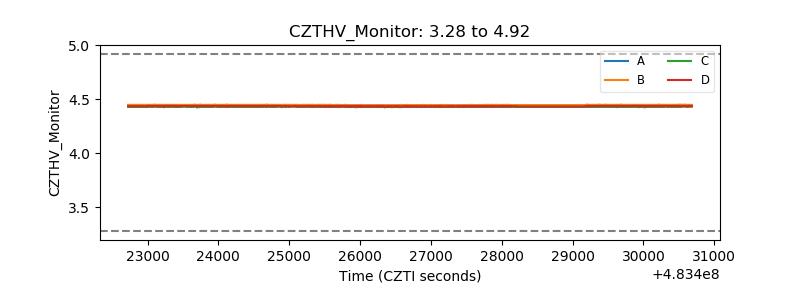 |
| D_VDD | 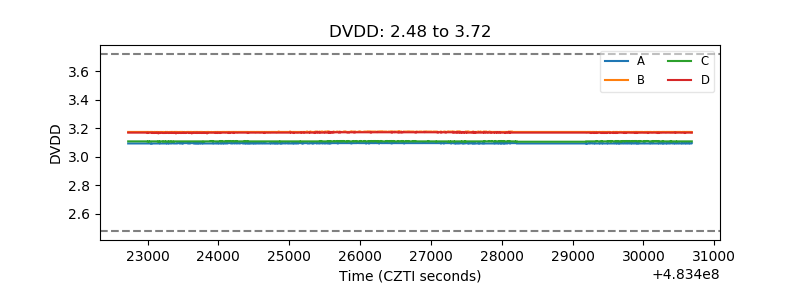 |
| Temperature 1 | 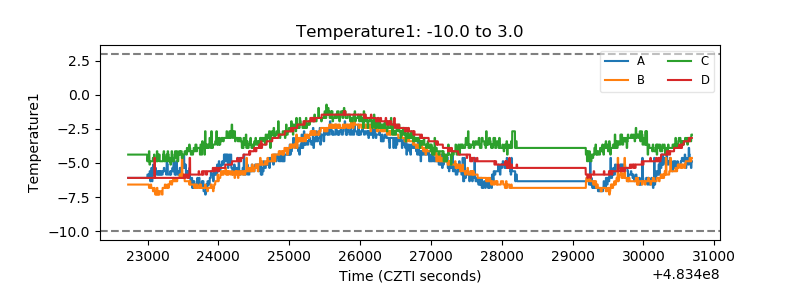 |
| Veto HV Monitor | 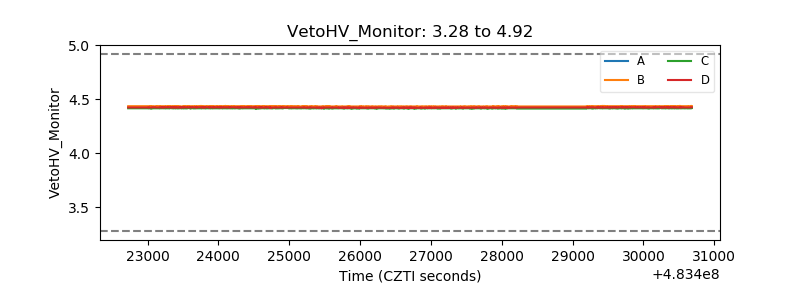 |
| Veto LLD | 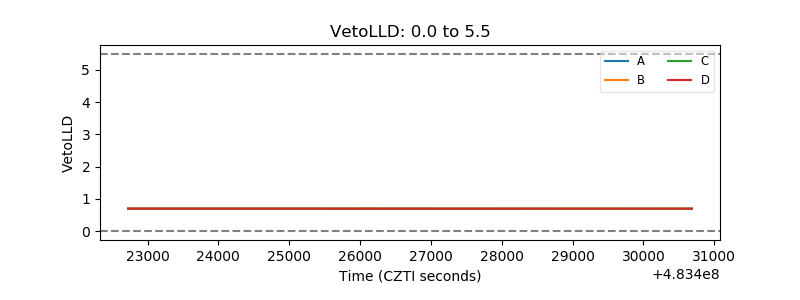 |
| Alpha Counter | 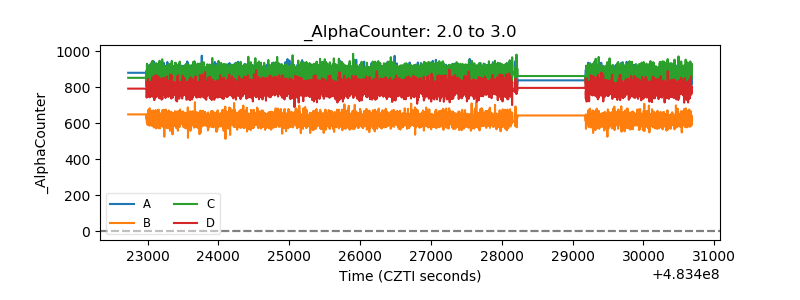 |
| _CPM_Rate | 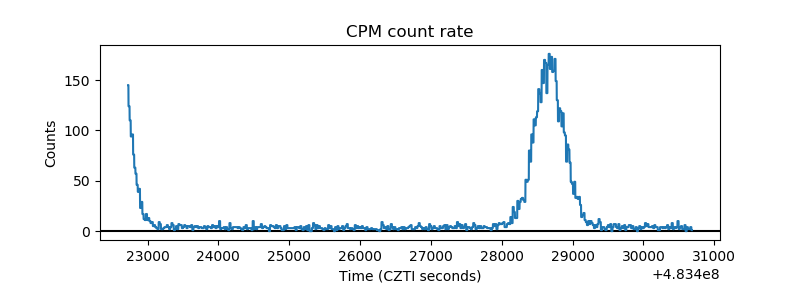 |
| CZT Counter | 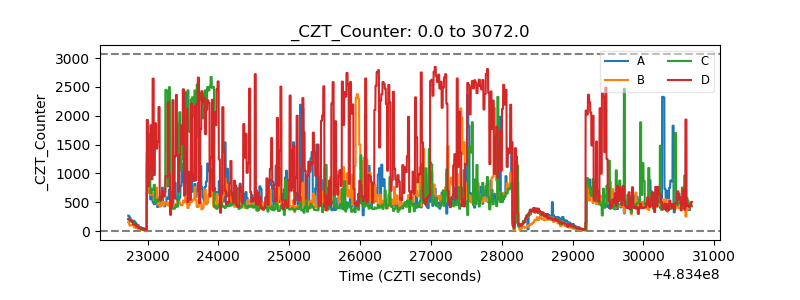 |
| +2.5 Volts monitor | 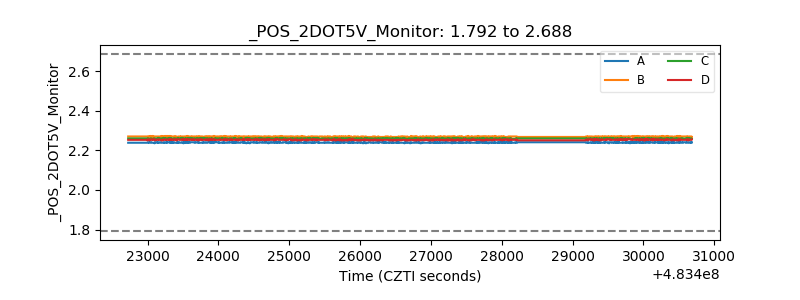 |
| +5 Volts monitor | 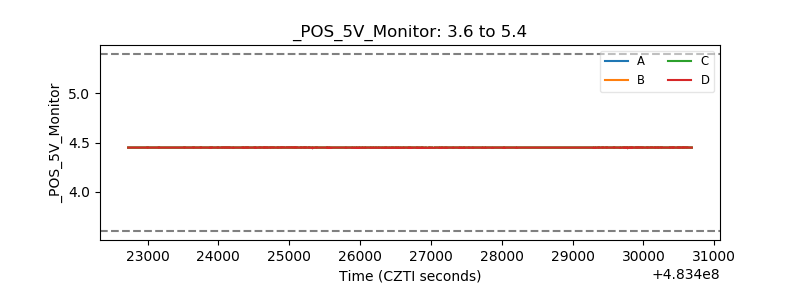 |
| _ROLL_ROT | 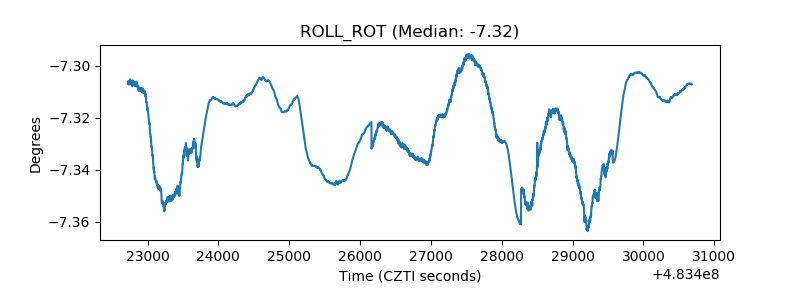 |
| _Roll_DEC | 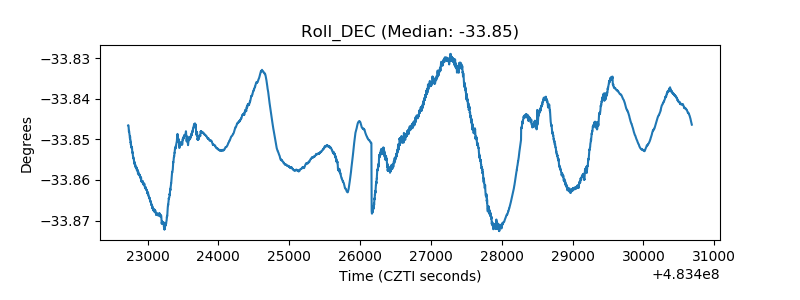 |
| _Roll_RA | 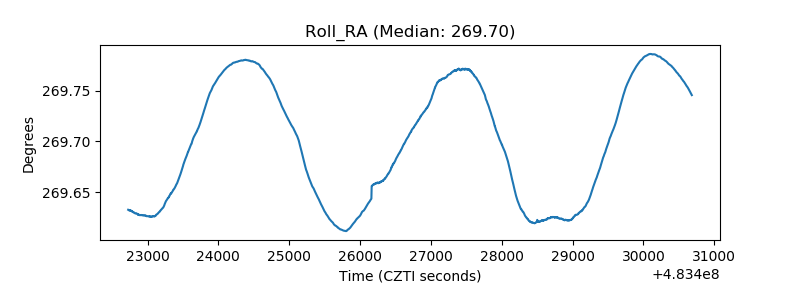 |
| Veto Counter | 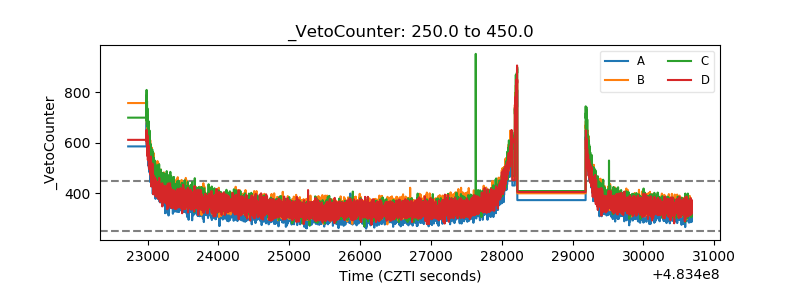 |