| Param | Original file | Final file |
|---|---|---|
| Filename | modeM0/AS1A13_090T01_9000006464_51817cztM0_level2.fits | modeM0/AS1A13_090T01_9000006464_51817cztM0_level2_quad_clean.evt |
| Size (bytes) | 648,083,520 | 92,410,560 |
| Size | 618.1 MB | 88.1 MB |
| Events in quadrant A | 4,391,323 | 633,707 |
| Events in quadrant B | 4,198,582 | 694,987 |
| Events in quadrant C | 4,310,646 | 608,014 |
| Events in quadrant D | 10,555,524 | 382,148 |
| Mode M9 | |||
|---|---|---|---|
| Quadrant | BADHDUFLAG | Total packets | Discarded packets |
| A | 0 | 7 | 0 |
| B | 0 | 7 | 0 |
| C | 0 | 7 | 0 |
| D | 0 | 7 | 0 |
| Mode SS | |||
|---|---|---|---|
| Quadrant | BADHDUFLAG | Total packets | Discarded packets |
| A | 0 | 138 | 0 |
| B | 0 | 138 | 0 |
| C | 0 | 138 | 0 |
| D | 0 | 138 | 0 |
| Mode M0 | |||
|---|---|---|---|
| Quadrant | BADHDUFLAG | Total packets | Discarded packets |
| A | 0 | 17743 | 1 |
| B | 0 | 17144 | 1 |
| C | 0 | 17636 | 1 |
| D | 0 | 36115 | 1 |
| Quadrant | Total seconds | Saturated seconds | Saturation percentage |
|---|---|---|---|
| A | 6880 | 210 | 3.052326% |
| B | 6881 | 235 | 3.415201% |
| C | 6880 | 340 | 4.941860% |
| D | 6880 | 2696 | 39.186047% |
Noise dominated data is calculated using 1-second bins in cleaned event files. If a bin has >2000 counts, and if more than 50% of those come from <1% of pixels, then it is considered to be noise-dominated and hence unusable.
| Quadrant | # 1 sec bins | Bins with >0 counts | Bins with >2000 counts | High rate bins dominated by noise | Noise dominated (total time) | Noise dominated (detector-on time) | Marked lightcurve |
|---|---|---|---|---|---|---|---|
| A | 7570 | 6881 | 46 | 46 | 0.61% | 0.67% | 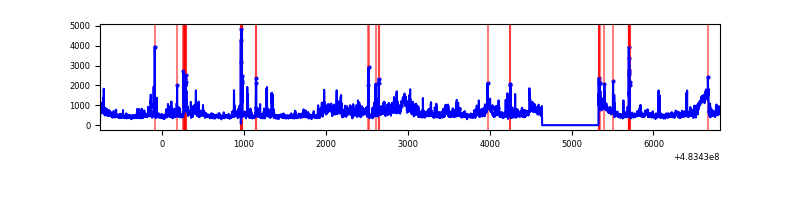 |
| B | 7571 | 6882 | 37 | 37 | 0.49% | 0.54% | 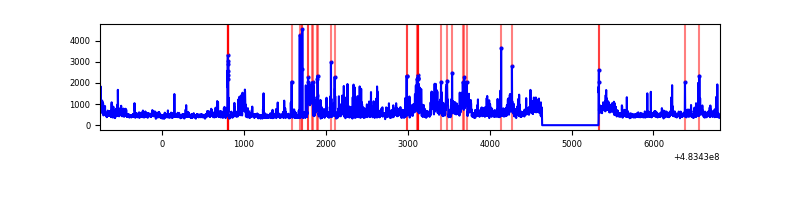 |
| C | 7570 | 6881 | 219 | 219 | 2.89% | 3.18% | 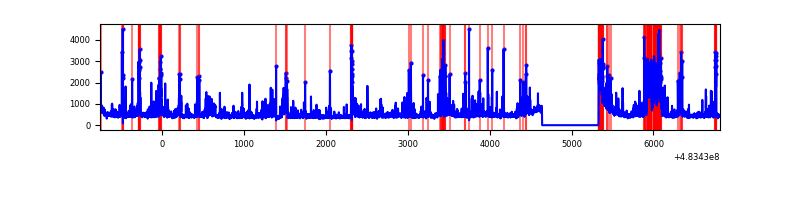 |
| D | 7570 | 6881 | 2328 | 2328 | 30.75% | 33.83% | 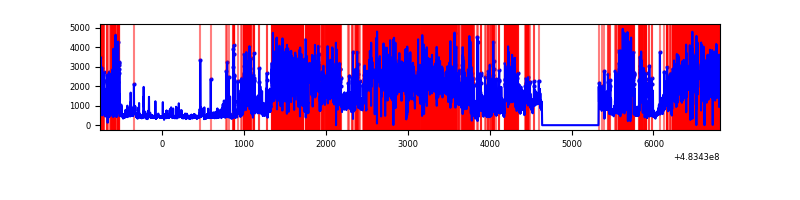 |
Top three noisy pixels from each quadrant. If the there are fewer than three noisy pixels in the level2.evt file, extra rows are filled as -1
| Pixel properties | Quadrant properties | ||||||
|---|---|---|---|---|---|---|---|
| Quadrant | DetID | PixID | Counts | Sigma | Mean | Median | Sigma |
| A | 4 | 175 | 414106 | 2252.36 | 750 | 731 | 183.5 |
| A | 15 | 174 | 337136 | 1832.97 | 750 | 731 | 183.5 |
| A | 12 | 3 | 232199 | 1261.2 | 750 | 731 | 183.5 |
| B | 1 | 207 | 292102 | 1825.58 | 742 | 715 | 159.6 |
| B | 4 | 81 | 194282 | 1212.72 | 742 | 715 | 159.6 |
| B | 0 | 171 | 119939 | 746.96 | 742 | 715 | 159.6 |
| C | 15 | 218 | 450656 | 2249.14 | 728 | 723 | 200.0 |
| C | 12 | 254 | 314569 | 1568.86 | 728 | 723 | 200.0 |
| C | 15 | 224 | 112677 | 559.64 | 728 | 723 | 200.0 |
| D | 11 | 129 | 6631922 | 39670.26 | 601 | 580 | 167.2 |
| D | 0 | 18 | 1098367 | 6567.22 | 601 | 580 | 167.2 |
| D | 3 | 12 | 155101 | 924.38 | 601 | 580 | 167.2 |
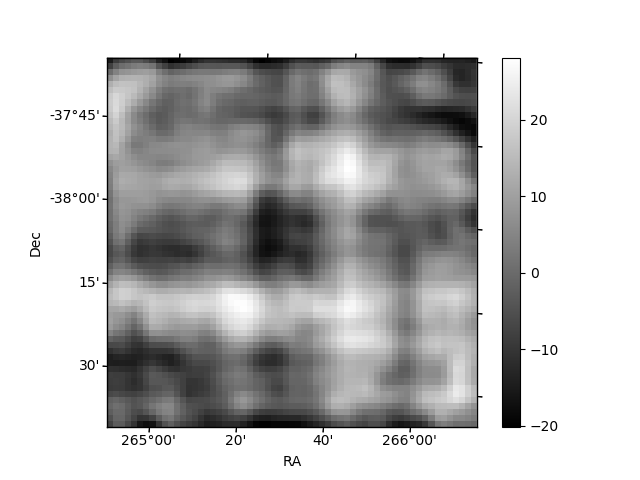
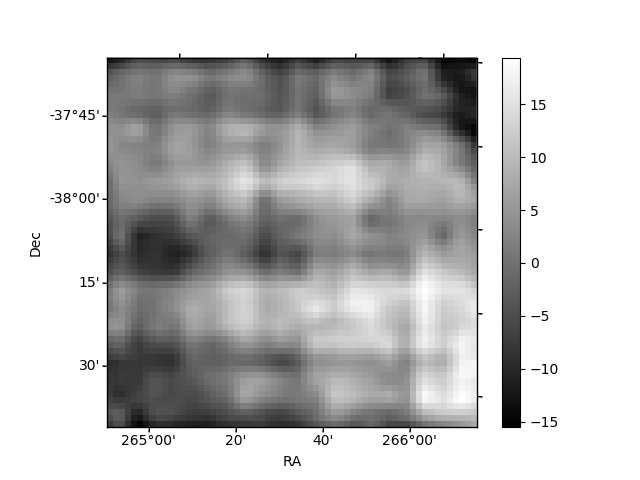
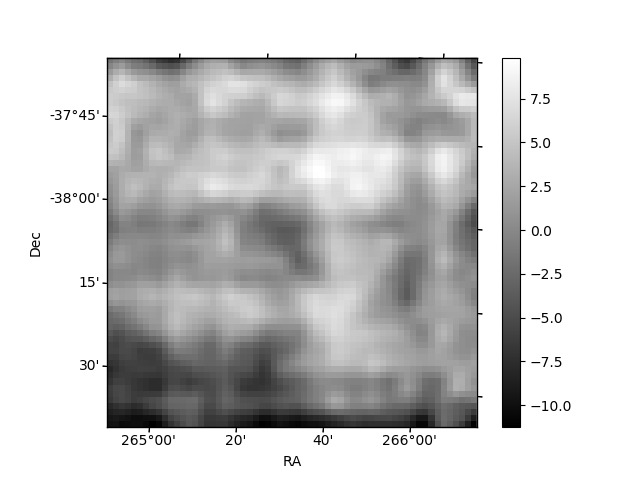
Histogram calculated using DETX and DETY for each event in the final _common_clean file
| Quadrant A | 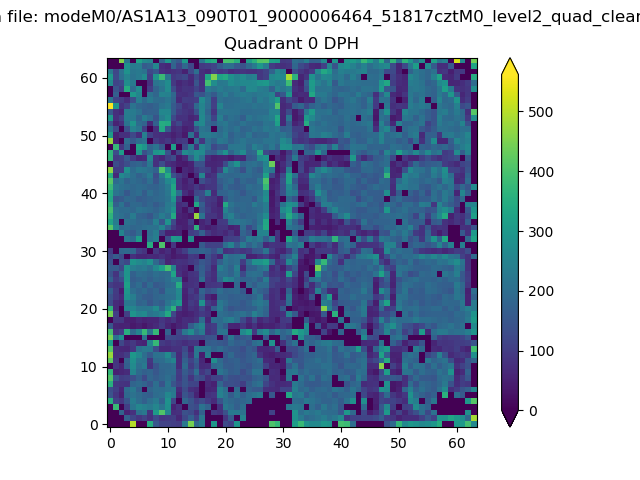 |
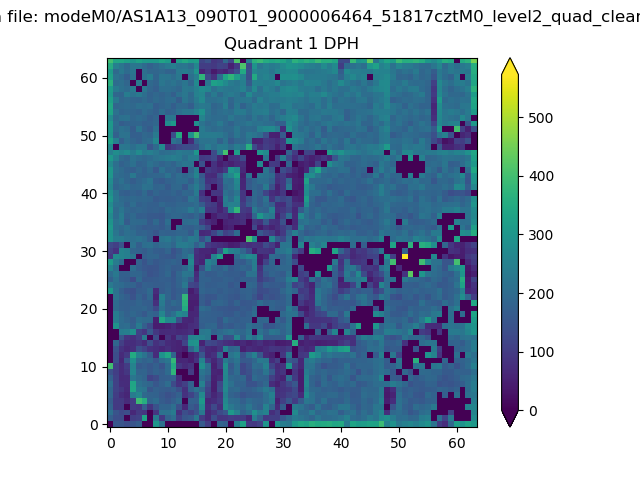 |
Quadrant B |
|---|---|---|---|
| Quadrant D | 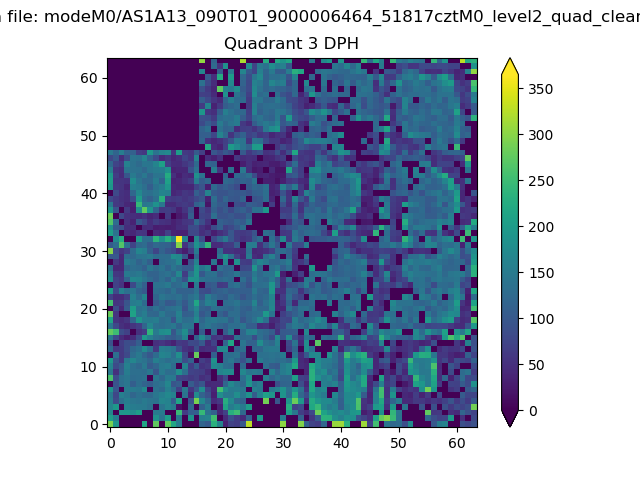 |
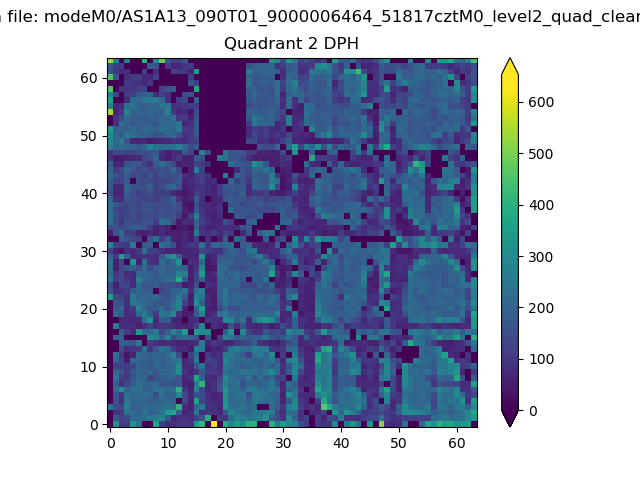 |
Quadrant C |
| Plot type | Count rate plots | Images |
|---|---|---|
| Comparison with Poisson distribution Blue bars denote a histogram of data divided into 1 sec bins. Red curve is a Poisson curve with rate = median count rate of data. |
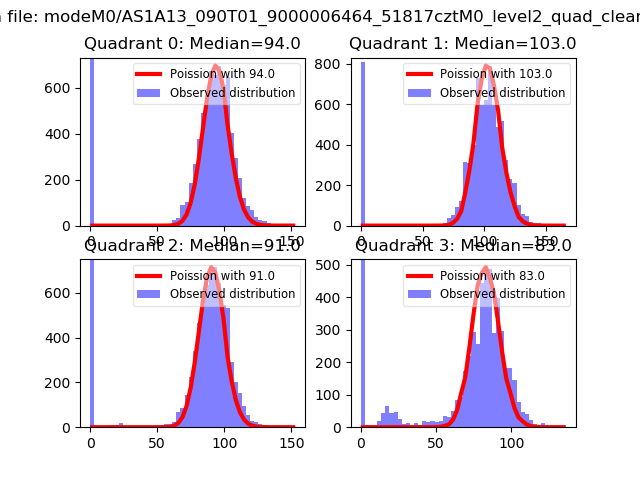 |
 |
| Quadrant-wise count rates Data is divided into 100 sec bins |
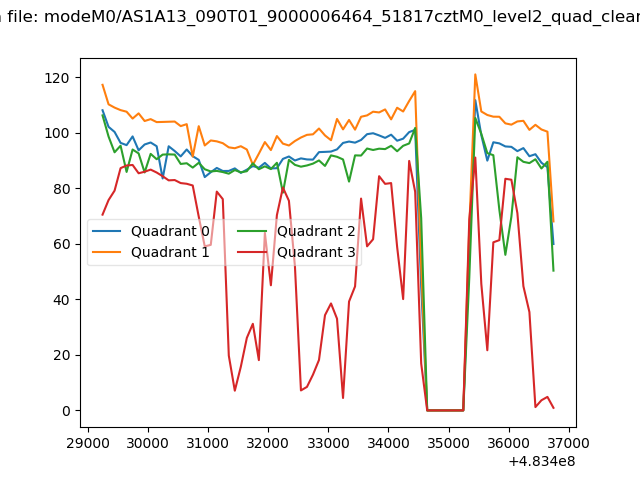 |
|
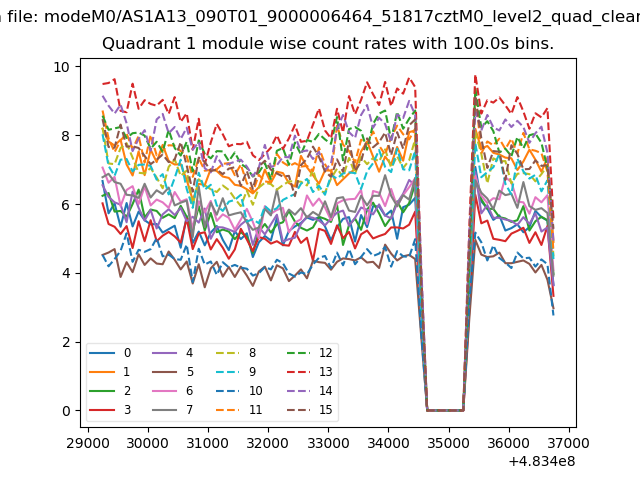
| Module-wise count rates for Quadrant A Data is divided into 100 sec bins |
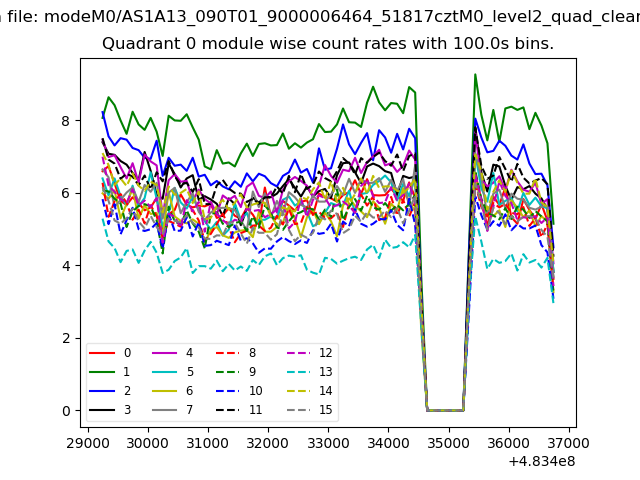 |
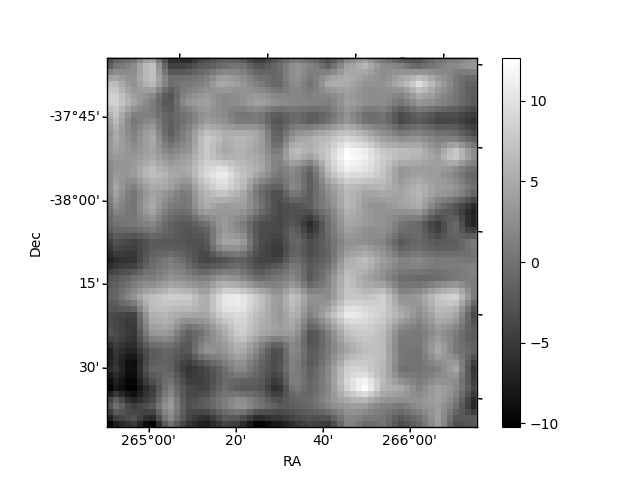 |
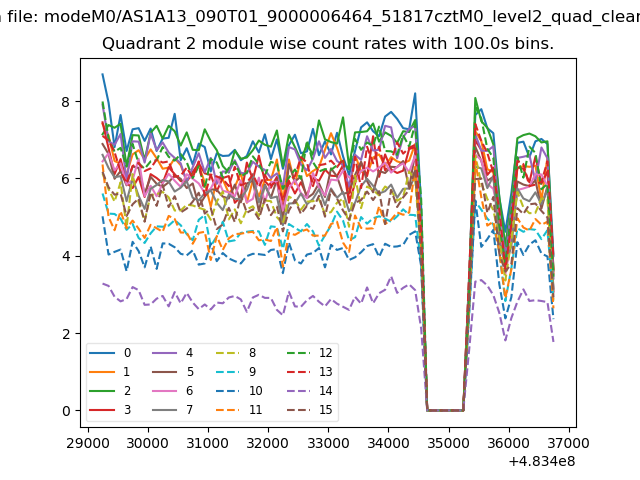
| Module-wise count rates for Quadrant B Data is divided into 100 sec bins |
 |
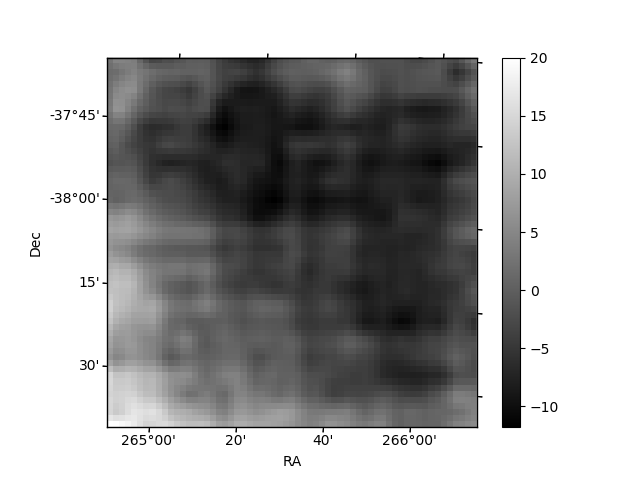 |
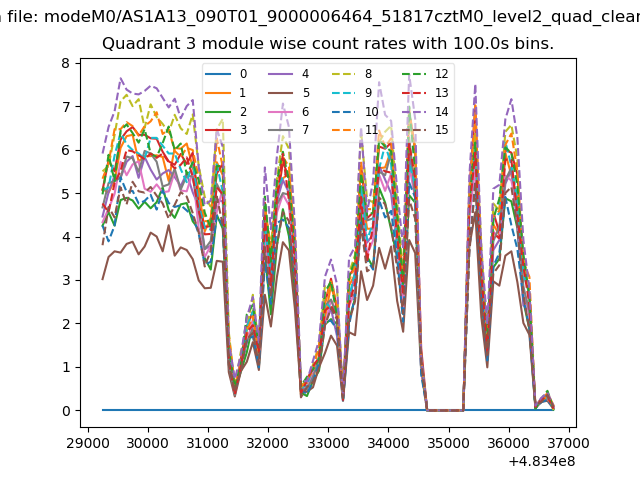
| Module-wise count rates for Quadrant C Data is divided into 100 sec bins |
 |
 |
| Module-wise count rates for Quadrant D Data is divided into 100 sec bins |
 |
 |
| Parameter | Plot |
|---|---|
| CZT HV Monitor | 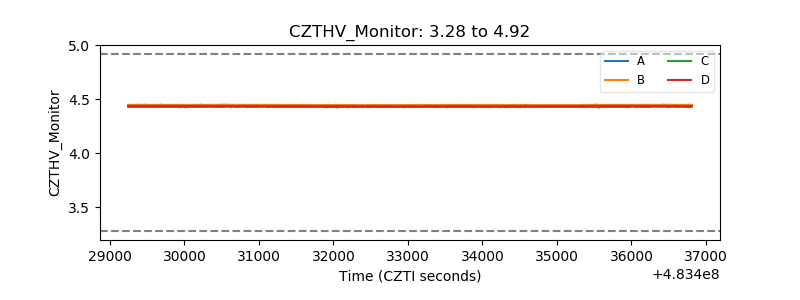 |
| D_VDD | 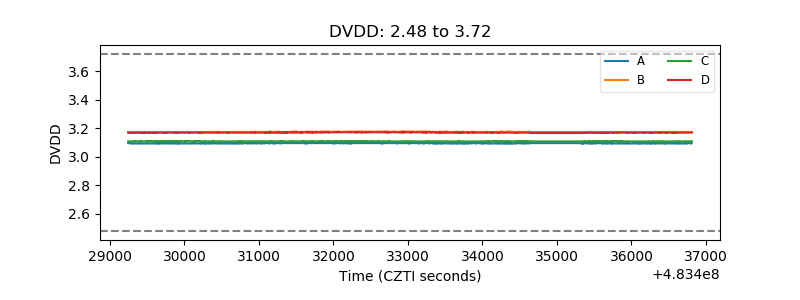 |
| Temperature 1 | 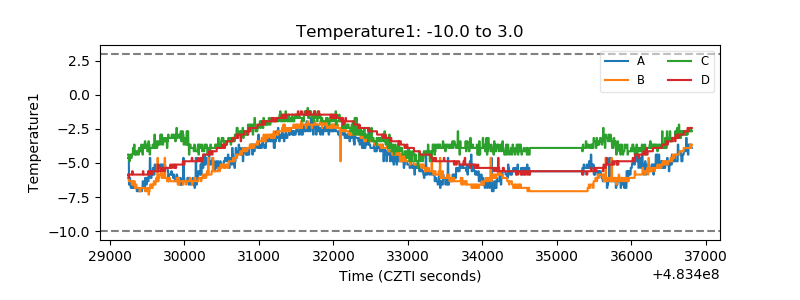 |
| Veto HV Monitor | 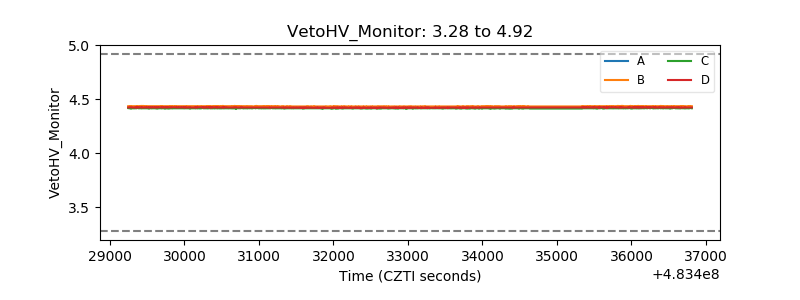 |
| Veto LLD | 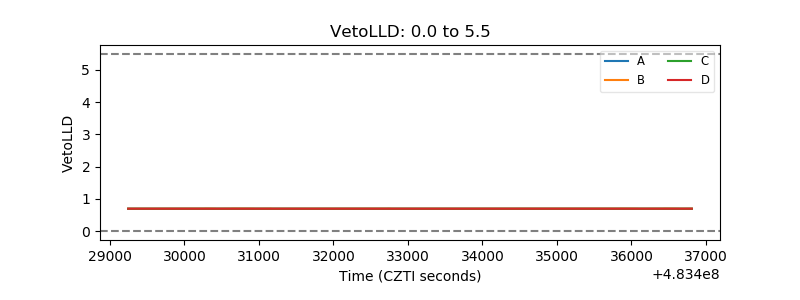 |
| Alpha Counter | 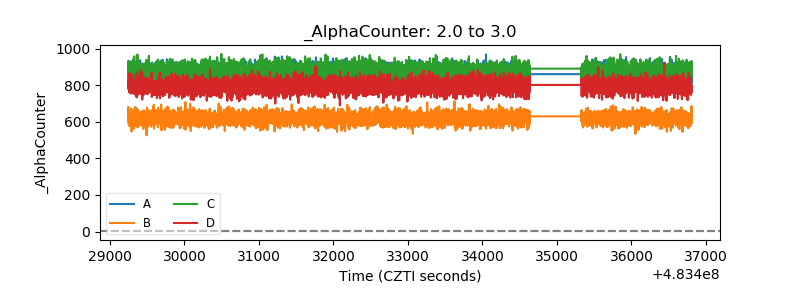 |
| _CPM_Rate | 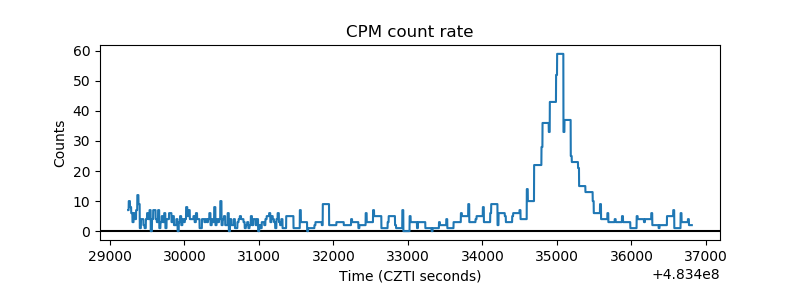 |
| CZT Counter | 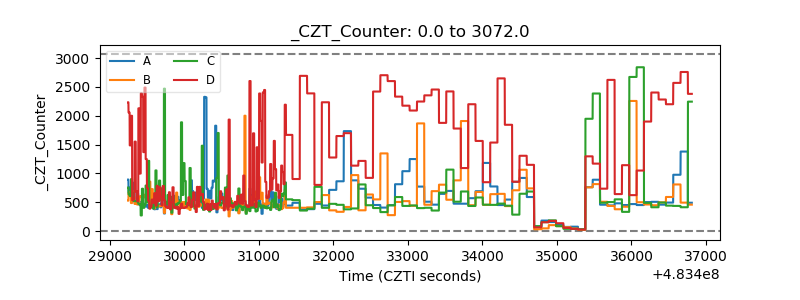 |
| +2.5 Volts monitor | 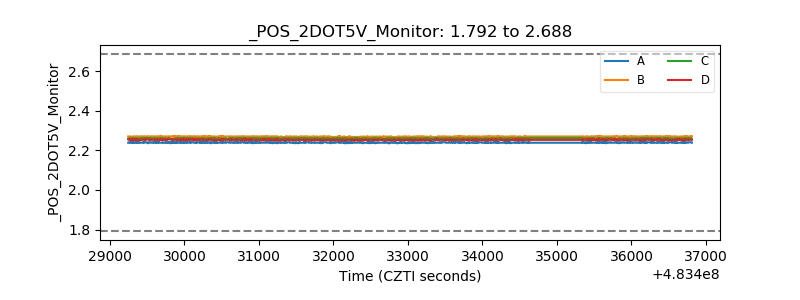 |
| +5 Volts monitor | 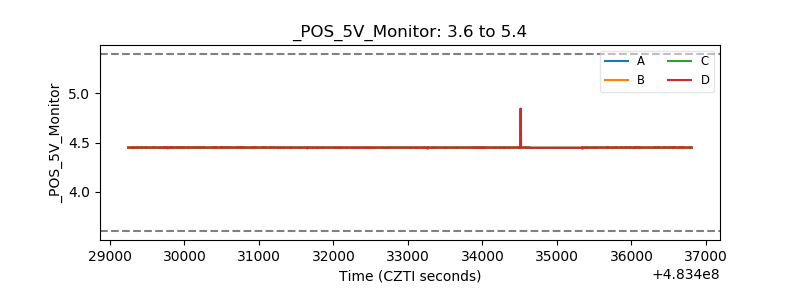 |
| _ROLL_ROT | 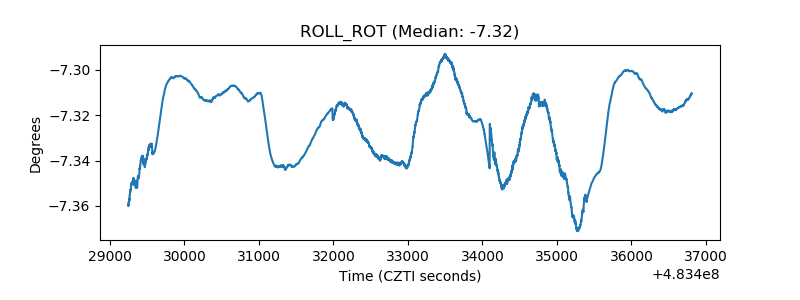 |
| _Roll_DEC | 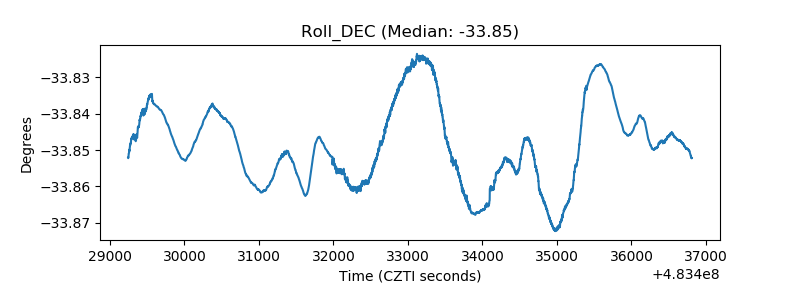 |
| _Roll_RA | 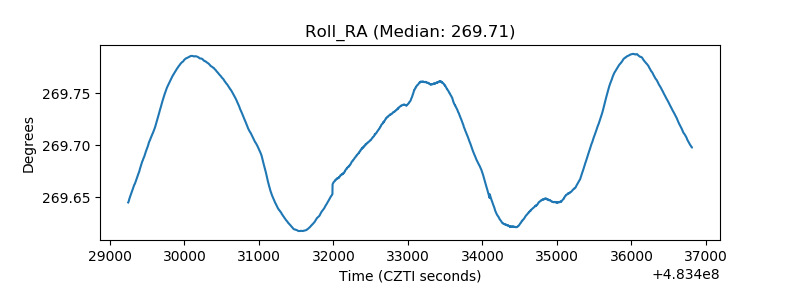 |
| Veto Counter | 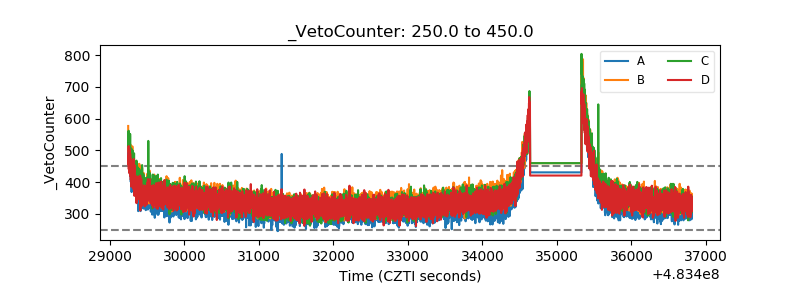 |