| Param | Original file | Final file |
|---|---|---|
| Filename | modeM0/AS1A13_090T01_9000006464_51818cztM0_level2.fits | modeM0/AS1A13_090T01_9000006464_51818cztM0_level2_quad_clean.evt |
| Size (bytes) | 794,782,080 | 97,246,080 |
| Size | 758.0 MB | 92.7 MB |
| Events in quadrant A | 5,157,321 | 672,617 |
| Events in quadrant B | 4,894,538 | 740,234 |
| Events in quadrant C | 4,786,459 | 673,214 |
| Events in quadrant D | 13,981,515 | 319,900 |
| Mode SS | |||
|---|---|---|---|
| Quadrant | BADHDUFLAG | Total packets | Discarded packets |
| A | 0 | 156 | 0 |
| B | 0 | 156 | 0 |
| C | 0 | 156 | 0 |
| D | 0 | 156 | 0 |
| Mode M0 | |||
|---|---|---|---|
| Quadrant | BADHDUFLAG | Total packets | Discarded packets |
| A | 0 | 20572 | 1 |
| B | 0 | 19742 | 1 |
| C | 0 | 19716 | 1 |
| D | 0 | 46904 | 1 |
| Quadrant | Total seconds | Saturated seconds | Saturation percentage |
|---|---|---|---|
| A | 7737 | 569 | 7.354272% |
| B | 7738 | 504 | 6.513311% |
| C | 7738 | 455 | 5.880072% |
| D | 7738 | 4237 | 54.755751% |
Noise dominated data is calculated using 1-second bins in cleaned event files. If a bin has >2000 counts, and if more than 50% of those come from <1% of pixels, then it is considered to be noise-dominated and hence unusable.
| Quadrant | # 1 sec bins | Bins with >0 counts | Bins with >2000 counts | High rate bins dominated by noise | Noise dominated (total time) | Noise dominated (detector-on time) | Marked lightcurve |
|---|---|---|---|---|---|---|---|
| A | 7772 | 7738 | 137 | 137 | 1.76% | 1.77% | 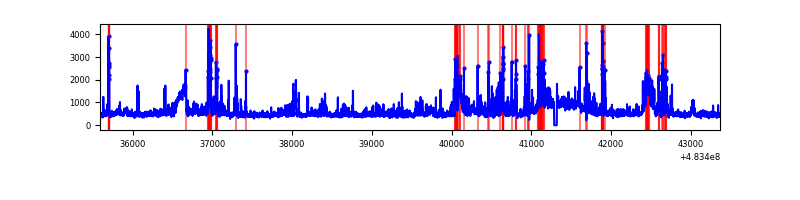 |
| B | 7773 | 7739 | 59 | 59 | 0.76% | 0.76% | 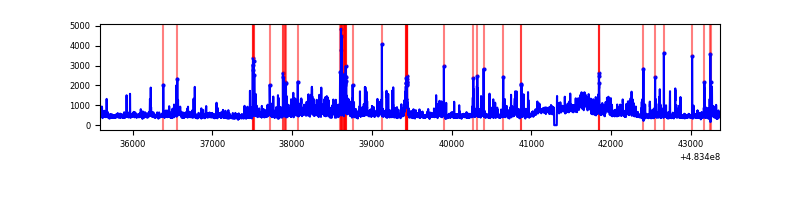 |
| C | 7773 | 7739 | 197 | 197 | 2.53% | 2.55% | 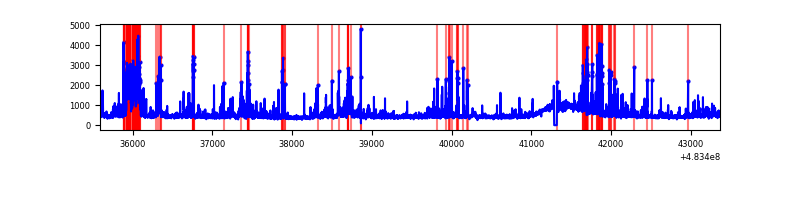 |
| D | 7773 | 7738 | 3567 | 3567 | 45.89% | 46.10% | 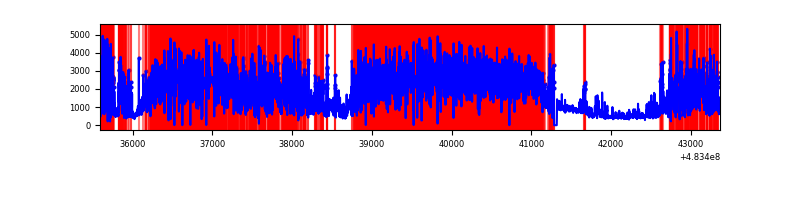 |
Top three noisy pixels from each quadrant. If the there are fewer than three noisy pixels in the level2.evt file, extra rows are filled as -1
| Pixel properties | Quadrant properties | ||||||
|---|---|---|---|---|---|---|---|
| Quadrant | DetID | PixID | Counts | Sigma | Mean | Median | Sigma |
| A | 15 | 174 | 883436 | 4244.36 | 855 | 834 | 207.9 |
| A | 10 | 253 | 270098 | 1294.87 | 855 | 834 | 207.9 |
| A | 5 | 240 | 106864 | 509.89 | 855 | 834 | 207.9 |
| B | 10 | 128 | 473624 | 2569.62 | 852 | 819 | 184.0 |
| B | 5 | 32 | 262458 | 1421.97 | 852 | 819 | 184.0 |
| B | 0 | 143 | 153479 | 829.68 | 852 | 819 | 184.0 |
| C | 15 | 218 | 500988 | 2181.96 | 849 | 841 | 229.2 |
| C | 12 | 254 | 250191 | 1087.82 | 849 | 841 | 229.2 |
| C | 0 | 192 | 142639 | 618.61 | 849 | 841 | 229.2 |
| D | 11 | 129 | 9655385 | 57247.79 | 615 | 593 | 168.6 |
| D | 0 | 18 | 824160 | 4883.31 | 615 | 593 | 168.6 |
| D | 8 | 48 | 688909 | 4081.35 | 615 | 593 | 168.6 |
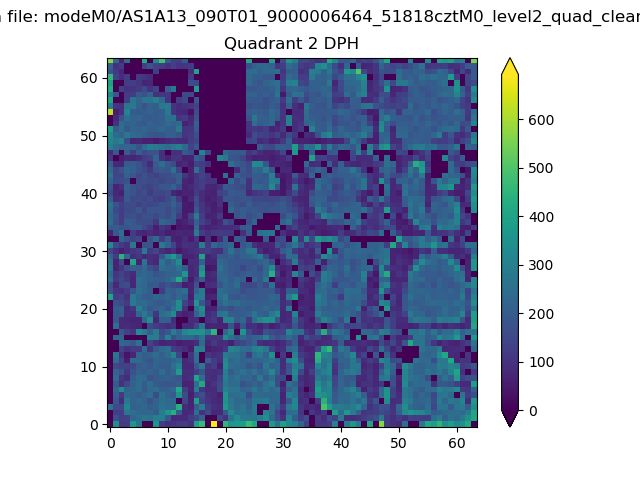
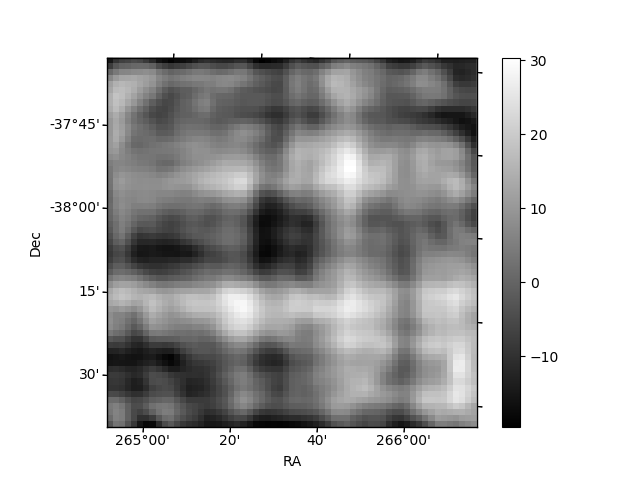
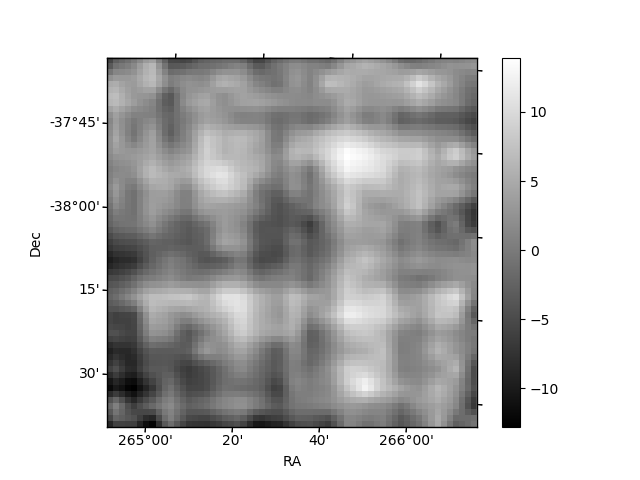
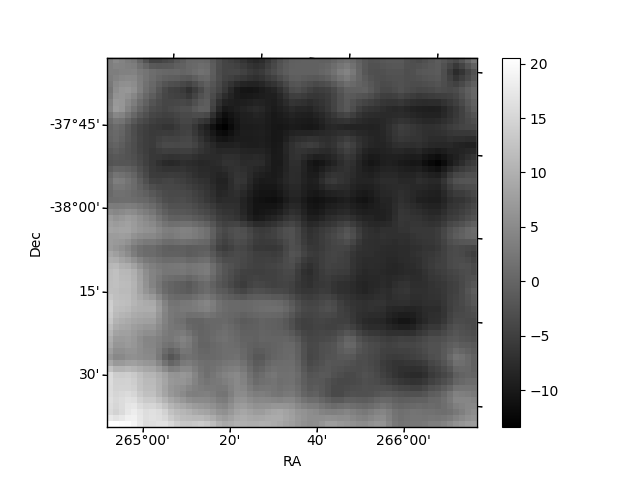
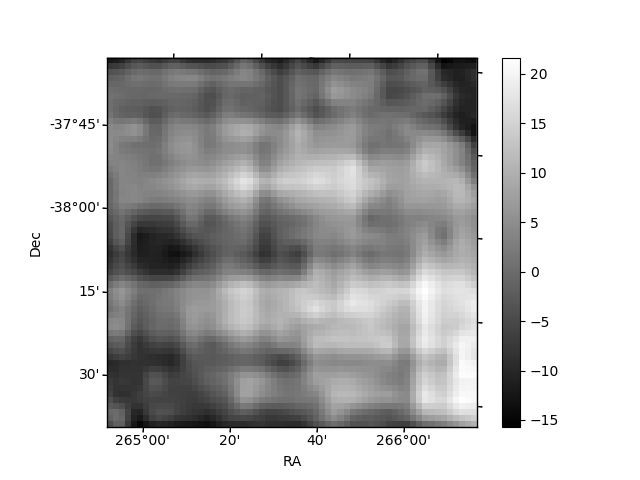
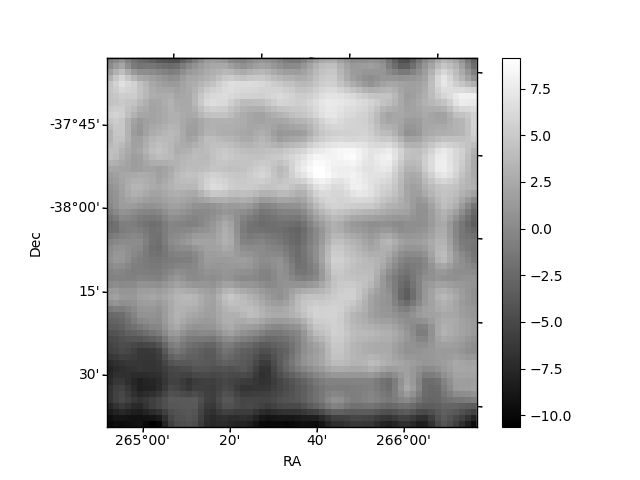
Histogram calculated using DETX and DETY for each event in the final _common_clean file
| Quadrant A | 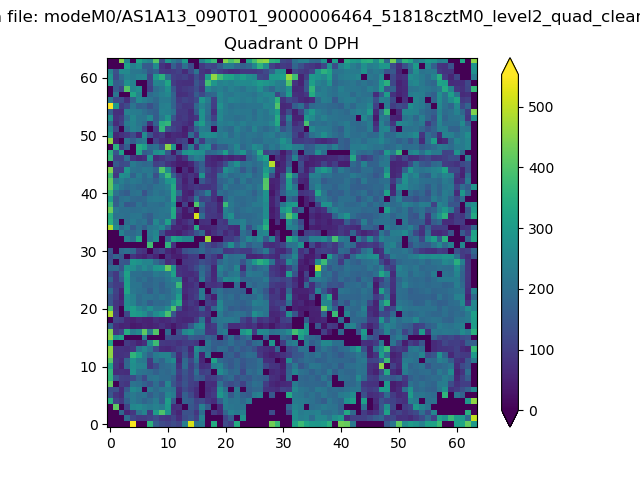 |
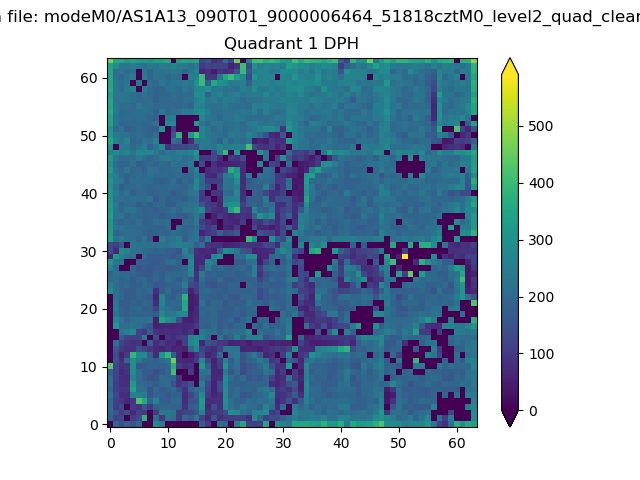 |
Quadrant B |
|---|---|---|---|
| Quadrant D | 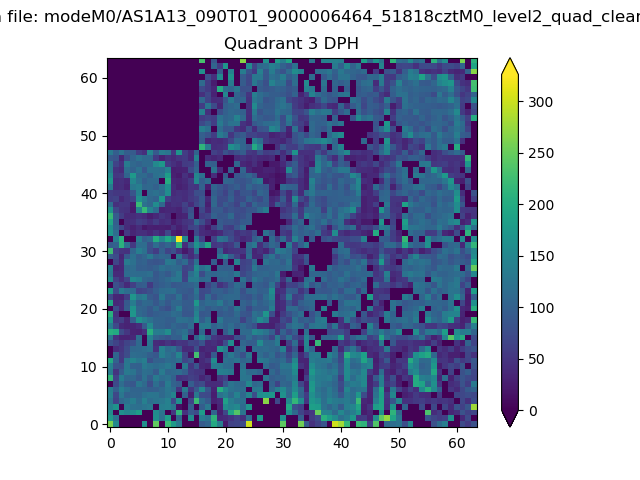 |
 |
Quadrant C |
| Plot type | Count rate plots | Images |
|---|---|---|
| Comparison with Poisson distribution Blue bars denote a histogram of data divided into 1 sec bins. Red curve is a Poisson curve with rate = median count rate of data. |
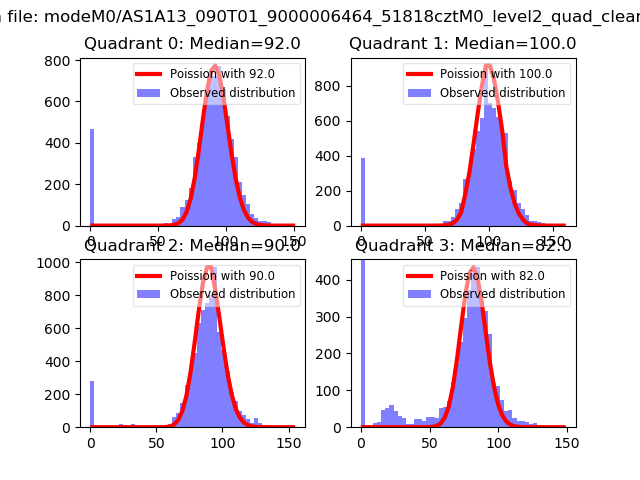 |
 |
| Quadrant-wise count rates Data is divided into 100 sec bins |
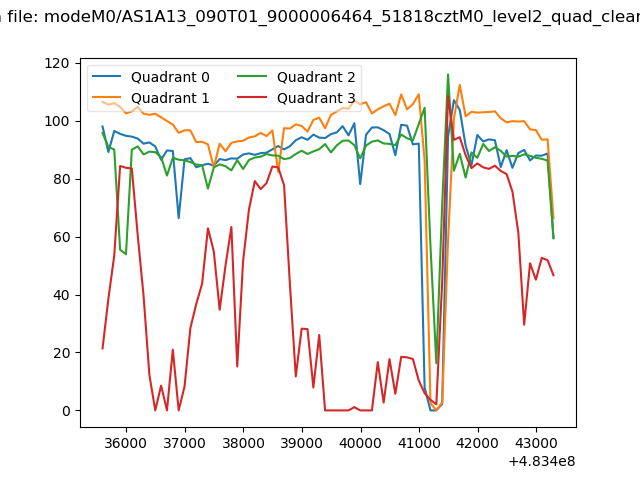 |
|
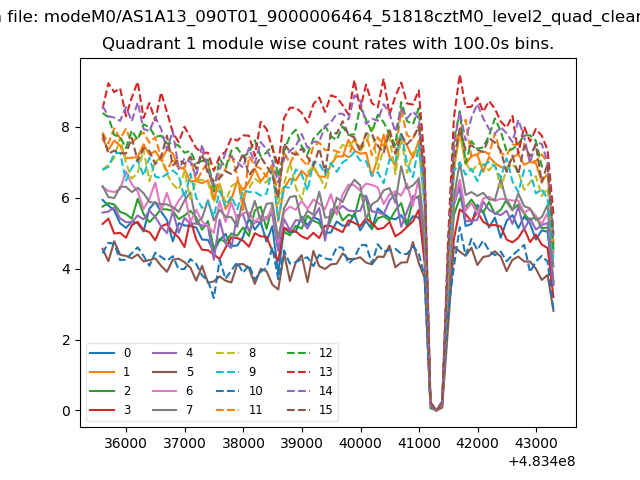
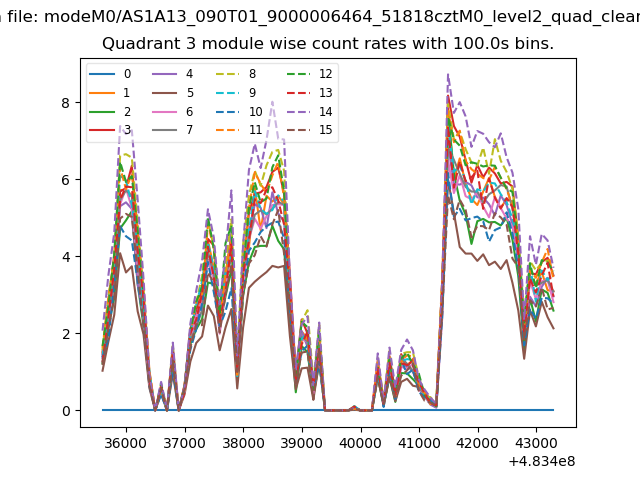
| Module-wise count rates for Quadrant A Data is divided into 100 sec bins |
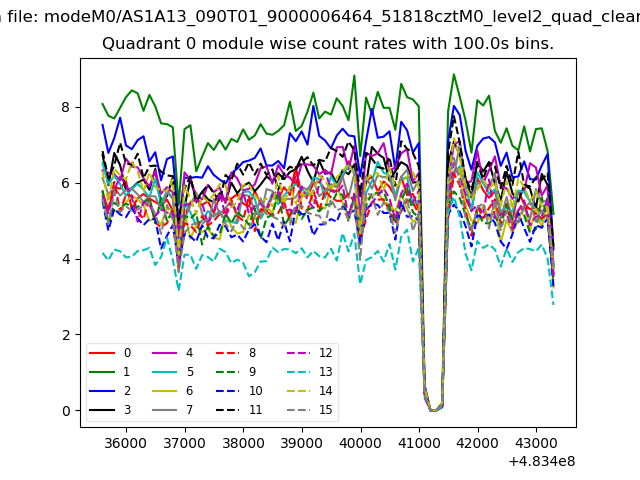 |
 |
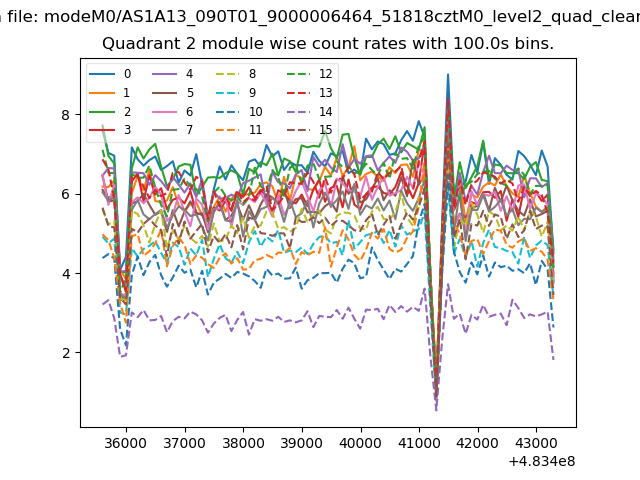
| Module-wise count rates for Quadrant B Data is divided into 100 sec bins |
 |
 |
| Module-wise count rates for Quadrant C Data is divided into 100 sec bins |
 |
 |
| Module-wise count rates for Quadrant D Data is divided into 100 sec bins |
 |
 |
| Parameter | Plot |
|---|---|
| CZT HV Monitor |  |
| D_VDD | 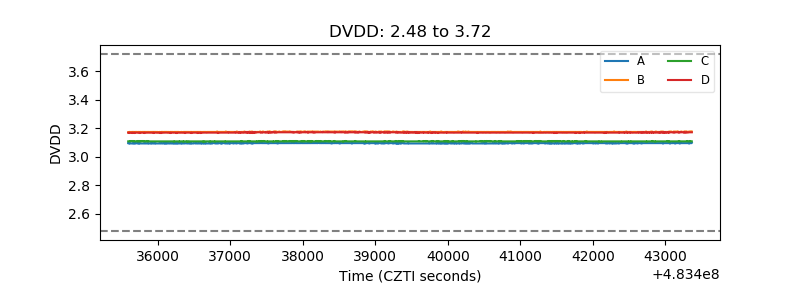 |
| Temperature 1 | 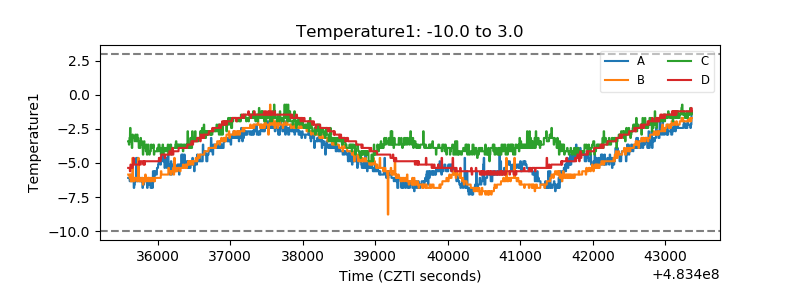 |
| Veto HV Monitor | 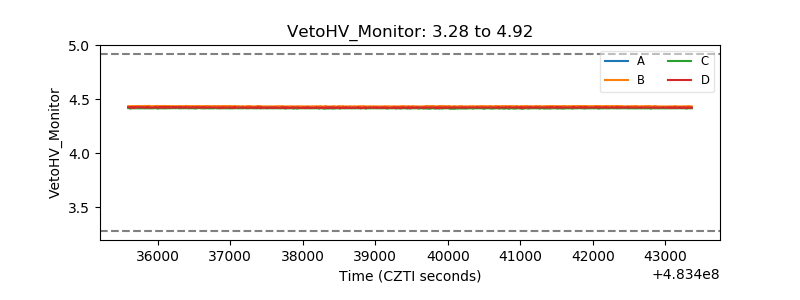 |
| Veto LLD | 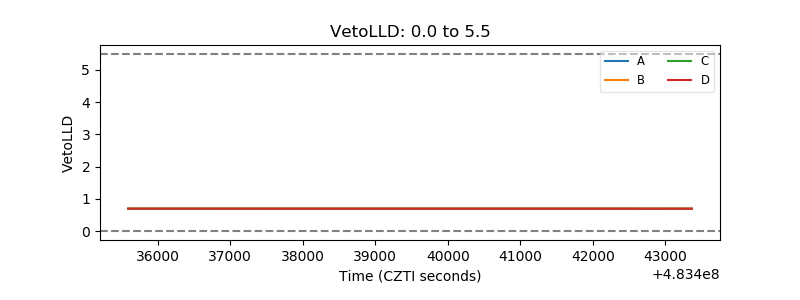 |
| Alpha Counter | 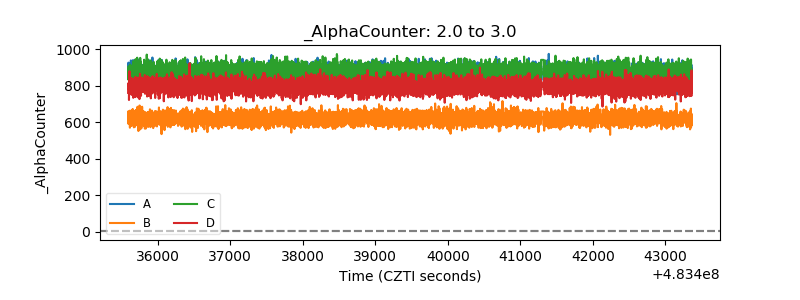 |
| _CPM_Rate | 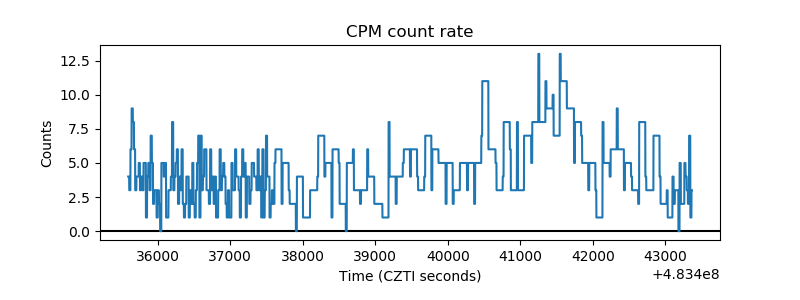 |
| CZT Counter | 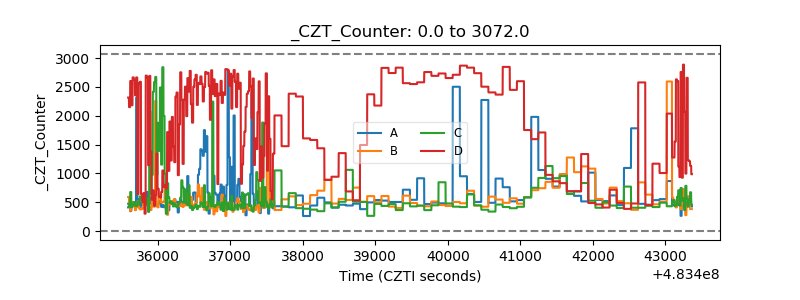 |
| +2.5 Volts monitor | 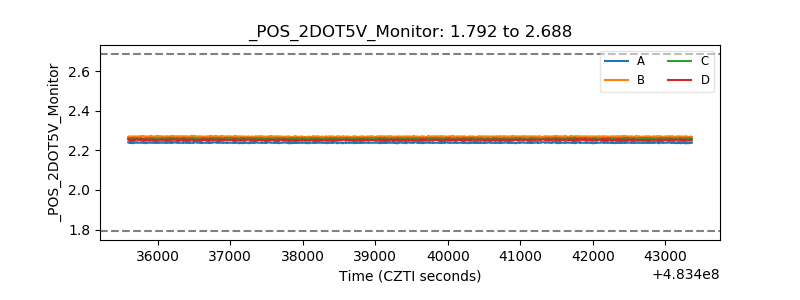 |
| +5 Volts monitor | 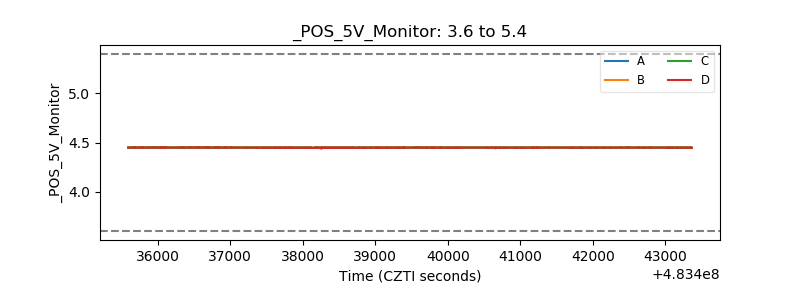 |
| _ROLL_ROT | 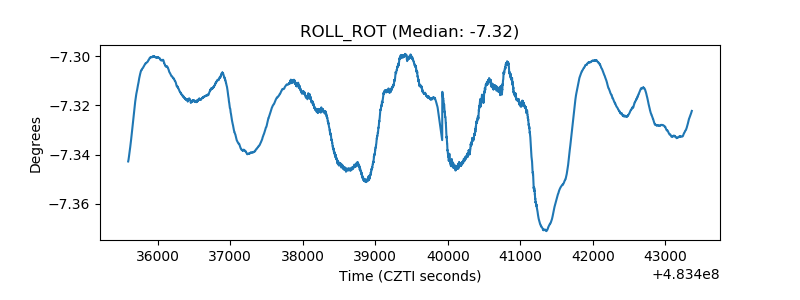 |
| _Roll_DEC | 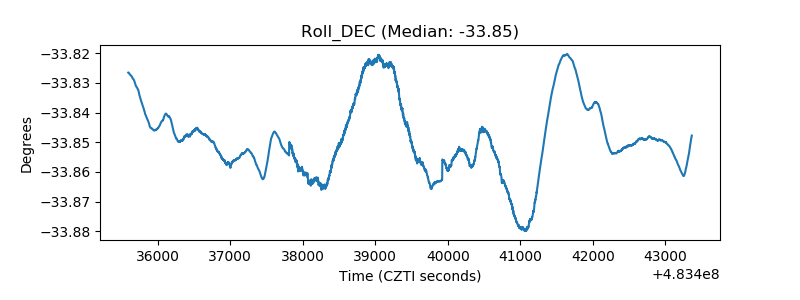 |
| _Roll_RA | 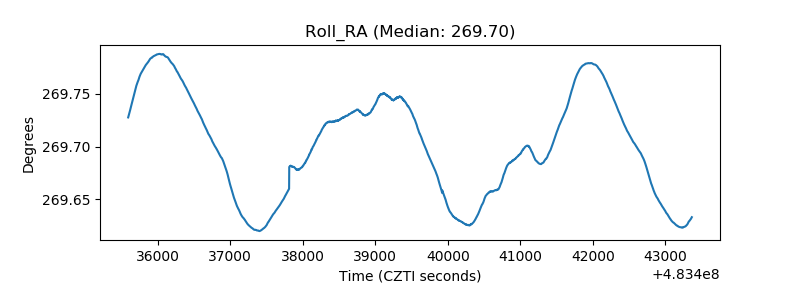 |
| Veto Counter | 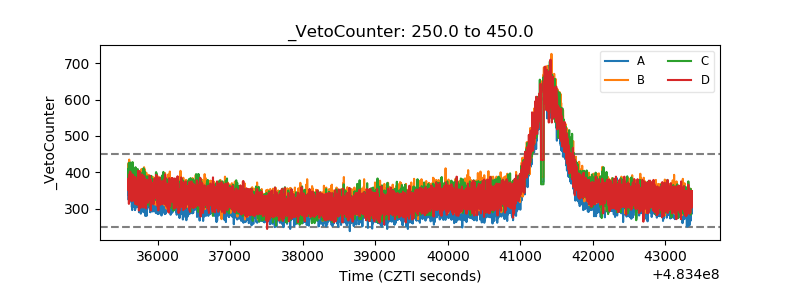 |