| Param | Original file | Final file |
|---|---|---|
| Filename | modeM0/AS1A13_090T01_9000006464_51819cztM0_level2.fits | modeM0/AS1A13_090T01_9000006464_51819cztM0_level2_quad_clean.evt |
| Size (bytes) | 713,059,200 | 103,276,800 |
| Size | 680.0 MB | 98.5 MB |
| Events in quadrant A | 5,200,140 | 675,787 |
| Events in quadrant B | 5,522,598 | 741,404 |
| Events in quadrant C | 5,722,678 | 665,278 |
| Events in quadrant D | 9,363,723 | 517,883 |
| Mode SS | |||
|---|---|---|---|
| Quadrant | BADHDUFLAG | Total packets | Discarded packets |
| A | 0 | 150 | 0 |
| B | 0 | 150 | 0 |
| C | 0 | 150 | 0 |
| D | 0 | 150 | 0 |
| Mode M0 | |||
|---|---|---|---|
| Quadrant | BADHDUFLAG | Total packets | Discarded packets |
| A | 0 | 20585 | 0 |
| B | 0 | 21632 | 1 |
| C | 0 | 22286 | 0 |
| D | 0 | 33020 | 0 |
| Quadrant | Total seconds | Saturated seconds | Saturation percentage |
|---|---|---|---|
| A | 7573 | 349 | 4.608477% |
| B | 7572 | 313 | 4.133650% |
| C | 7572 | 322 | 4.252509% |
| D | 7572 | 1656 | 21.870048% |
Noise dominated data is calculated using 1-second bins in cleaned event files. If a bin has >2000 counts, and if more than 50% of those come from <1% of pixels, then it is considered to be noise-dominated and hence unusable.
| Quadrant | # 1 sec bins | Bins with >0 counts | Bins with >2000 counts | High rate bins dominated by noise | Noise dominated (total time) | Noise dominated (detector-on time) | Marked lightcurve |
|---|---|---|---|---|---|---|---|
| A | 7573 | 7573 | 261 | 261 | 3.45% | 3.45% | 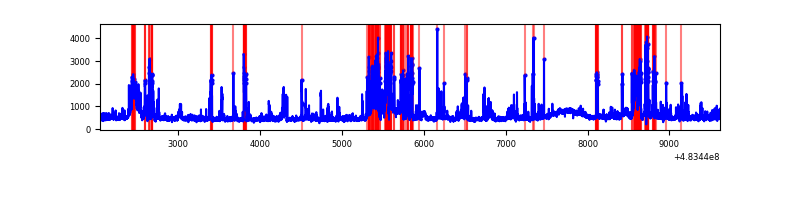 |
| B | 7572 | 7572 | 124 | 124 | 1.64% | 1.64% | 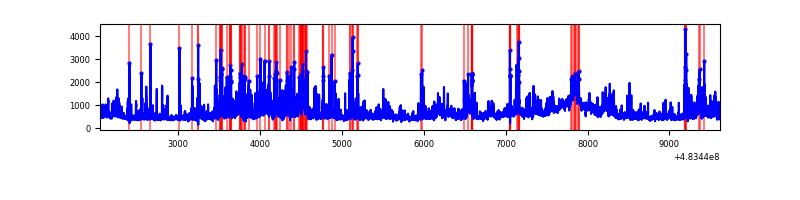 |
| C | 7572 | 7572 | 190 | 190 | 2.51% | 2.51% | 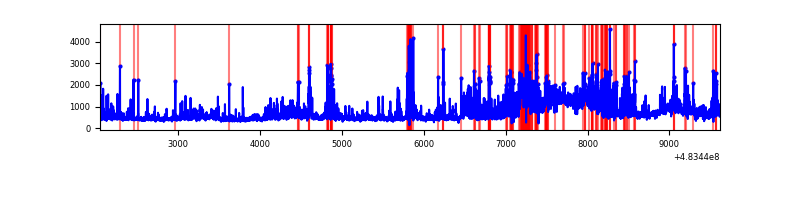 |
| D | 7572 | 7572 | 1501 | 1501 | 19.82% | 19.82% | 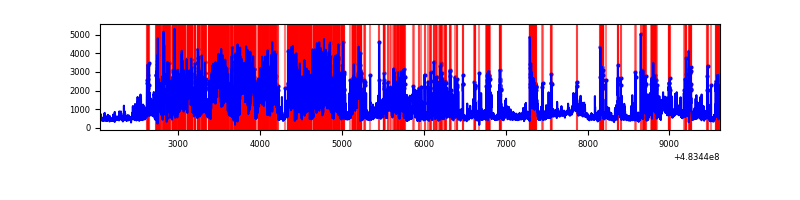 |
Top three noisy pixels from each quadrant. If the there are fewer than three noisy pixels in the level2.evt file, extra rows are filled as -1
| Pixel properties | Quadrant properties | ||||||
|---|---|---|---|---|---|---|---|
| Quadrant | DetID | PixID | Counts | Sigma | Mean | Median | Sigma |
| A | 15 | 174 | 1253102 | 6357.11 | 809 | 789 | 197.0 |
| A | 5 | 240 | 117352 | 591.71 | 809 | 789 | 197.0 |
| A | 12 | 3 | 94613 | 476.28 | 809 | 789 | 197.0 |
| B | 10 | 128 | 554212 | 3170.9 | 804 | 772 | 174.5 |
| B | 5 | 32 | 361652 | 2067.64 | 804 | 772 | 174.5 |
| B | 4 | 170 | 268112 | 1531.71 | 804 | 772 | 174.5 |
| C | 9 | 38 | 650648 | 2971.36 | 790 | 783 | 218.7 |
| C | 15 | 219 | 418861 | 1911.56 | 790 | 783 | 218.7 |
| C | 15 | 192 | 320689 | 1462.7 | 790 | 783 | 218.7 |
| D | 11 | 129 | 5053007 | 25445.19 | 719 | 693 | 198.6 |
| D | 3 | 12 | 623189 | 3135.1 | 719 | 693 | 198.6 |
| D | 0 | 18 | 300872 | 1511.8 | 719 | 693 | 198.6 |
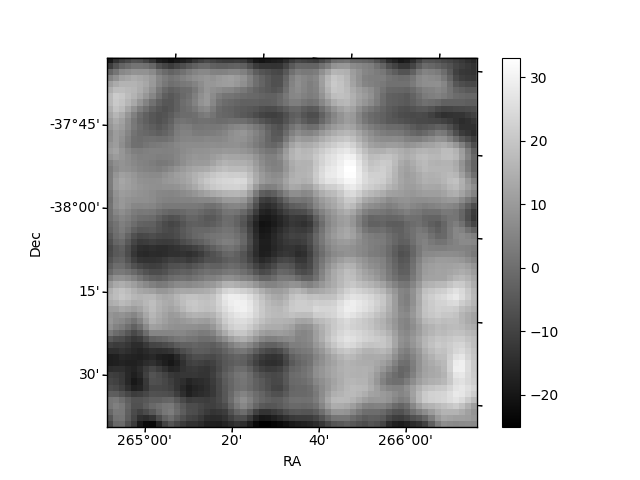
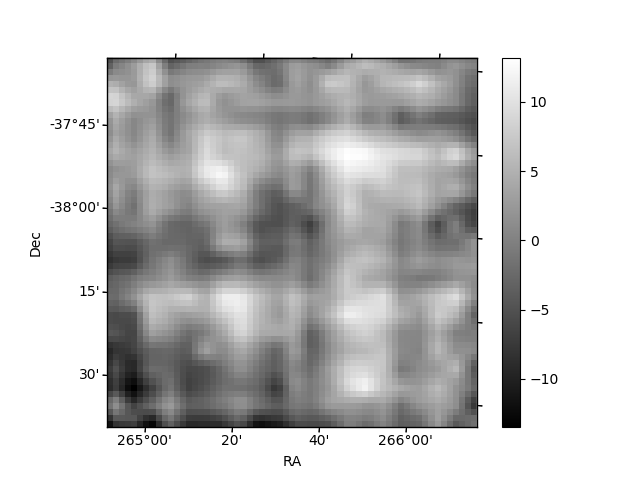
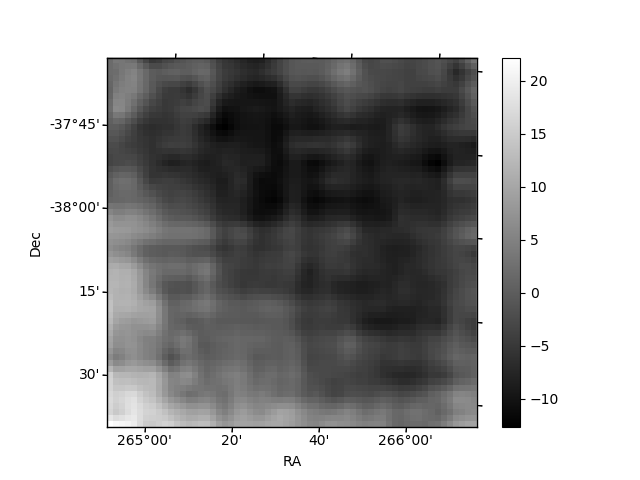
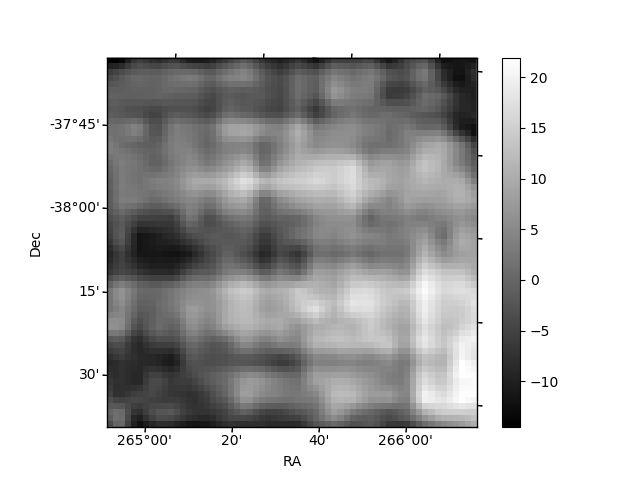
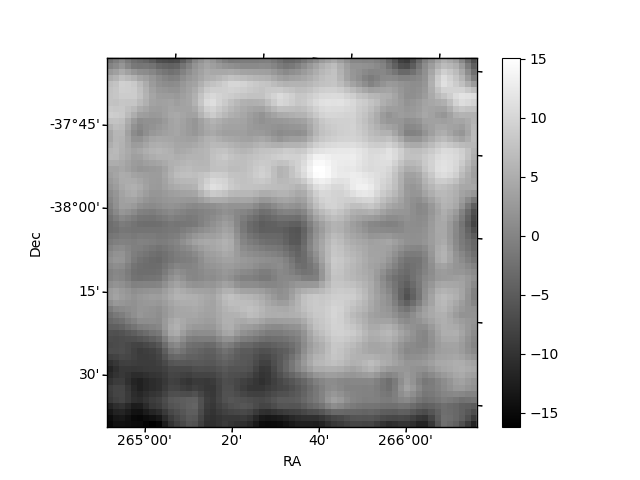
Histogram calculated using DETX and DETY for each event in the final _common_clean file
| Quadrant A | 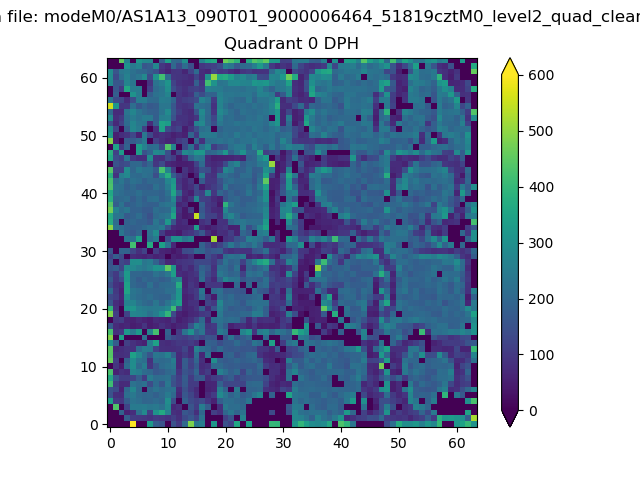 |
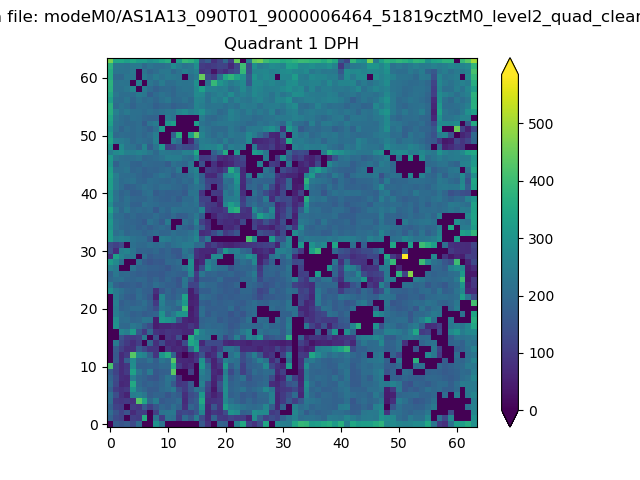 |
Quadrant B |
|---|---|---|---|
| Quadrant D | 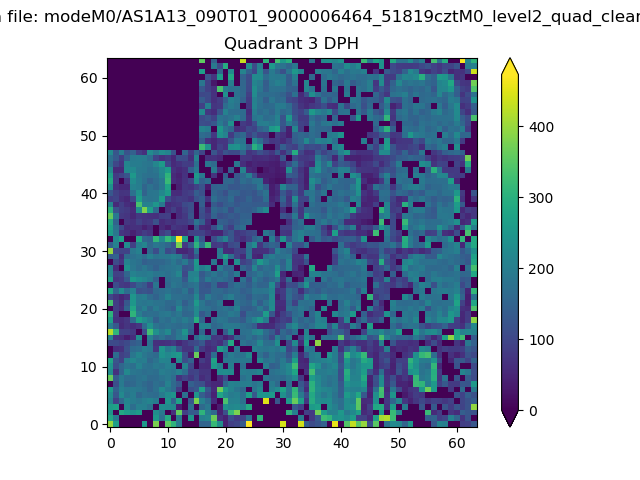 |
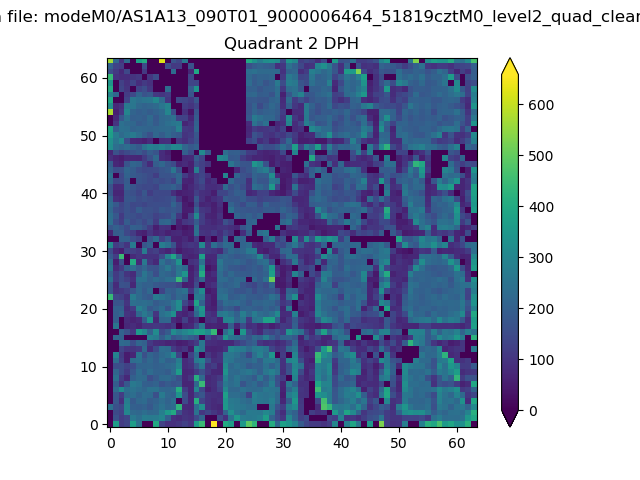 |
Quadrant C |
| Plot type | Count rate plots | Images |
|---|---|---|
| Comparison with Poisson distribution Blue bars denote a histogram of data divided into 1 sec bins. Red curve is a Poisson curve with rate = median count rate of data. |
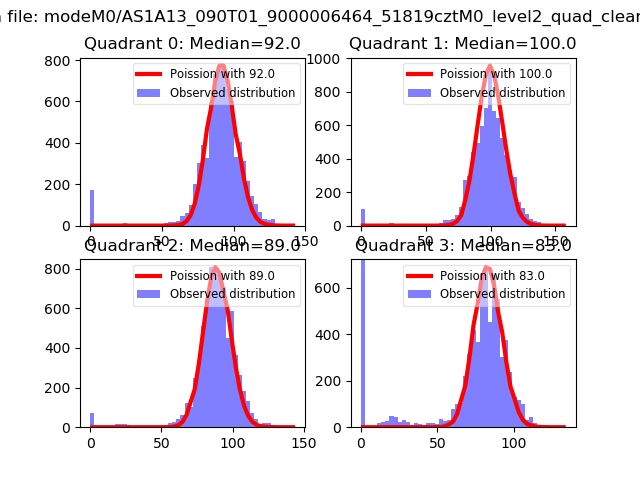 |
 |
| Quadrant-wise count rates Data is divided into 100 sec bins |
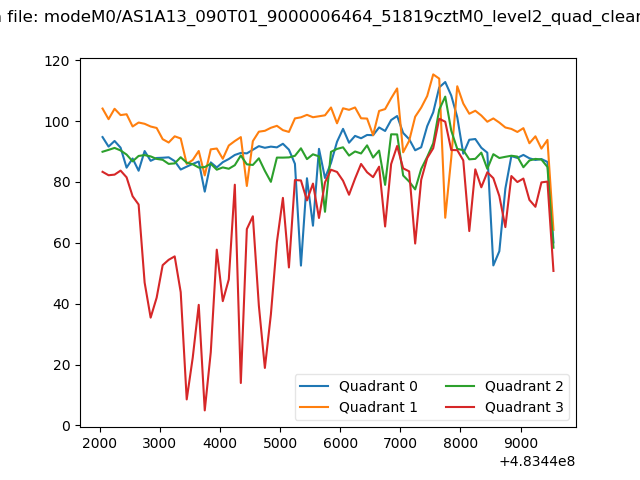 |
|
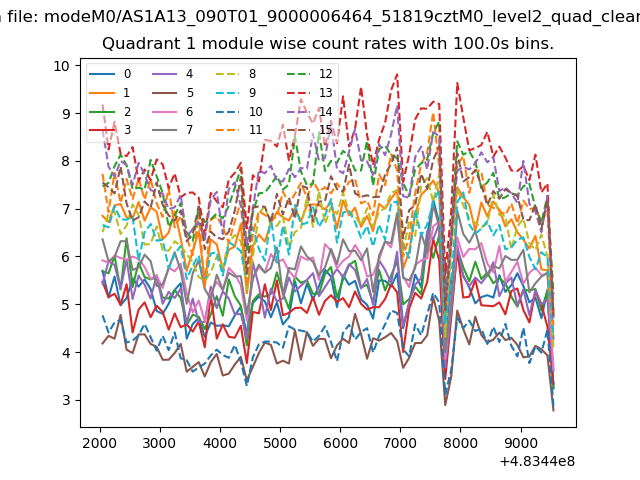
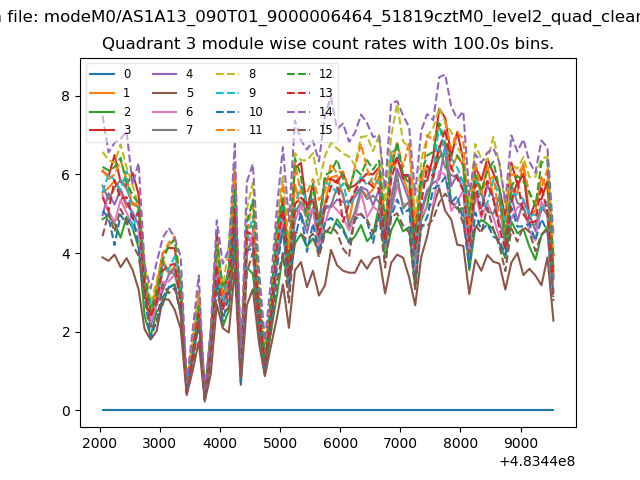
| Module-wise count rates for Quadrant A Data is divided into 100 sec bins |
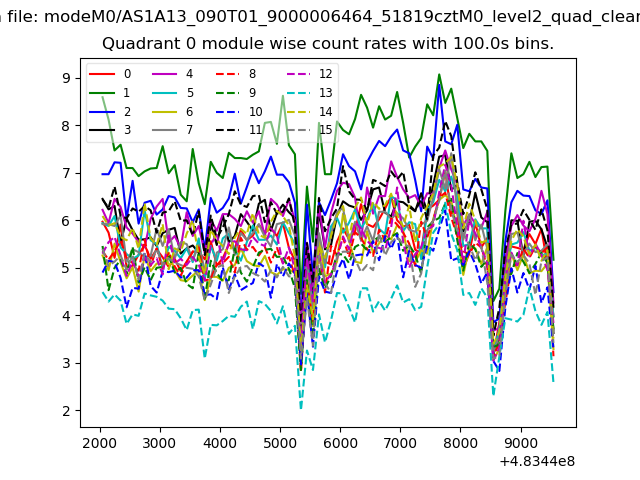 |
 |
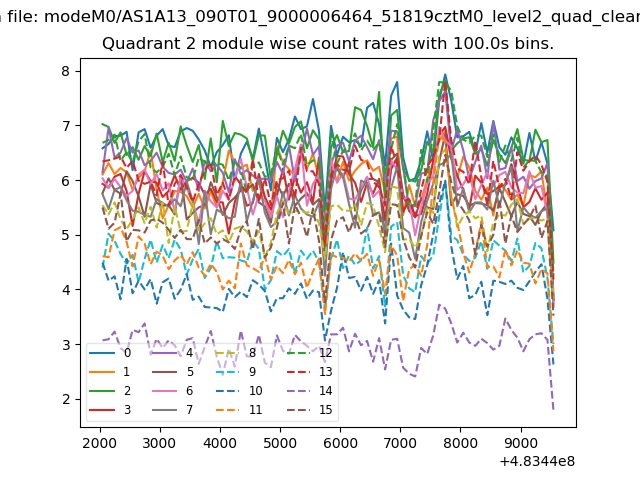
| Module-wise count rates for Quadrant B Data is divided into 100 sec bins |
 |
 |
| Module-wise count rates for Quadrant C Data is divided into 100 sec bins |
 |
 |
| Module-wise count rates for Quadrant D Data is divided into 100 sec bins |
 |
 |
| Parameter | Plot |
|---|---|
| CZT HV Monitor |  |
| D_VDD | 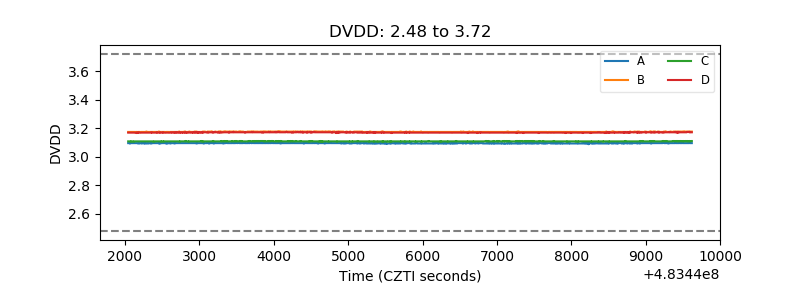 |
| Temperature 1 | 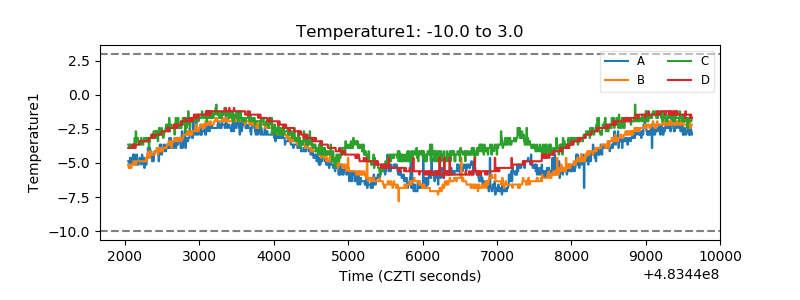 |
| Veto HV Monitor | 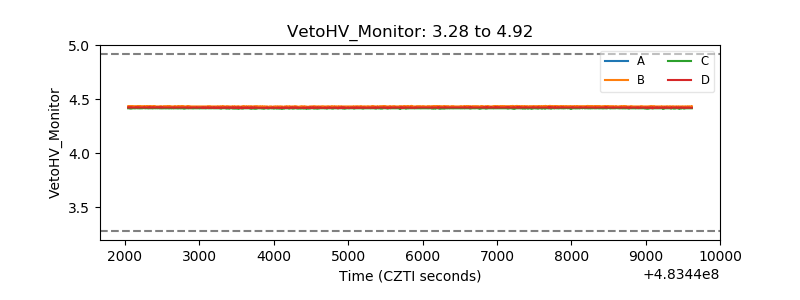 |
| Veto LLD | 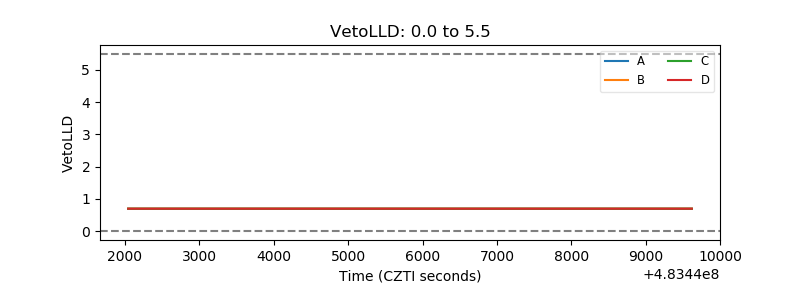 |
| Alpha Counter | 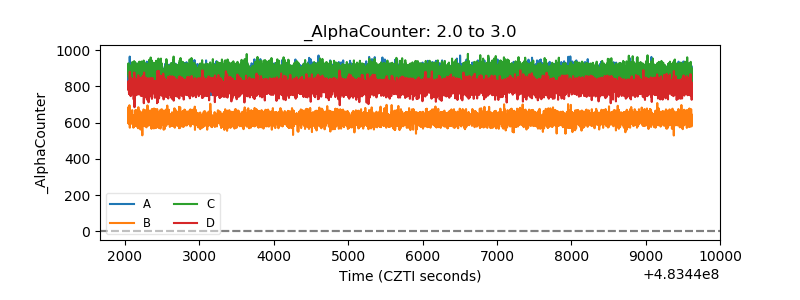 |
| _CPM_Rate | 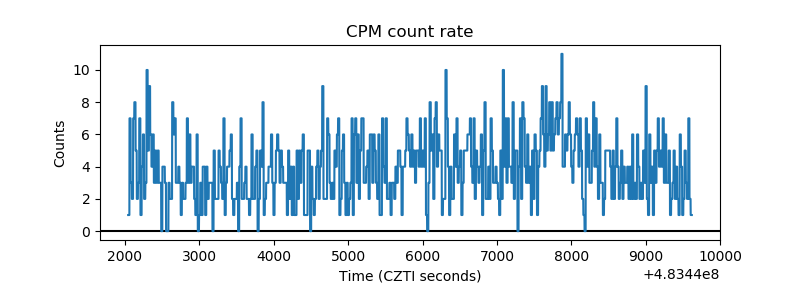 |
| CZT Counter | 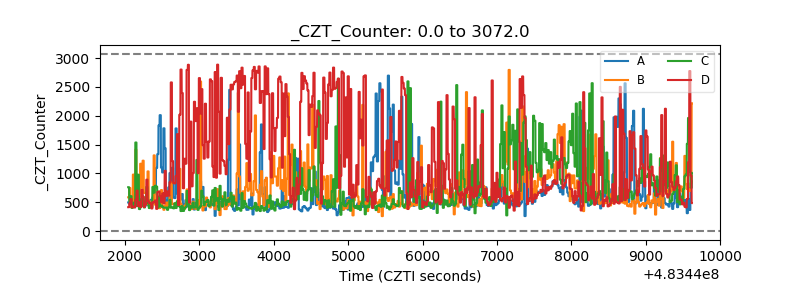 |
| +2.5 Volts monitor | 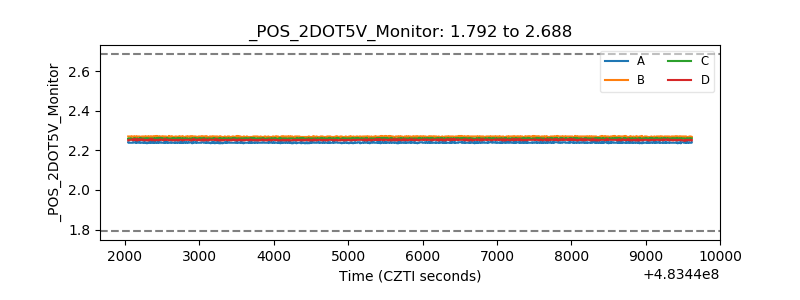 |
| +5 Volts monitor | 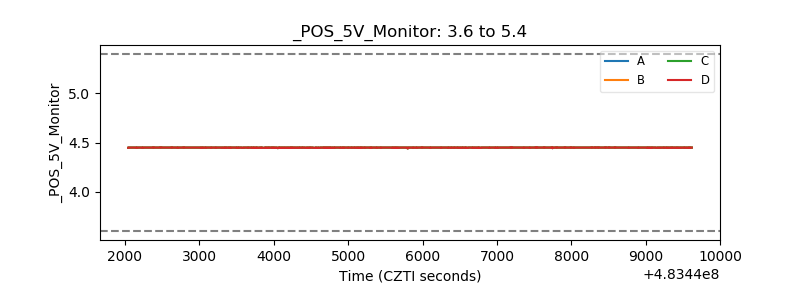 |
| _ROLL_ROT | 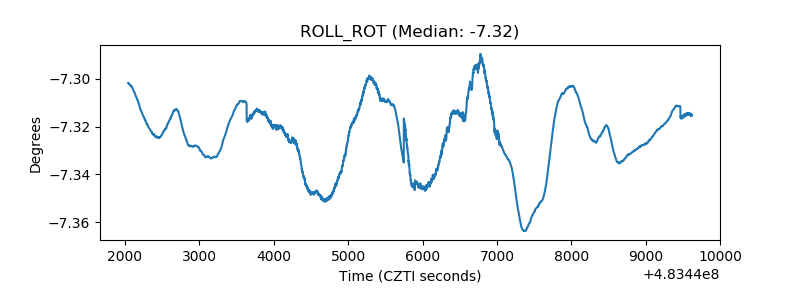 |
| _Roll_DEC | 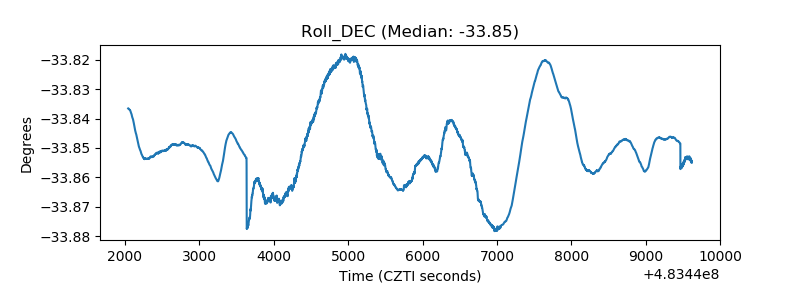 |
| _Roll_RA | 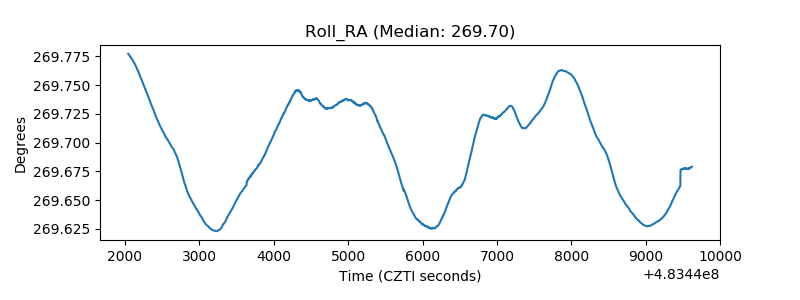 |
| Veto Counter | 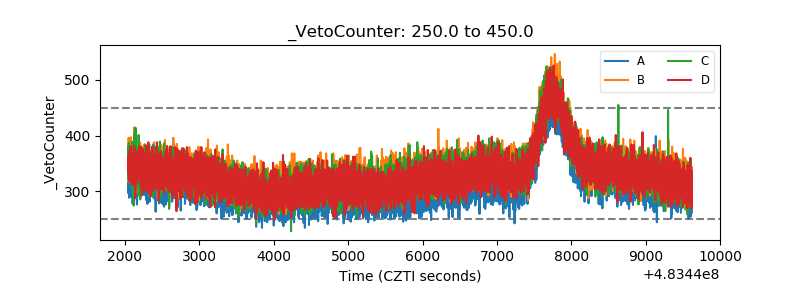 |