| Param | Original file | Final file |
|---|---|---|
| Filename | modeM0/AS1A13_090T01_9000006464_51820cztM0_level2.fits | modeM0/AS1A13_090T01_9000006464_51820cztM0_level2_quad_clean.evt |
| Size (bytes) | 822,623,040 | 106,997,760 |
| Size | 784.5 MB | 102.0 MB |
| Events in quadrant A | 7,112,351 | 665,962 |
| Events in quadrant B | 7,609,863 | 729,530 |
| Events in quadrant C | 6,575,572 | 706,136 |
| Events in quadrant D | 8,537,029 | 583,318 |
| Mode SS | |||
|---|---|---|---|
| Quadrant | BADHDUFLAG | Total packets | Discarded packets |
| A | 0 | 160 | 0 |
| B | 0 | 160 | 0 |
| C | 0 | 160 | 0 |
| D | 0 | 160 | 0 |
| Mode M0 | |||
|---|---|---|---|
| Quadrant | BADHDUFLAG | Total packets | Discarded packets |
| A | 0 | 26469 | 0 |
| B | 0 | 28073 | 0 |
| C | 0 | 25131 | 0 |
| D | 0 | 30879 | 3 |
| Quadrant | Total seconds | Saturated seconds | Saturation percentage |
|---|---|---|---|
| A | 7975 | 911 | 11.423197% |
| B | 7976 | 1016 | 12.738215% |
| C | 7976 | 273 | 3.422768% |
| D | 7975 | 1279 | 16.037618% |
Noise dominated data is calculated using 1-second bins in cleaned event files. If a bin has >2000 counts, and if more than 50% of those come from <1% of pixels, then it is considered to be noise-dominated and hence unusable.
| Quadrant | # 1 sec bins | Bins with >0 counts | Bins with >2000 counts | High rate bins dominated by noise | Noise dominated (total time) | Noise dominated (detector-on time) | Marked lightcurve |
|---|---|---|---|---|---|---|---|
| A | 7975 | 7975 | 766 | 766 | 9.61% | 9.61% | 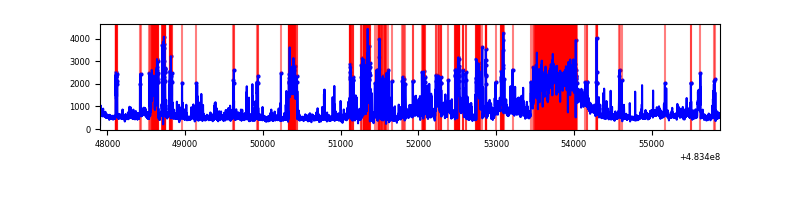 |
| B | 7976 | 7976 | 641 | 641 | 8.04% | 8.04% | 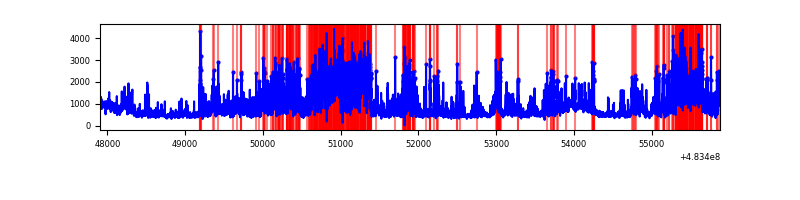 |
| C | 7976 | 7976 | 189 | 189 | 2.37% | 2.37% | 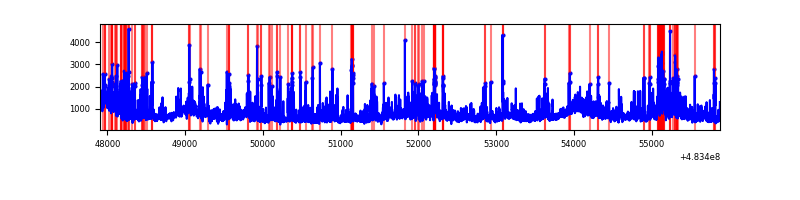 |
| D | 7975 | 7975 | 1016 | 1016 | 12.74% | 12.74% | 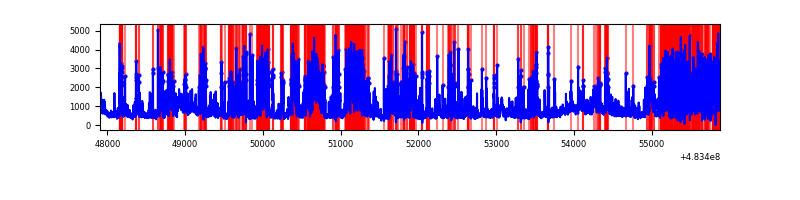 |
Top three noisy pixels from each quadrant. If the there are fewer than three noisy pixels in the level2.evt file, extra rows are filled as -1
| Pixel properties | Quadrant properties | ||||||
|---|---|---|---|---|---|---|---|
| Quadrant | DetID | PixID | Counts | Sigma | Mean | Median | Sigma |
| A | 15 | 174 | 1937789 | 9514.03 | 828 | 807 | 203.6 |
| A | 12 | 3 | 528629 | 2592.55 | 828 | 807 | 203.6 |
| A | 3 | 14 | 384277 | 1883.52 | 828 | 807 | 203.6 |
| B | 10 | 128 | 2164887 | 12065.5 | 829 | 798 | 179.4 |
| B | 1 | 223 | 822712 | 4582.44 | 829 | 798 | 179.4 |
| B | 5 | 32 | 394767 | 2196.51 | 829 | 798 | 179.4 |
| C | 15 | 192 | 784324 | 3404.34 | 841 | 834 | 230.1 |
| C | 10 | 252 | 650311 | 2822.04 | 841 | 834 | 230.1 |
| C | 9 | 38 | 436359 | 1892.4 | 841 | 834 | 230.1 |
| D | 11 | 129 | 2926030 | 13509.51 | 785 | 761 | 216.5 |
| D | 3 | 12 | 816576 | 3767.61 | 785 | 761 | 216.5 |
| D | 12 | 6 | 620812 | 2863.53 | 785 | 761 | 216.5 |
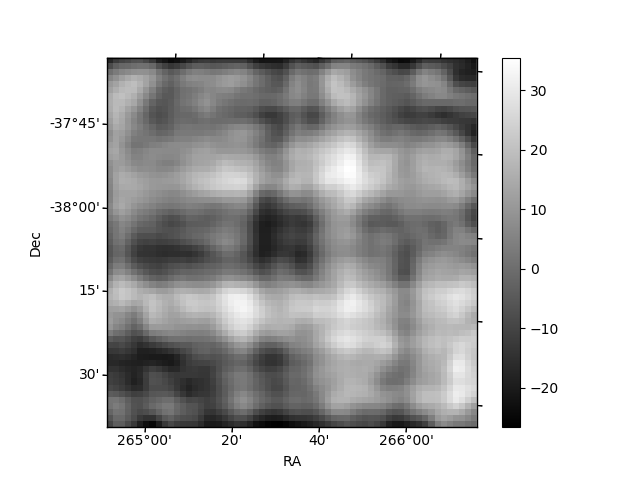
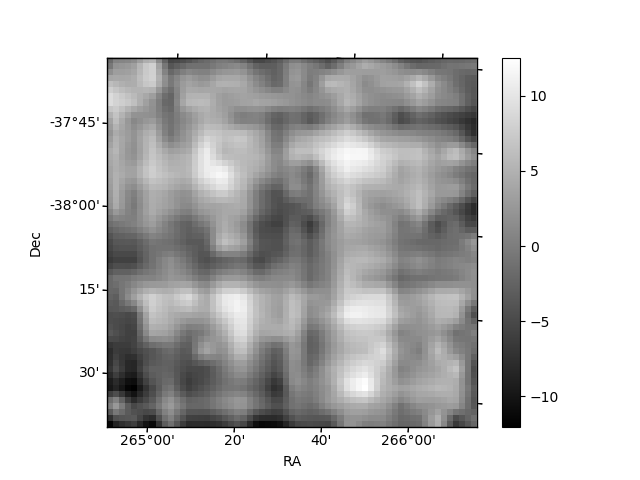
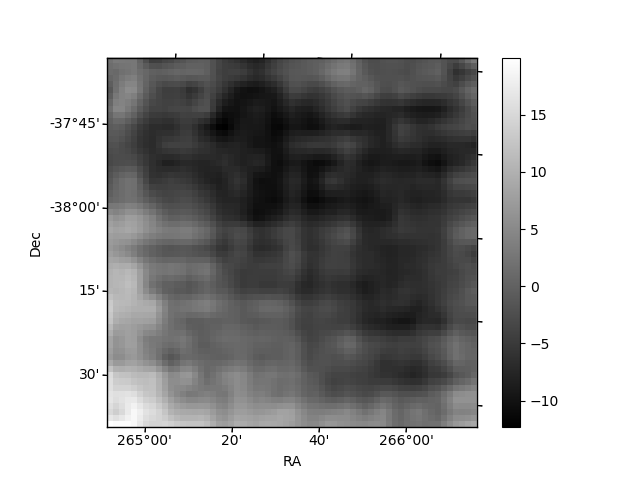
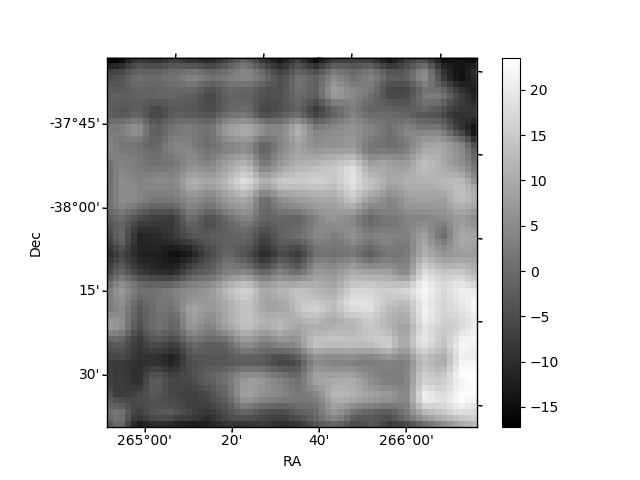
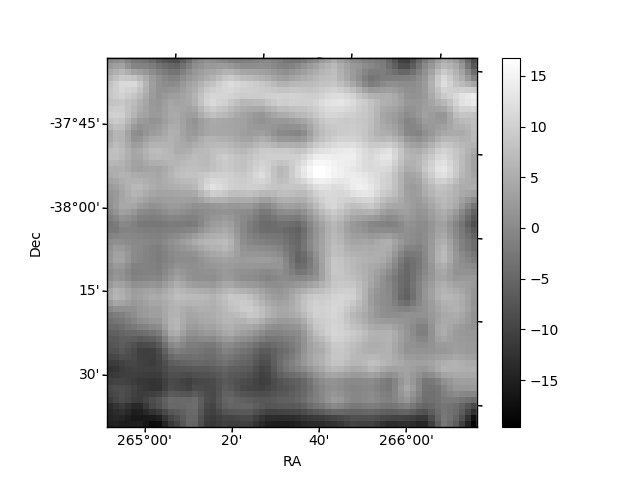
Histogram calculated using DETX and DETY for each event in the final _common_clean file
| Quadrant A | 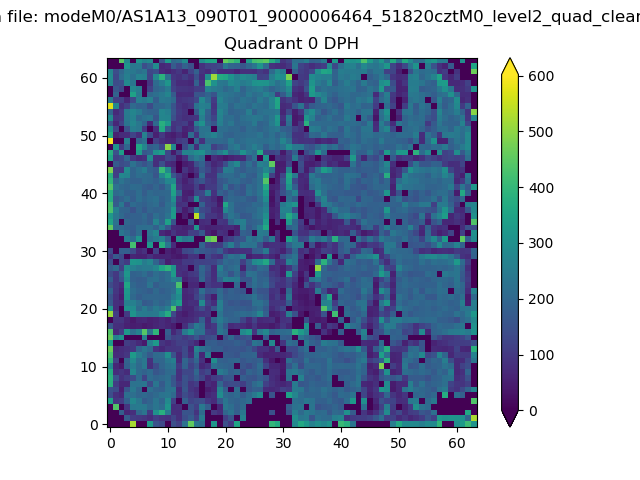 |
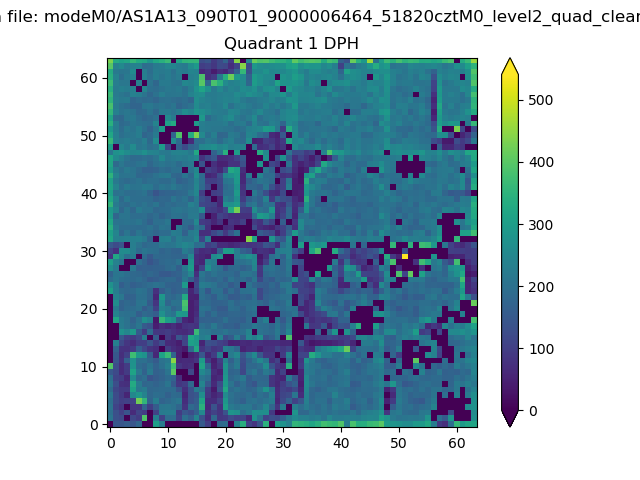 |
Quadrant B |
|---|---|---|---|
| Quadrant D |  |
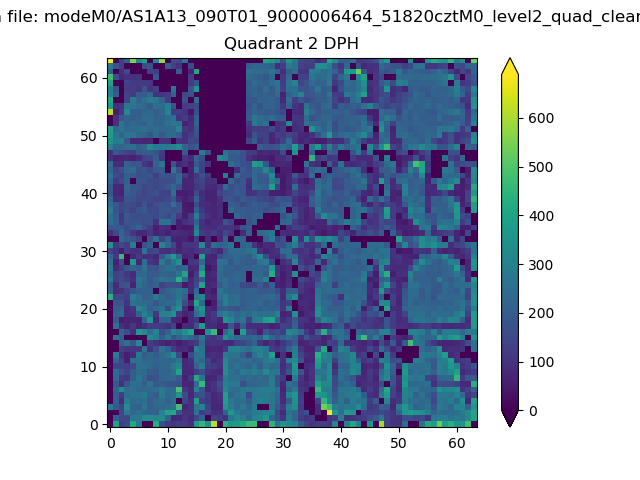 |
Quadrant C |
| Plot type | Count rate plots | Images |
|---|---|---|
| Comparison with Poisson distribution Blue bars denote a histogram of data divided into 1 sec bins. Red curve is a Poisson curve with rate = median count rate of data. |
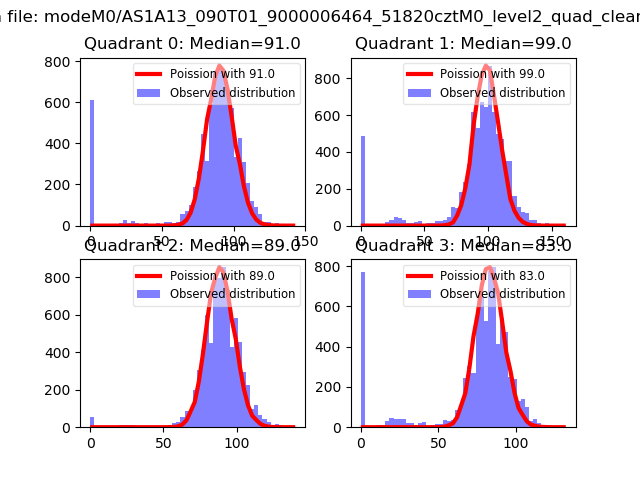 |
 |
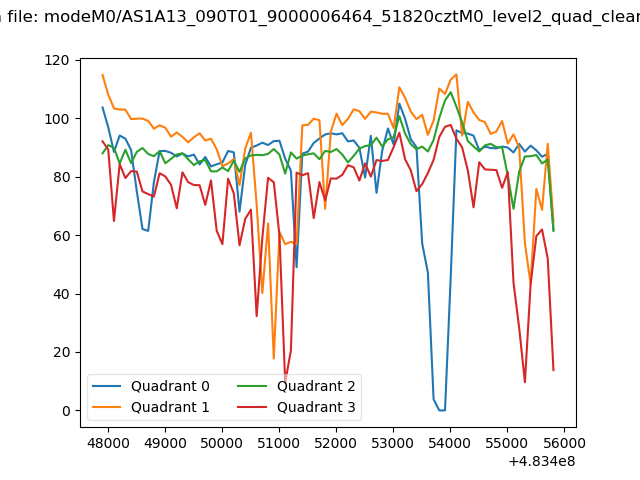
| Quadrant-wise count rates Data is divided into 100 sec bins |
 |
|
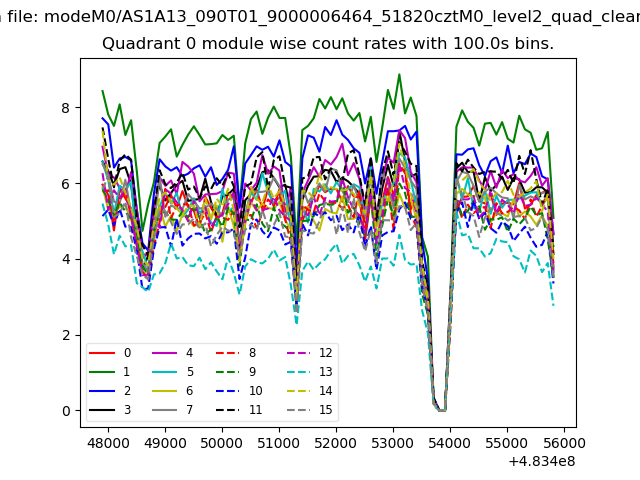
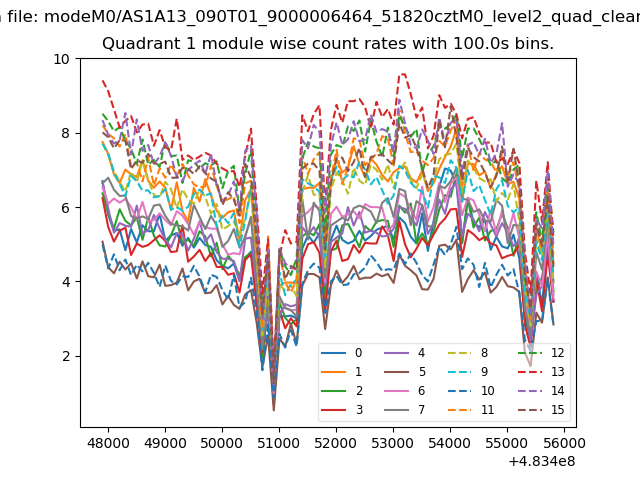
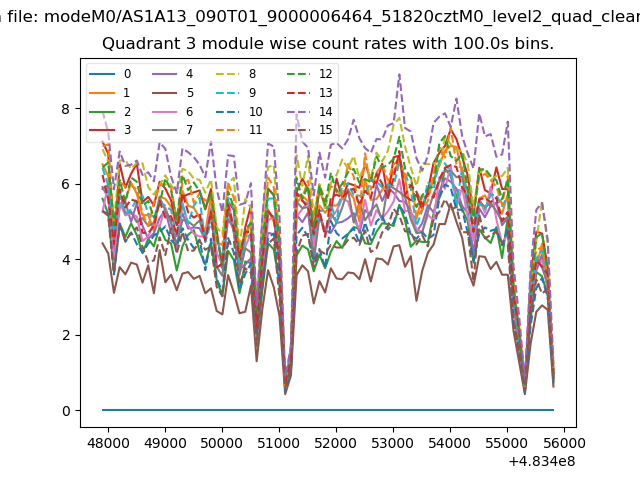
| Module-wise count rates for Quadrant A Data is divided into 100 sec bins |
 |
 |
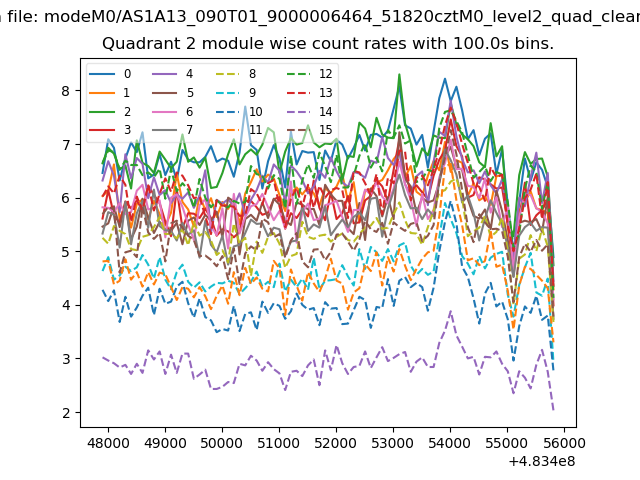
| Module-wise count rates for Quadrant B Data is divided into 100 sec bins |
 |
 |
| Module-wise count rates for Quadrant C Data is divided into 100 sec bins |
 |
 |
| Module-wise count rates for Quadrant D Data is divided into 100 sec bins |
 |
 |
| Parameter | Plot |
|---|---|
| CZT HV Monitor | 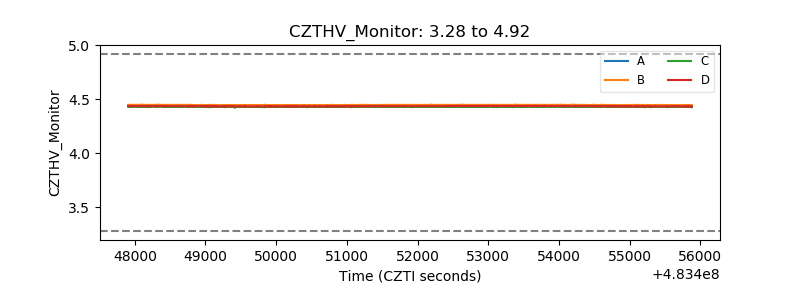 |
| D_VDD | 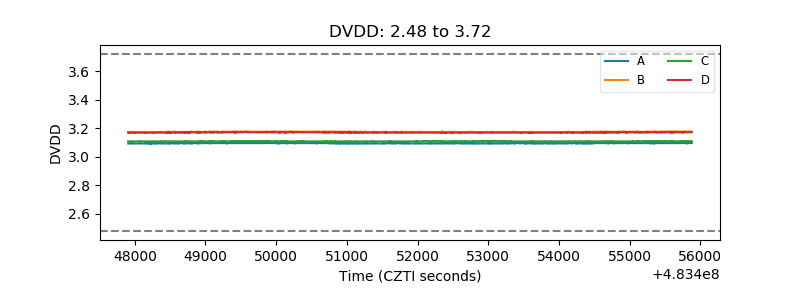 |
| Temperature 1 | 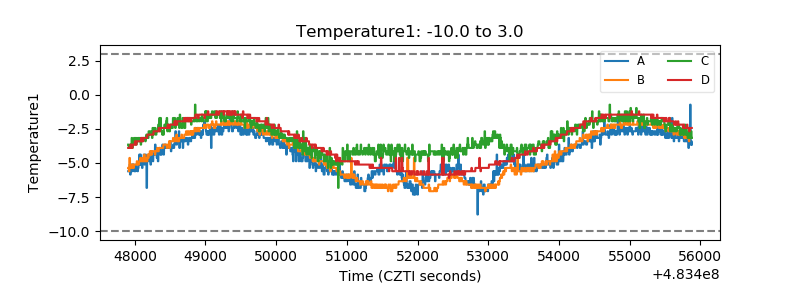 |
| Veto HV Monitor | 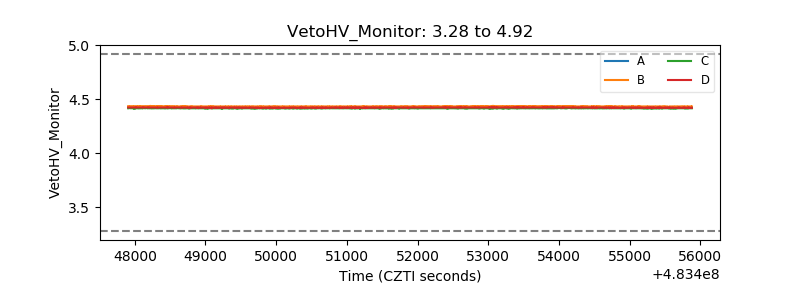 |
| Veto LLD | 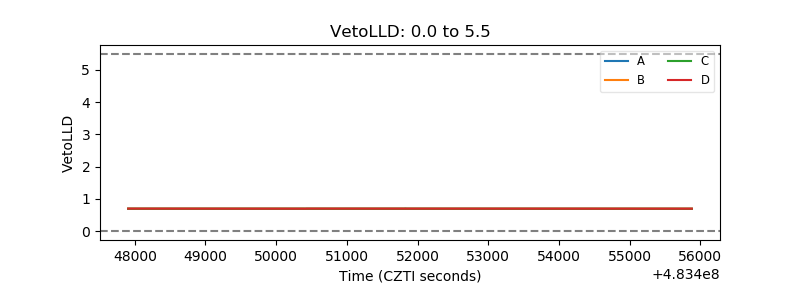 |
| Alpha Counter | 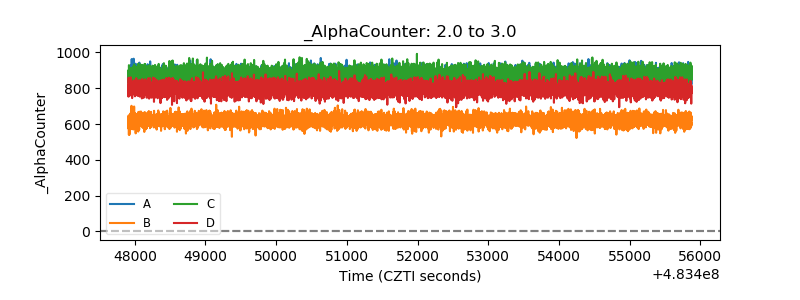 |
| _CPM_Rate | 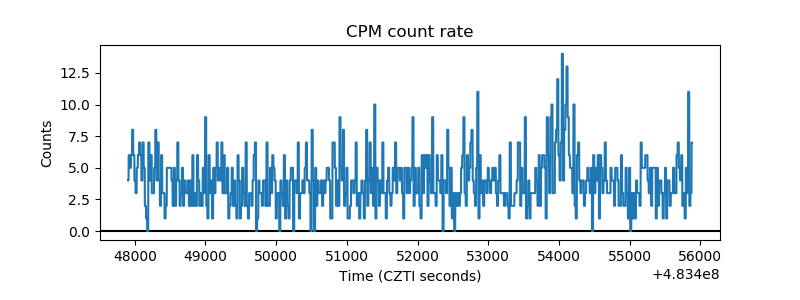 |
| CZT Counter | 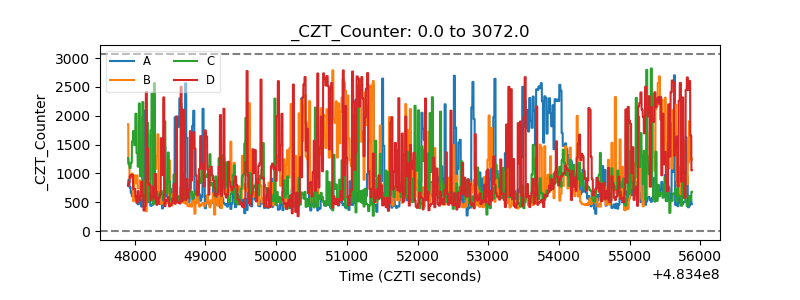 |
| +2.5 Volts monitor | 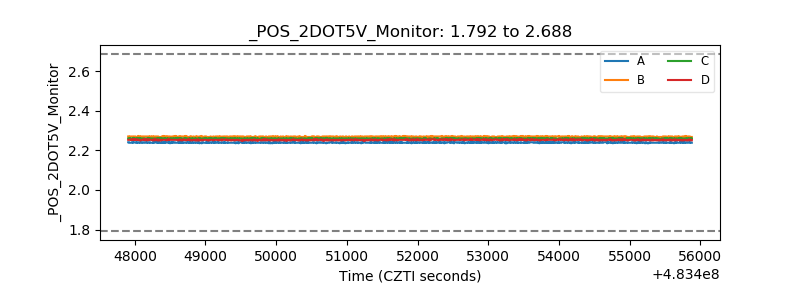 |
| +5 Volts monitor | 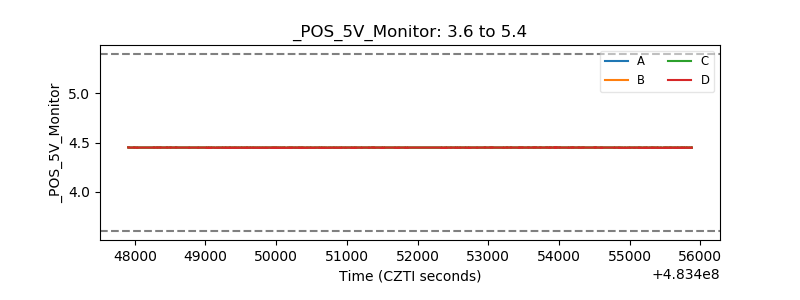 |
| _ROLL_ROT | 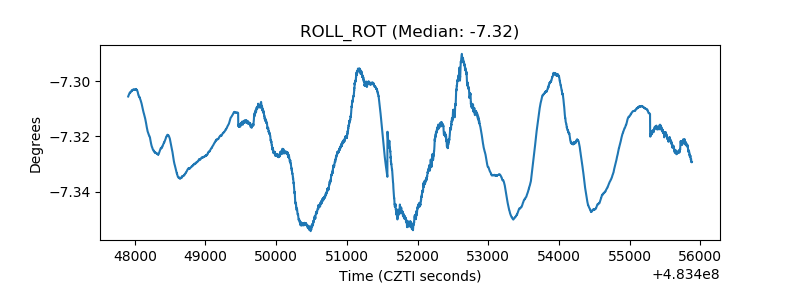 |
| _Roll_DEC | 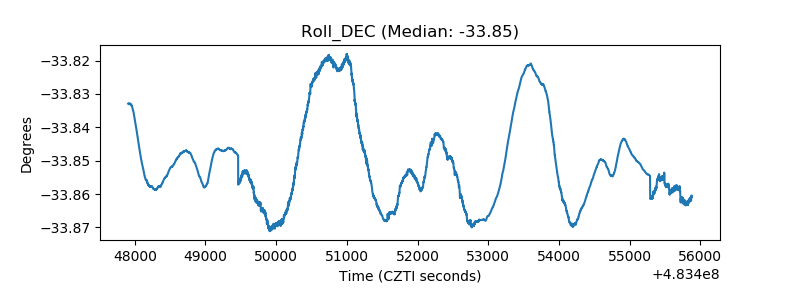 |
| _Roll_RA | 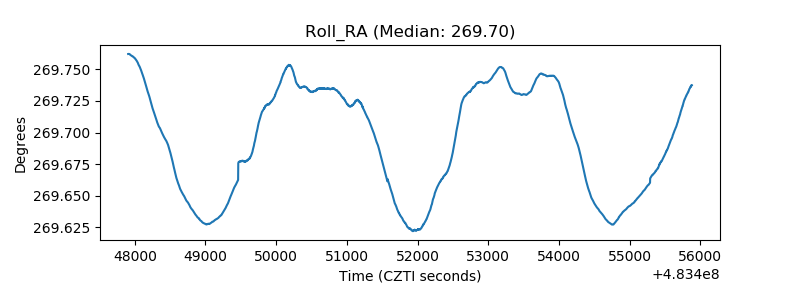 |
| Veto Counter | 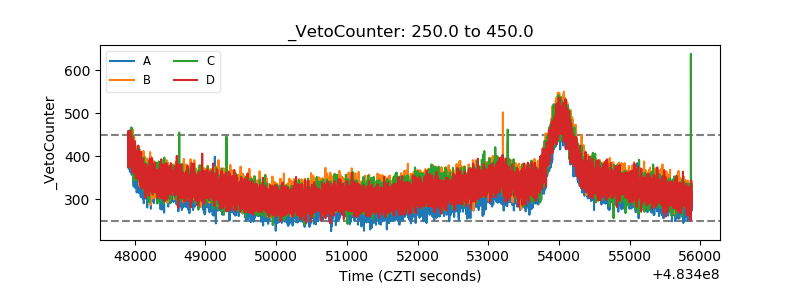 |