| Param | Original file | Final file |
|---|---|---|
| Filename | modeM0/AS1A13_090T01_9000006464_51824cztM0_level2.fits | modeM0/AS1A13_090T01_9000006464_51824cztM0_level2_quad_clean.evt |
| Size (bytes) | 810,552,960 | 90,849,600 |
| Size | 773.0 MB | 86.6 MB |
| Events in quadrant A | 4,398,285 | 663,411 |
| Events in quadrant B | 7,134,340 | 637,078 |
| Events in quadrant C | 4,648,233 | 632,177 |
| Events in quadrant D | 13,265,460 | 315,702 |
| Mode M9 | |||
|---|---|---|---|
| Quadrant | BADHDUFLAG | Total packets | Discarded packets |
| A | 0 | 14 | 0 |
| B | 0 | 14 | 0 |
| C | 0 | 14 | 0 |
| D | 0 | 14 | 0 |
| Mode SS | |||
|---|---|---|---|
| Quadrant | BADHDUFLAG | Total packets | Discarded packets |
| A | 0 | 150 | 0 |
| B | 0 | 150 | 0 |
| C | 0 | 150 | 0 |
| D | 0 | 150 | 0 |
| Mode M0 | |||
|---|---|---|---|
| Quadrant | BADHDUFLAG | Total packets | Discarded packets |
| A | 0 | 18176 | 2 |
| B | 0 | 26214 | 2 |
| C | 0 | 19041 | 2 |
| D | 0 | 44340 | 2 |
| Quadrant | Total seconds | Saturated seconds | Saturation percentage |
|---|---|---|---|
| A | 7203 | 121 | 1.679856% |
| B | 7203 | 1173 | 16.284881% |
| C | 7203 | 307 | 4.262113% |
| D | 7203 | 3816 | 52.977926% |
Noise dominated data is calculated using 1-second bins in cleaned event files. If a bin has >2000 counts, and if more than 50% of those come from <1% of pixels, then it is considered to be noise-dominated and hence unusable.
| Quadrant | # 1 sec bins | Bins with >0 counts | Bins with >2000 counts | High rate bins dominated by noise | Noise dominated (total time) | Noise dominated (detector-on time) | Marked lightcurve |
|---|---|---|---|---|---|---|---|
| A | 8643 | 7205 | 42 | 42 | 0.49% | 0.58% | 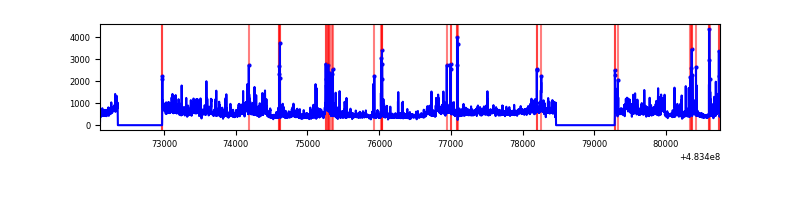 |
| B | 8643 | 7205 | 600 | 600 | 6.94% | 8.33% | 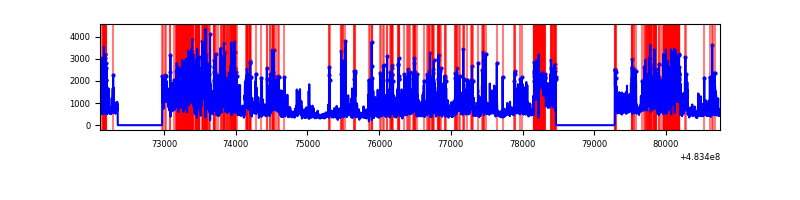 |
| C | 8643 | 7205 | 216 | 216 | 2.50% | 3.00% | 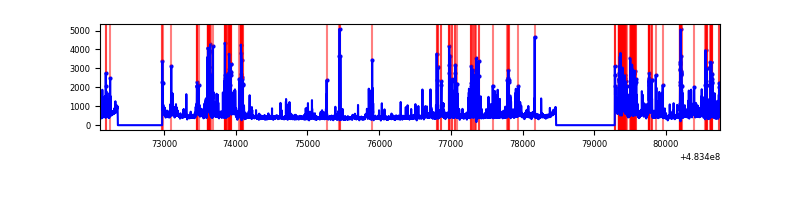 |
| D | 8643 | 7205 | 3103 | 3103 | 35.90% | 43.07% | 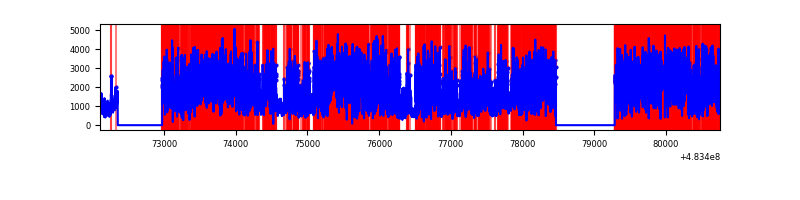 |
Top three noisy pixels from each quadrant. If the there are fewer than three noisy pixels in the level2.evt file, extra rows are filled as -1
| Pixel properties | Quadrant properties | ||||||
|---|---|---|---|---|---|---|---|
| Quadrant | DetID | PixID | Counts | Sigma | Mean | Median | Sigma |
| A | 12 | 3 | 240373 | 1251.58 | 779 | 760 | 191.4 |
| A | 3 | 14 | 196813 | 1024.05 | 779 | 760 | 191.4 |
| A | 5 | 240 | 165340 | 859.65 | 779 | 760 | 191.4 |
| B | 10 | 128 | 1392693 | 8801.75 | 731 | 704 | 158.1 |
| B | 1 | 223 | 958203 | 6054.4 | 731 | 704 | 158.1 |
| B | 5 | 185 | 378245 | 2387.25 | 731 | 704 | 158.1 |
| C | 15 | 218 | 709982 | 3433.92 | 751 | 745 | 206.5 |
| C | 14 | 245 | 320059 | 1546.03 | 751 | 745 | 206.5 |
| C | 0 | 192 | 191924 | 925.63 | 751 | 745 | 206.5 |
| D | 11 | 129 | 9306274 | 60843.59 | 549 | 530 | 152.9 |
| D | 3 | 12 | 658633 | 4302.86 | 549 | 530 | 152.9 |
| D | 0 | 18 | 403384 | 2633.97 | 549 | 530 | 152.9 |
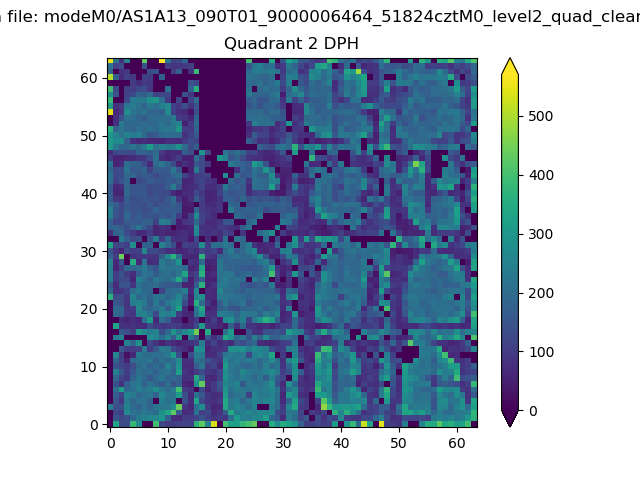
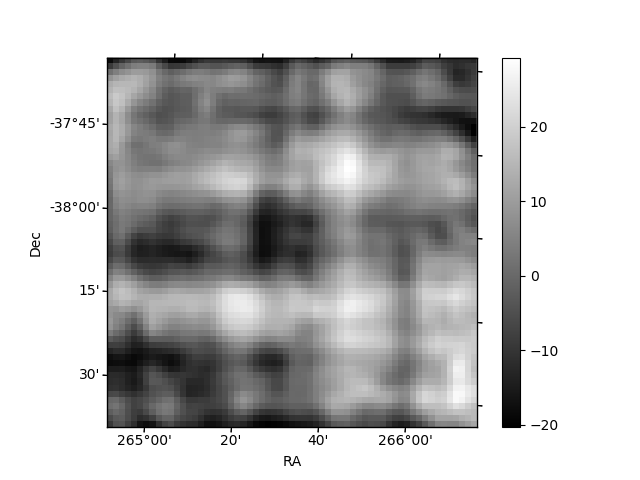
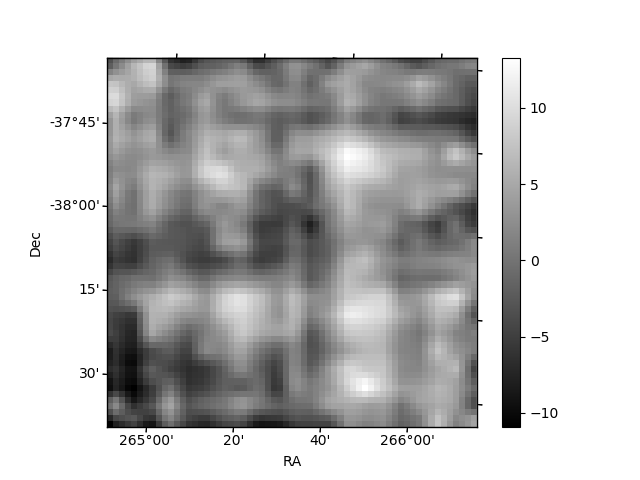
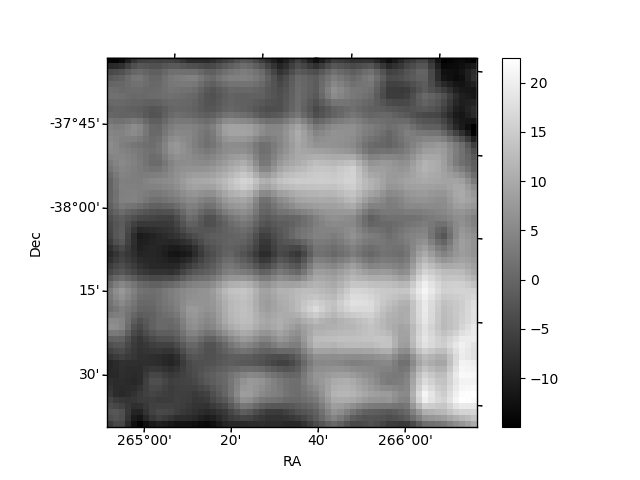
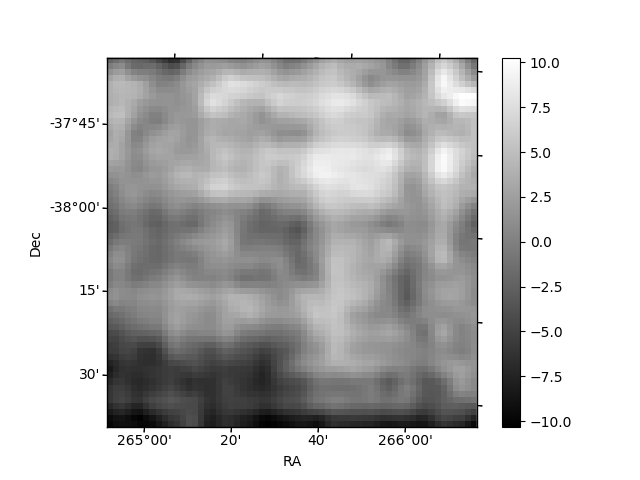
Histogram calculated using DETX and DETY for each event in the final _common_clean file
| Quadrant A | 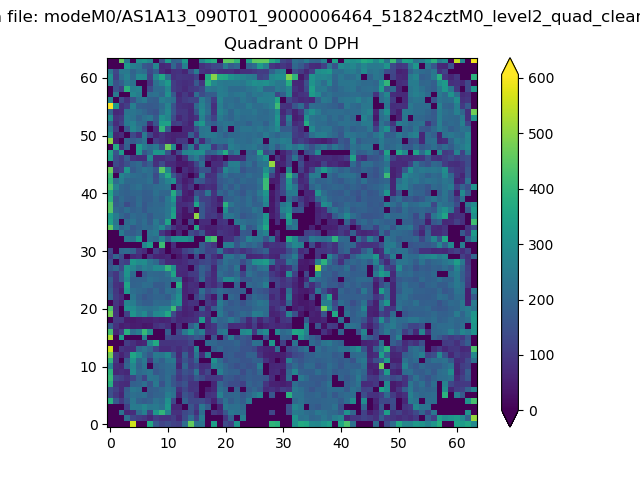 |
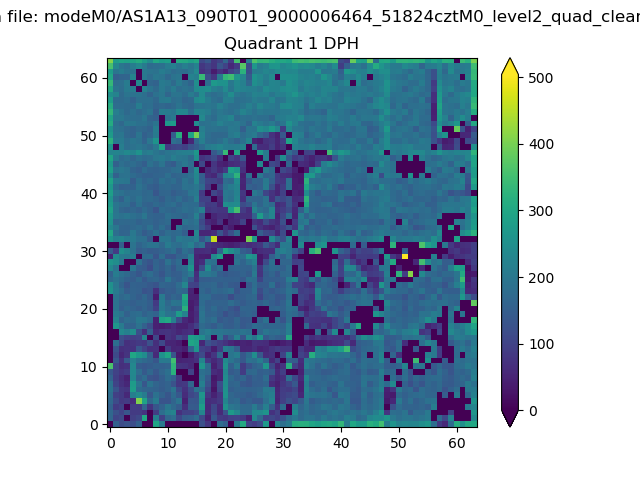 |
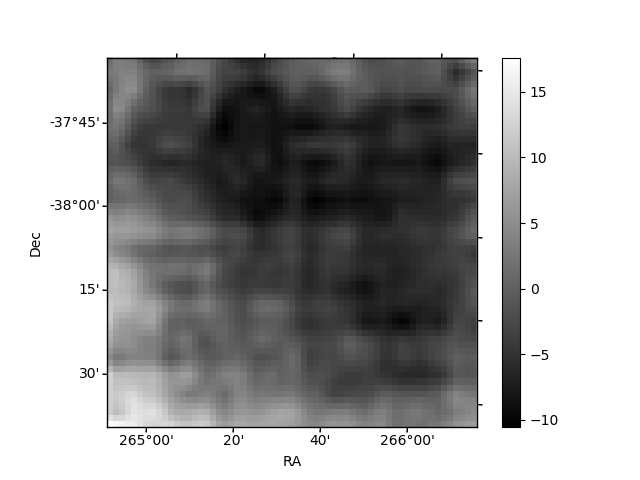
Quadrant B |
|---|---|---|---|
| Quadrant D | 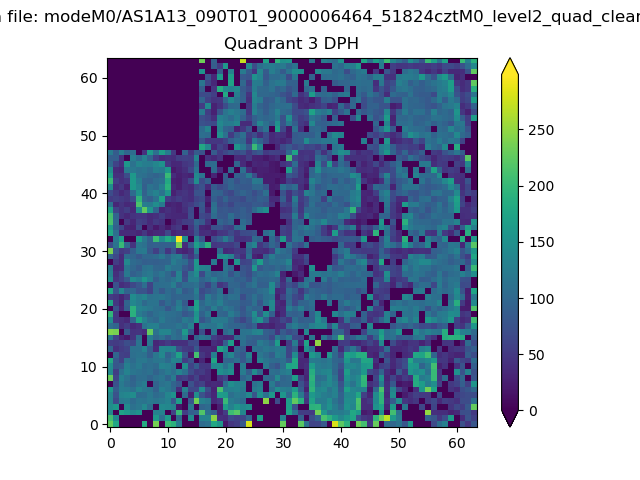 |
 |
Quadrant C |
| Plot type | Count rate plots | Images |
|---|---|---|
| Comparison with Poisson distribution Blue bars denote a histogram of data divided into 1 sec bins. Red curve is a Poisson curve with rate = median count rate of data. |
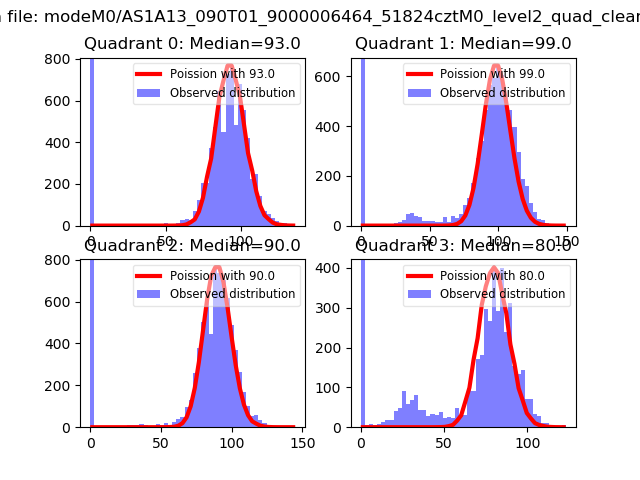 |
 |
| Quadrant-wise count rates Data is divided into 100 sec bins |
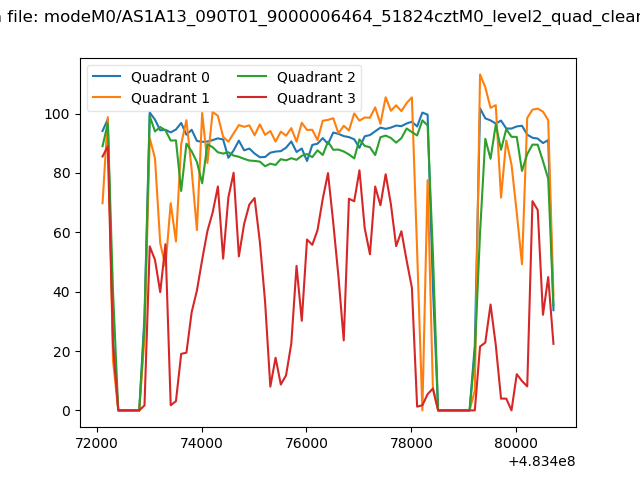 |
|
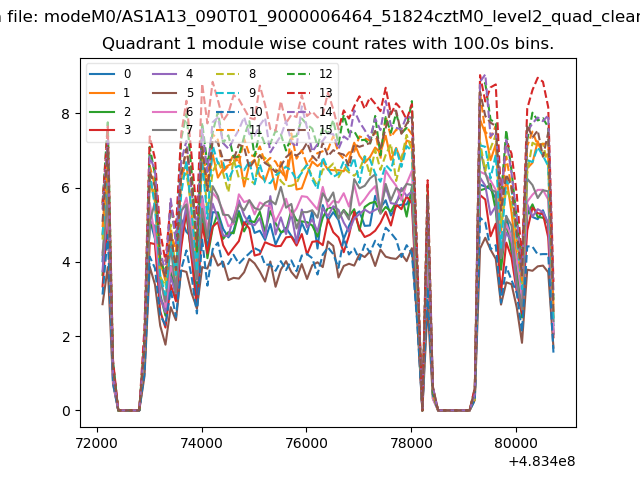
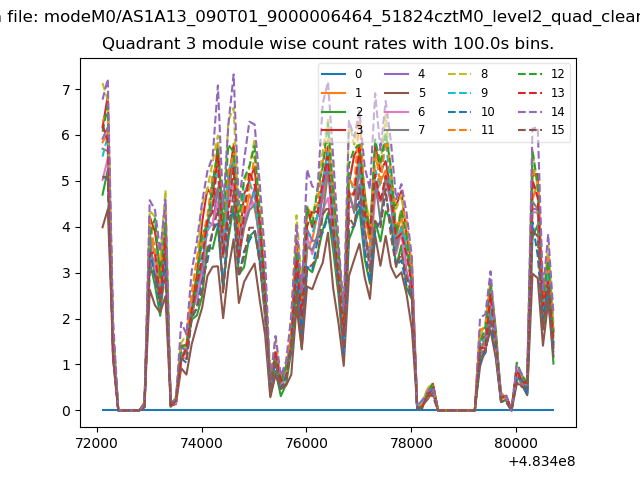
| Module-wise count rates for Quadrant A Data is divided into 100 sec bins |
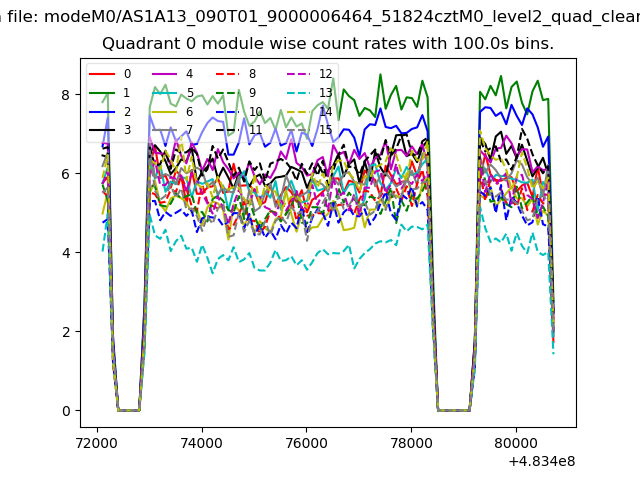 |
 |
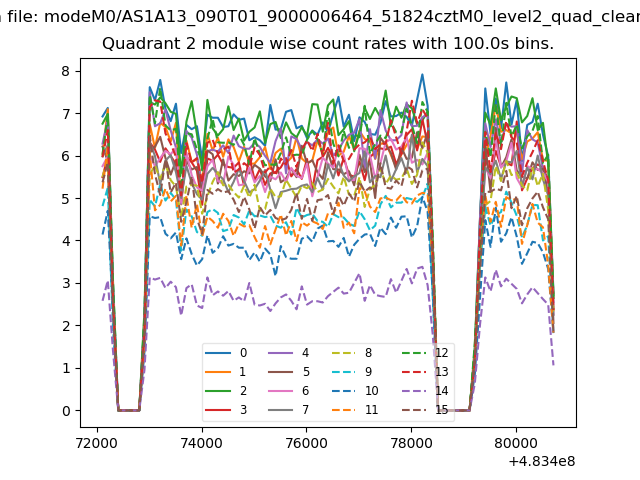
| Module-wise count rates for Quadrant B Data is divided into 100 sec bins |
 |
 |
| Module-wise count rates for Quadrant C Data is divided into 100 sec bins |
 |
 |
| Module-wise count rates for Quadrant D Data is divided into 100 sec bins |
 |
 |
| Parameter | Plot |
|---|---|
| CZT HV Monitor |  |
| D_VDD |  |
| Temperature 1 | 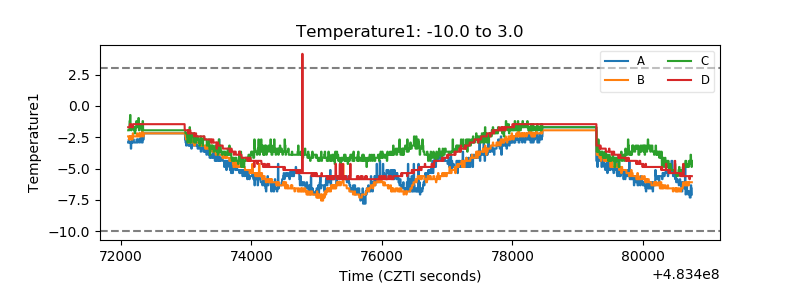 |
| Veto HV Monitor | 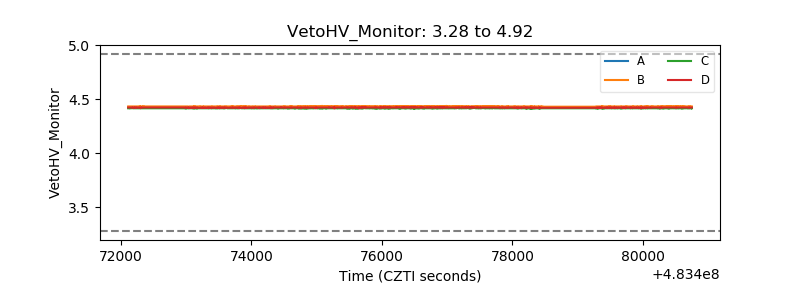 |
| Veto LLD | 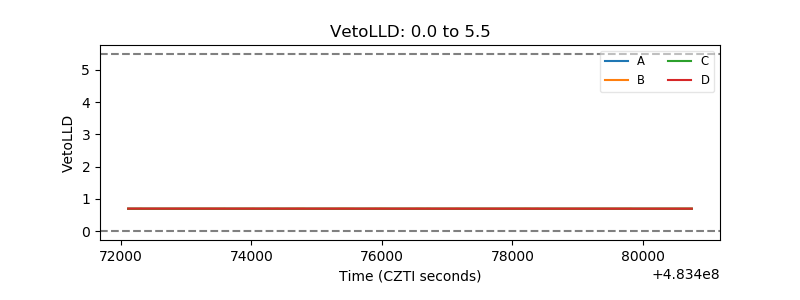 |
| Alpha Counter | 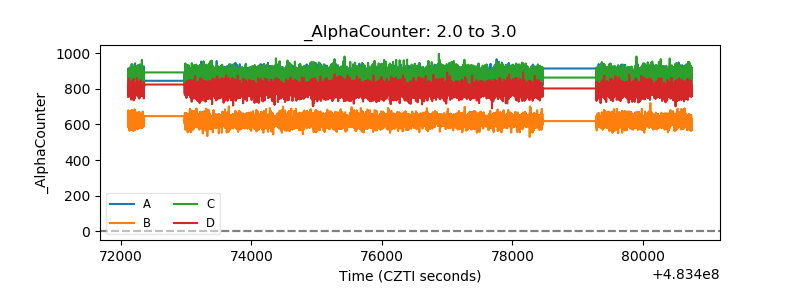 |
| _CPM_Rate | 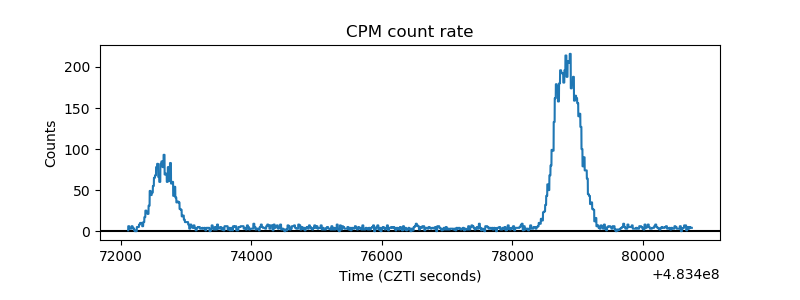 |
| CZT Counter | 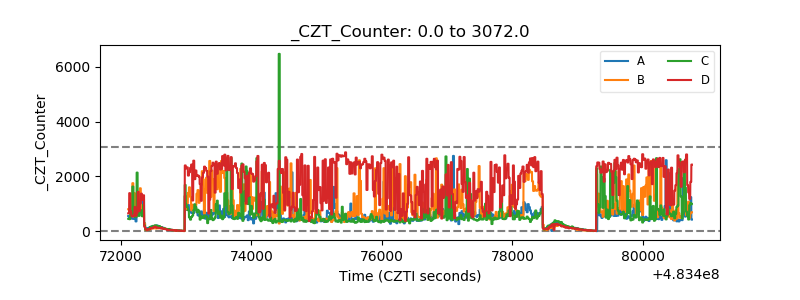 |
| +2.5 Volts monitor | 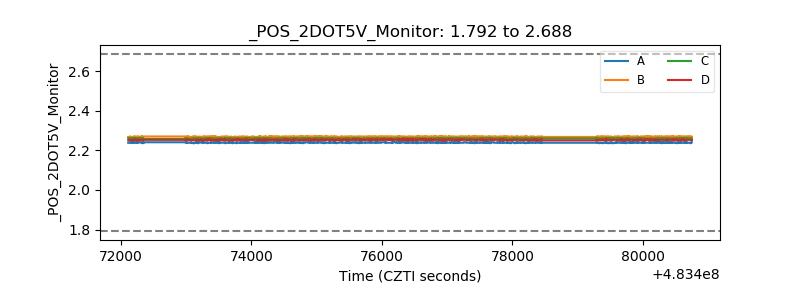 |
| +5 Volts monitor | 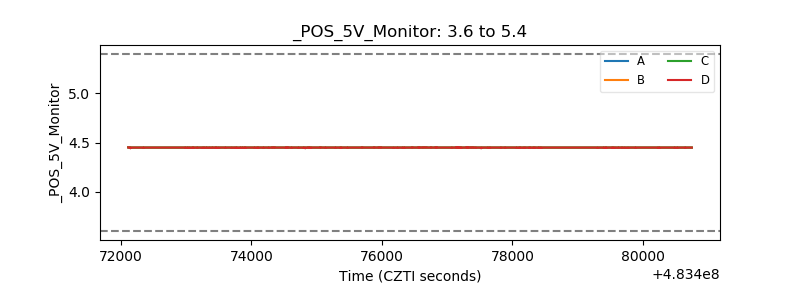 |
| _ROLL_ROT | 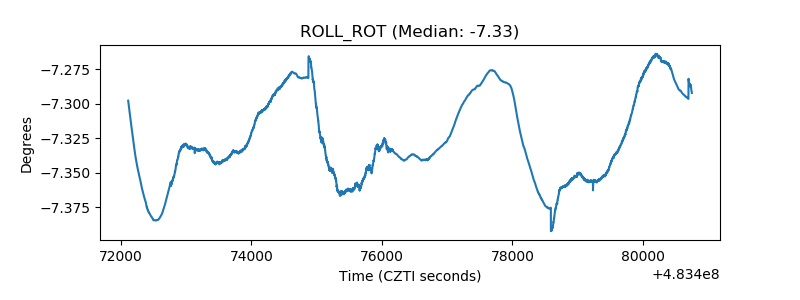 |
| _Roll_DEC | 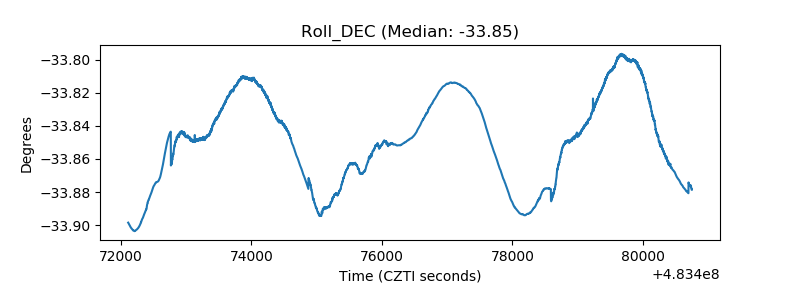 |
| _Roll_RA | 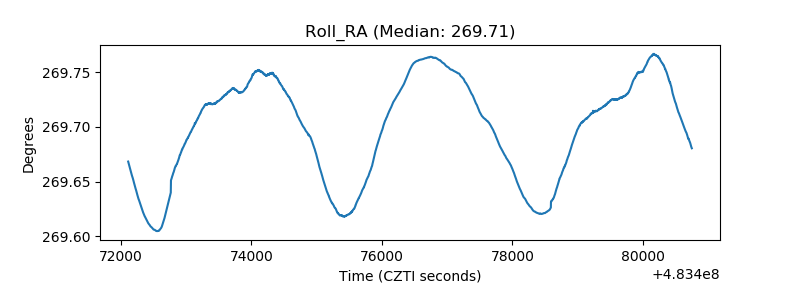 |
| Veto Counter | 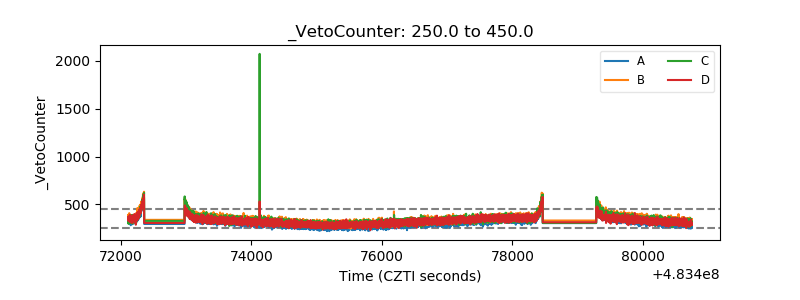 |