| Param | Original file | Final file |
|---|---|---|
| Filename | modeM0/AS1A13_090T01_9000006464_51826cztM0_level2.fits | modeM0/AS1A13_090T01_9000006464_51826cztM0_level2_quad_clean.evt |
| Size (bytes) | 860,650,560 | 87,632,640 |
| Size | 820.8 MB | 83.6 MB |
| Events in quadrant A | 4,828,529 | 660,602 |
| Events in quadrant B | 9,364,908 | 507,971 |
| Events in quadrant C | 4,586,107 | 631,325 |
| Events in quadrant D | 12,532,167 | 360,628 |
| Mode M9 | |||
|---|---|---|---|
| Quadrant | BADHDUFLAG | Total packets | Discarded packets |
| A | 0 | 18 | 0 |
| B | 0 | 18 | 0 |
| C | 0 | 18 | 0 |
| D | 0 | 18 | 0 |
| Mode SS | |||
|---|---|---|---|
| Quadrant | BADHDUFLAG | Total packets | Discarded packets |
| A | 0 | 146 | 0 |
| B | 0 | 146 | 0 |
| C | 0 | 146 | 0 |
| D | 0 | 146 | 0 |
| Mode M0 | |||
|---|---|---|---|
| Quadrant | BADHDUFLAG | Total packets | Discarded packets |
| A | 0 | 19278 | 2 |
| B | 0 | 32757 | 2 |
| C | 0 | 18608 | 4 |
| D | 0 | 42100 | 2 |
| Quadrant | Total seconds | Saturated seconds | Saturation percentage |
|---|---|---|---|
| A | 7068 | 183 | 2.589134% |
| B | 7068 | 2357 | 33.347482% |
| C | 7068 | 280 | 3.961517% |
| D | 7068 | 3214 | 45.472552% |
Noise dominated data is calculated using 1-second bins in cleaned event files. If a bin has >2000 counts, and if more than 50% of those come from <1% of pixels, then it is considered to be noise-dominated and hence unusable.
| Quadrant | # 1 sec bins | Bins with >0 counts | Bins with >2000 counts | High rate bins dominated by noise | Noise dominated (total time) | Noise dominated (detector-on time) | Marked lightcurve |
|---|---|---|---|---|---|---|---|
| A | 8873 | 7070 | 127 | 127 | 1.43% | 1.80% | 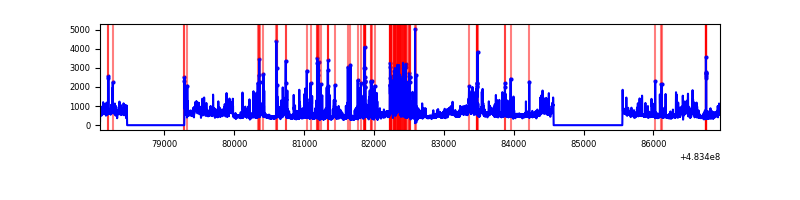 |
| B | 8873 | 7070 | 1563 | 1563 | 17.62% | 22.11% | 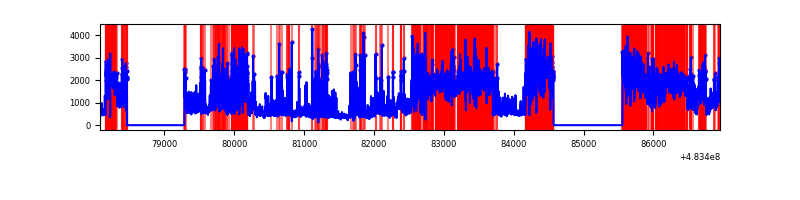 |
| C | 8873 | 7070 | 213 | 213 | 2.40% | 3.01% |  |
| D | 8873 | 7070 | 2847 | 2847 | 32.09% | 40.27% | 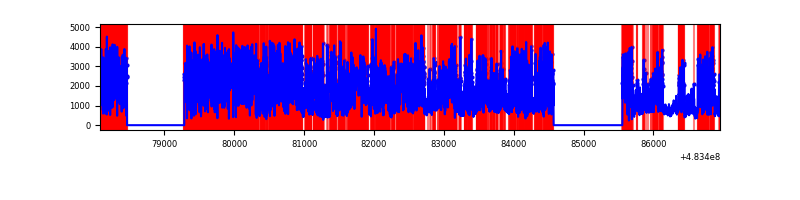 |
Top three noisy pixels from each quadrant. If the there are fewer than three noisy pixels in the level2.evt file, extra rows are filled as -1
| Pixel properties | Quadrant properties | ||||||
|---|---|---|---|---|---|---|---|
| Quadrant | DetID | PixID | Counts | Sigma | Mean | Median | Sigma |
| A | 11 | 3 | 776768 | 4164.92 | 759 | 741 | 186.3 |
| A | 12 | 3 | 364166 | 1950.5 | 759 | 741 | 186.3 |
| A | 5 | 240 | 225882 | 1208.33 | 759 | 741 | 186.3 |
| B | 15 | 54 | 3831085 | 26735.3 | 663 | 637 | 143.3 |
| B | 10 | 128 | 709009 | 4944.21 | 663 | 637 | 143.3 |
| B | 5 | 185 | 526104 | 3667.59 | 663 | 637 | 143.3 |
| C | 15 | 218 | 466955 | 2273.98 | 740 | 734 | 205.0 |
| C | 14 | 245 | 348215 | 1694.83 | 740 | 734 | 205.0 |
| C | 14 | 80 | 201717 | 980.29 | 740 | 734 | 205.0 |
| D | 11 | 129 | 9031927 | 56219.71 | 573 | 552 | 160.6 |
| D | 9 | 49 | 281272 | 1747.46 | 573 | 552 | 160.6 |
| D | 3 | 12 | 280791 | 1744.47 | 573 | 552 | 160.6 |
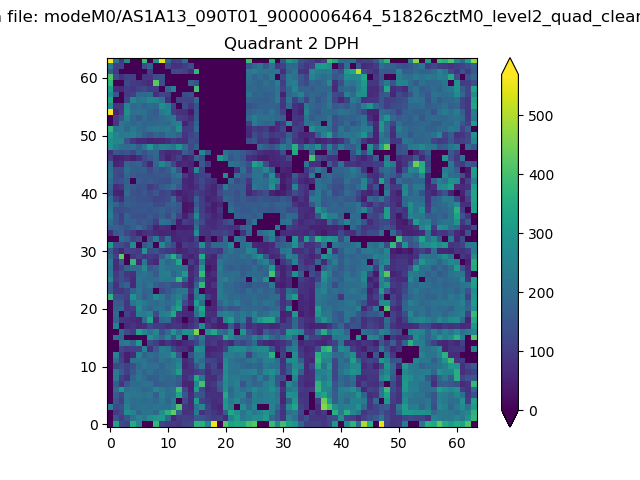
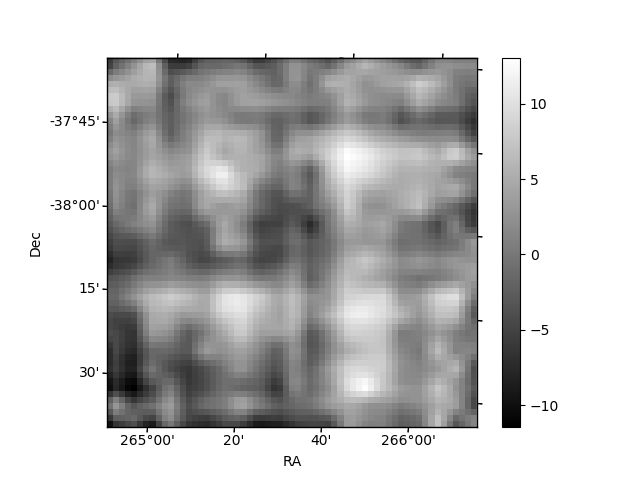
Histogram calculated using DETX and DETY for each event in the final _common_clean file
| Quadrant A | 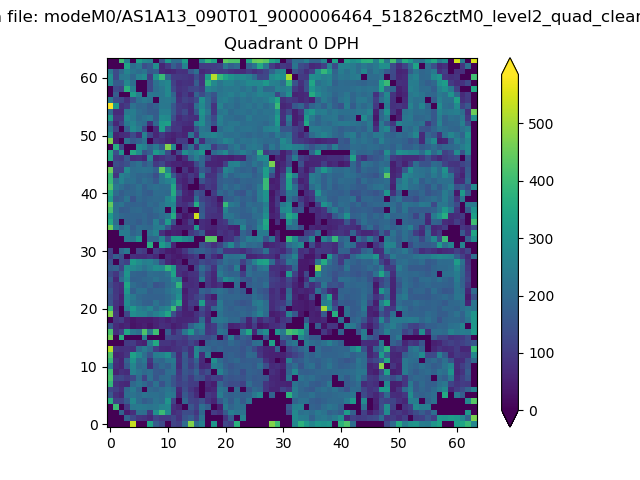 |
 |
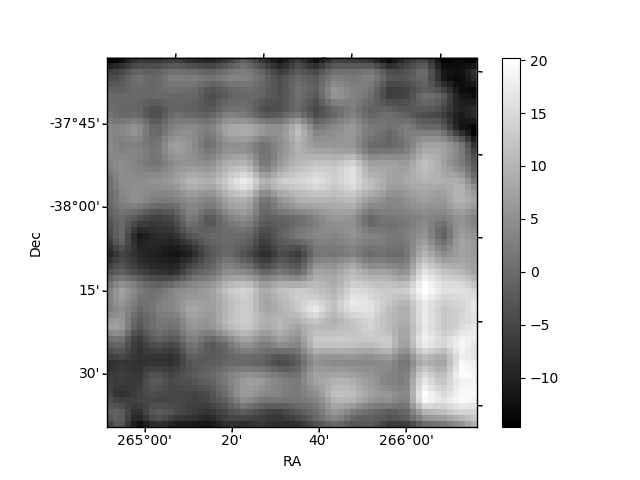
Quadrant B |
|---|---|---|---|
| Quadrant D | 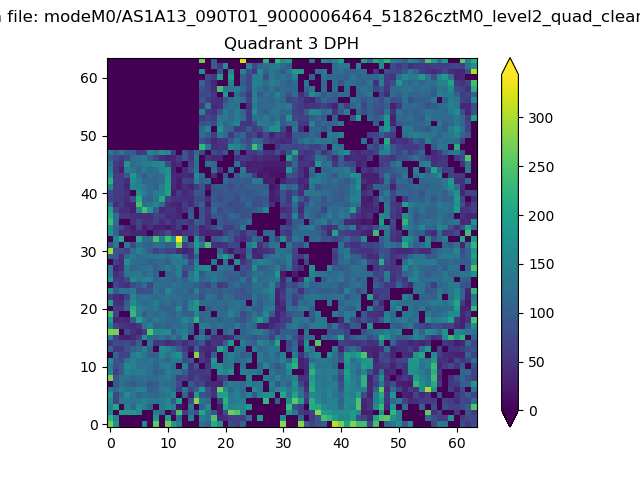 |
 |
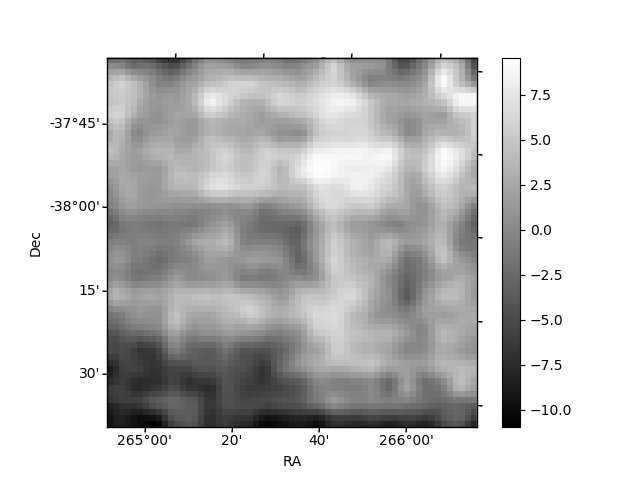
Quadrant C |
| Plot type | Count rate plots | Images |
|---|---|---|
| Comparison with Poisson distribution Blue bars denote a histogram of data divided into 1 sec bins. Red curve is a Poisson curve with rate = median count rate of data. |
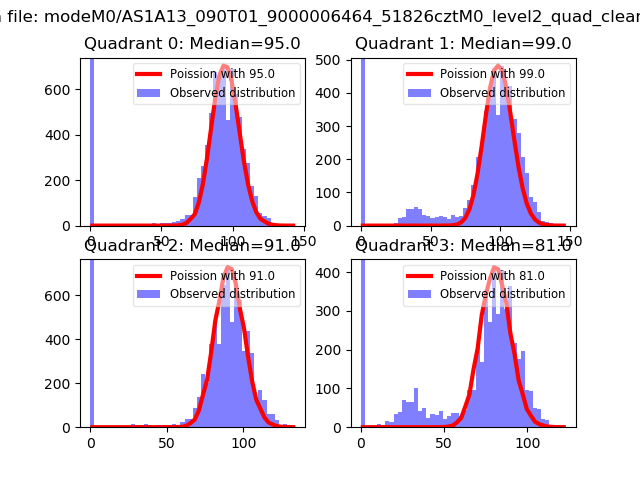 |
 |
| Quadrant-wise count rates Data is divided into 100 sec bins |
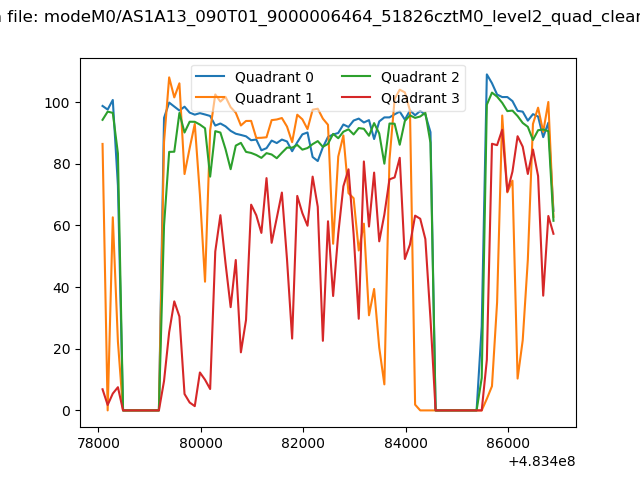 |
|
| Module-wise count rates for Quadrant A Data is divided into 100 sec bins |
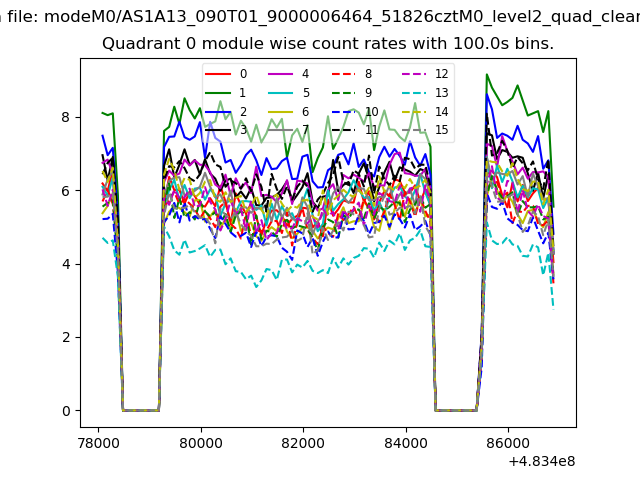 |
 |
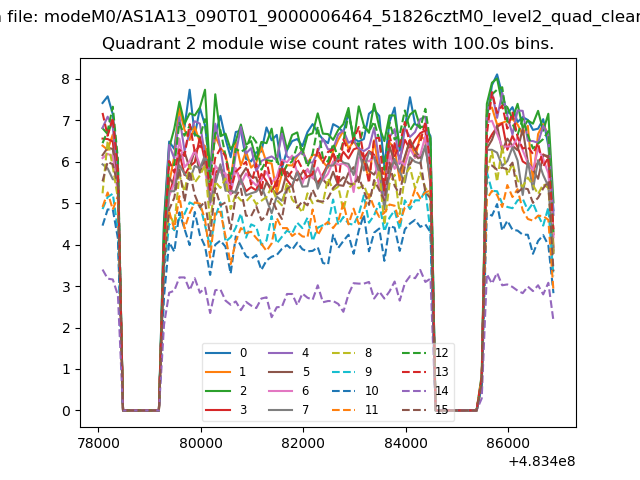
| Module-wise count rates for Quadrant B Data is divided into 100 sec bins |
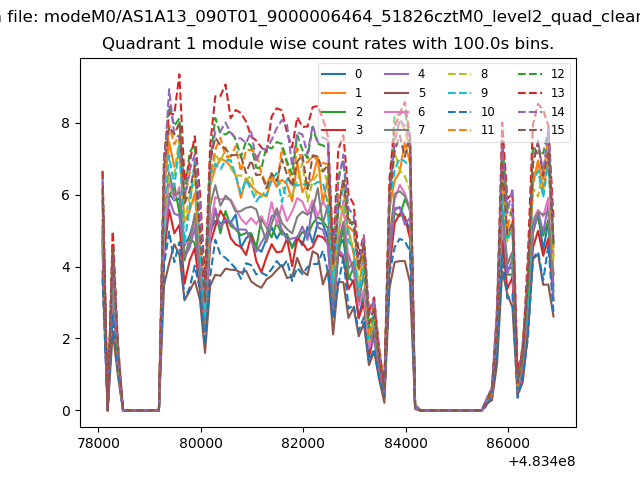 |
 |
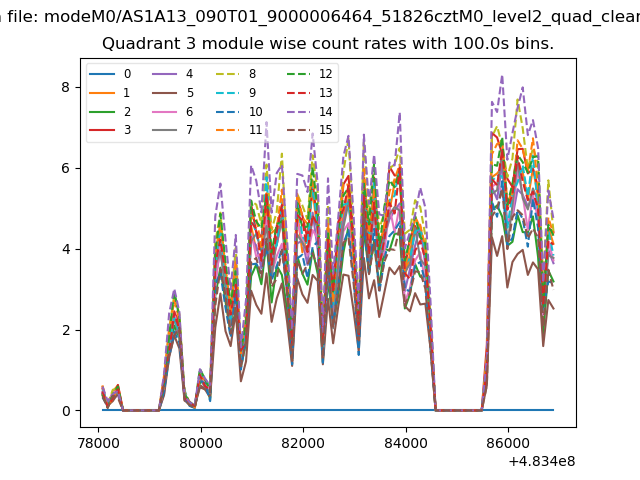
| Module-wise count rates for Quadrant C Data is divided into 100 sec bins |
 |
 |
| Module-wise count rates for Quadrant D Data is divided into 100 sec bins |
 |
 |
| Parameter | Plot |
|---|---|
| CZT HV Monitor | 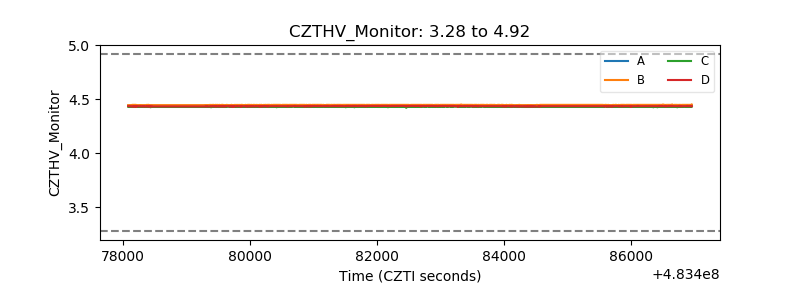 |
| D_VDD | 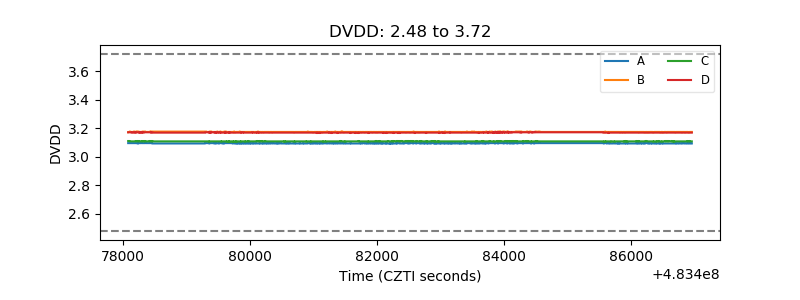 |
| Temperature 1 | 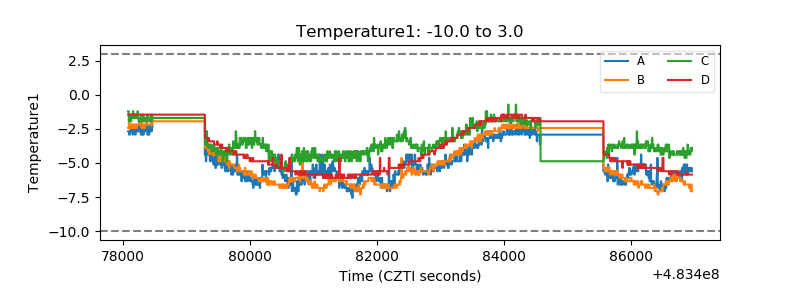 |
| Veto HV Monitor | 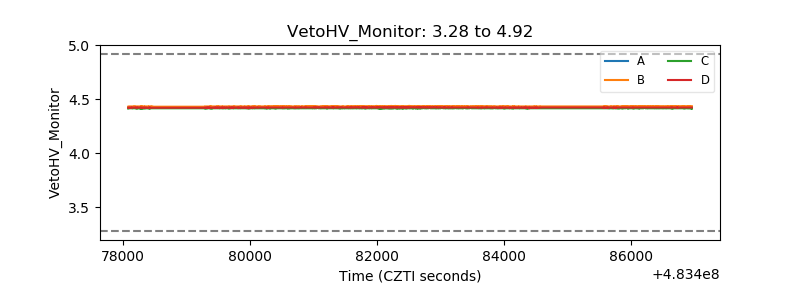 |
| Veto LLD | 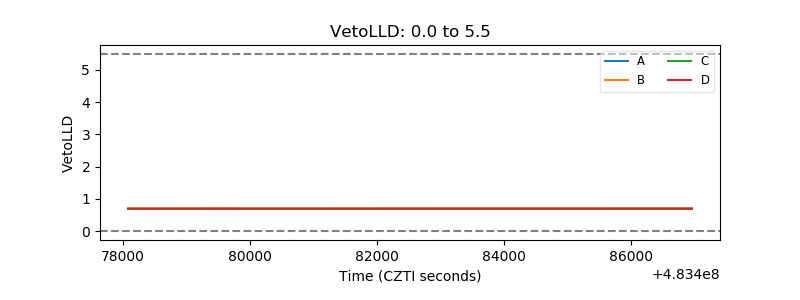 |
| Alpha Counter | 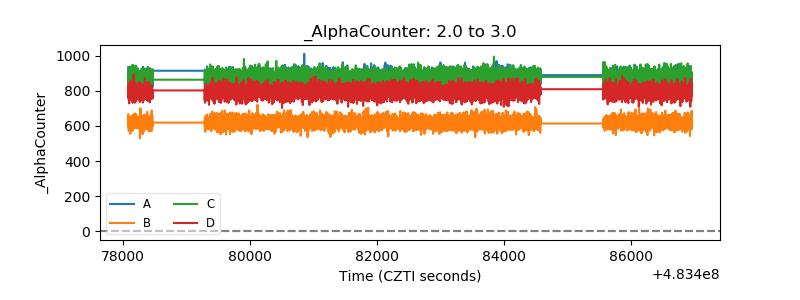 |
| _CPM_Rate | 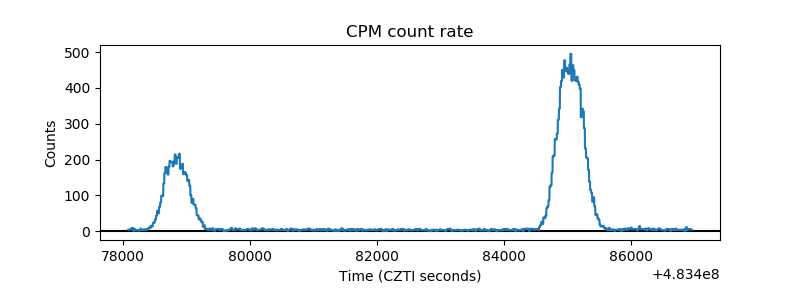 |
| CZT Counter | 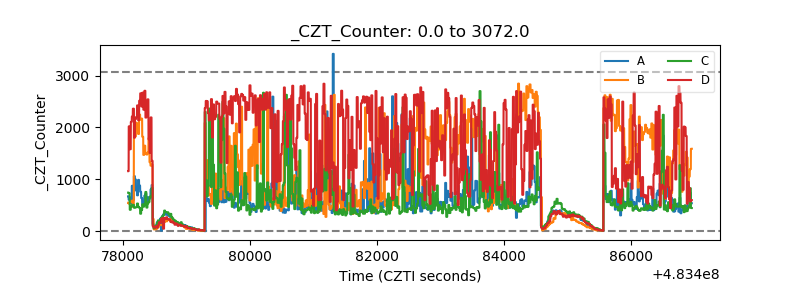 |
| +2.5 Volts monitor | 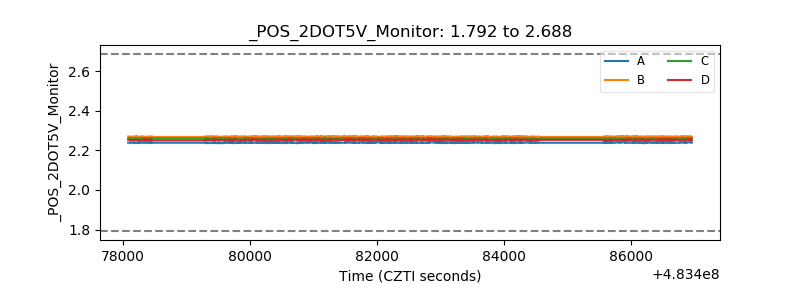 |
| +5 Volts monitor | 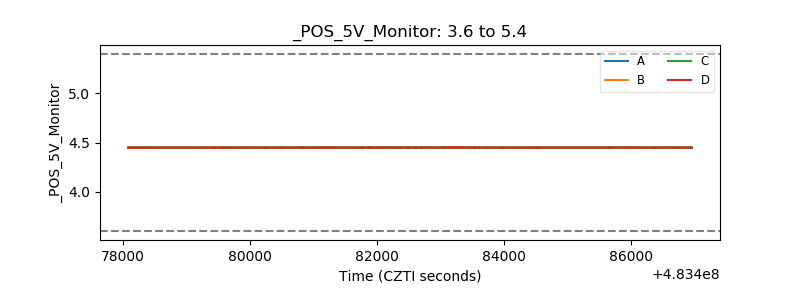 |
| _ROLL_ROT | 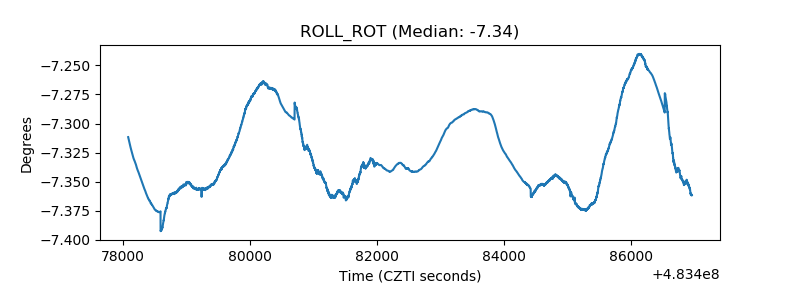 |
| _Roll_DEC | 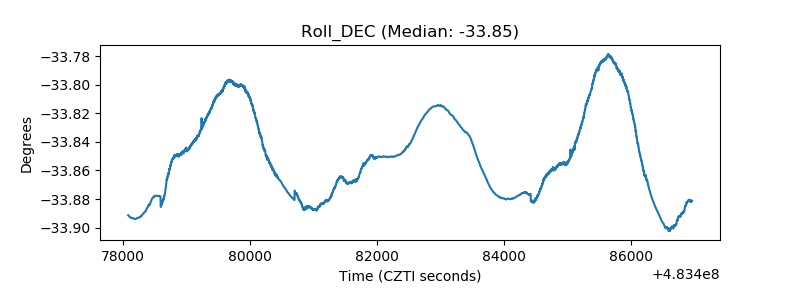 |
| _Roll_RA | 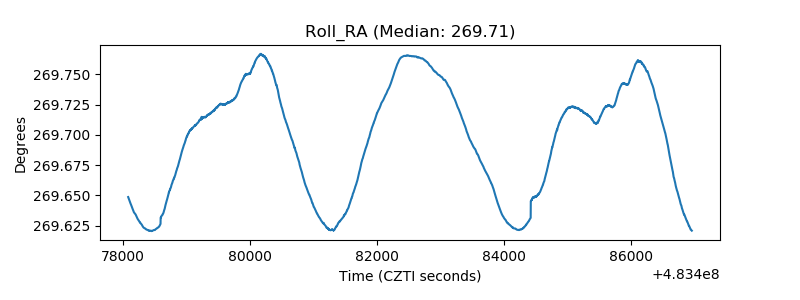 |
| Veto Counter | 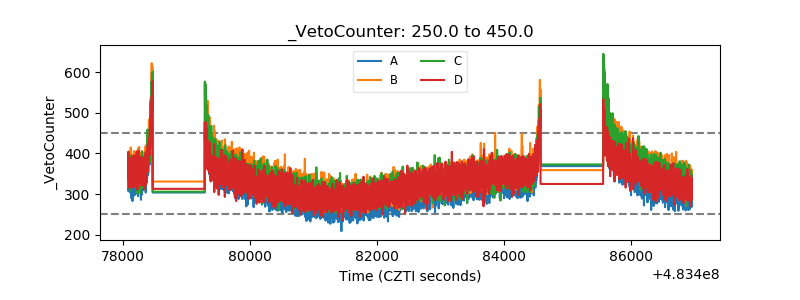 |