| Param | Original file | Final file |
|---|---|---|
| Filename | modeM0/AS1A13_090T01_9000006464_51827cztM0_level2.fits | modeM0/AS1A13_090T01_9000006464_51827cztM0_level2_quad_clean.evt |
| Size (bytes) | 827,366,400 | 80,890,560 |
| Size | 789.0 MB | 77.1 MB |
| Events in quadrant A | 5,315,365 | 621,123 |
| Events in quadrant B | 12,851,697 | 302,053 |
| Events in quadrant C | 4,183,168 | 600,052 |
| Events in quadrant D | 7,767,419 | 467,320 |
| Mode M9 | |||
|---|---|---|---|
| Quadrant | BADHDUFLAG | Total packets | Discarded packets |
| A | 0 | 11 | 0 |
| B | 0 | 12 | 0 |
| C | 0 | 12 | 0 |
| D | 0 | 12 | 0 |
| Mode SS | |||
|---|---|---|---|
| Quadrant | BADHDUFLAG | Total packets | Discarded packets |
| A | 0 | 132 | 0 |
| B | 0 | 132 | 0 |
| C | 0 | 132 | 0 |
| D | 0 | 132 | 0 |
| Mode M0 | |||
|---|---|---|---|
| Quadrant | BADHDUFLAG | Total packets | Discarded packets |
| A | 0 | 20488 | 3 |
| B | 0 | 42693 | 2 |
| C | 0 | 17141 | 2 |
| D | 0 | 27650 | 2 |
| Quadrant | Total seconds | Saturated seconds | Saturation percentage |
|---|---|---|---|
| A | 6577 | 191 | 2.904060% |
| B | 6577 | 4114 | 62.551315% |
| C | 6577 | 207 | 3.147332% |
| D | 6577 | 1350 | 20.526076% |
Noise dominated data is calculated using 1-second bins in cleaned event files. If a bin has >2000 counts, and if more than 50% of those come from <1% of pixels, then it is considered to be noise-dominated and hence unusable.
| Quadrant | # 1 sec bins | Bins with >0 counts | Bins with >2000 counts | High rate bins dominated by noise | Noise dominated (total time) | Noise dominated (detector-on time) | Marked lightcurve |
|---|---|---|---|---|---|---|---|
| A | 7657 | 6578 | 144 | 144 | 1.88% | 2.19% | 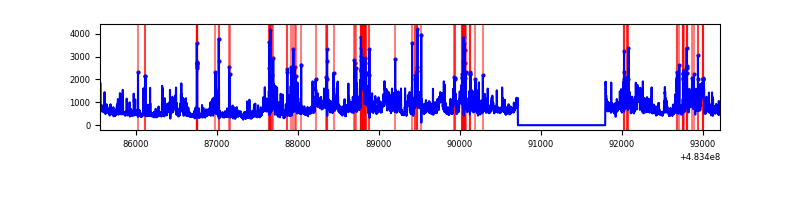 |
| B | 7657 | 6577 | 3200 | 3200 | 41.79% | 48.65% | 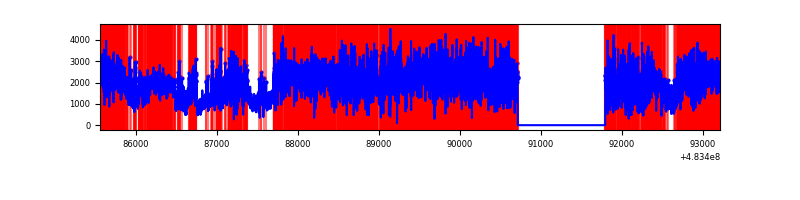 |
| C | 7657 | 6578 | 177 | 177 | 2.31% | 2.69% |  |
| D | 7657 | 6578 | 1200 | 1200 | 15.67% | 18.24% | 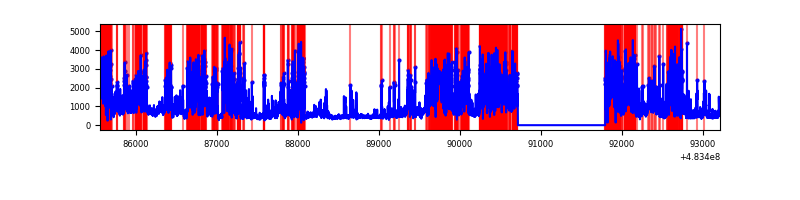 |
Top three noisy pixels from each quadrant. If the there are fewer than three noisy pixels in the level2.evt file, extra rows are filled as -1
| Pixel properties | Quadrant properties | ||||||
|---|---|---|---|---|---|---|---|
| Quadrant | DetID | PixID | Counts | Sigma | Mean | Median | Sigma |
| A | 12 | 3 | 1297855 | 7513.83 | 698 | 680 | 172.6 |
| A | 15 | 250 | 253757 | 1465.94 | 698 | 680 | 172.6 |
| A | 5 | 240 | 209527 | 1209.74 | 698 | 680 | 172.6 |
| B | 15 | 54 | 9473989 | 80454.93 | 546 | 525 | 117.7 |
| B | 5 | 185 | 337706 | 2863.56 | 546 | 525 | 117.7 |
| B | 0 | 171 | 203410 | 1723.03 | 546 | 525 | 117.7 |
| C | 7 | 220 | 725312 | 3796.37 | 694 | 689 | 190.9 |
| C | 14 | 80 | 158400 | 826.26 | 694 | 689 | 190.9 |
| C | 0 | 192 | 141134 | 735.8 | 694 | 689 | 190.9 |
| D | 11 | 129 | 3907640 | 22768.46 | 620 | 599 | 171.6 |
| D | 8 | 176 | 378548 | 2202.52 | 620 | 599 | 171.6 |
| D | 9 | 49 | 373171 | 2171.18 | 620 | 599 | 171.6 |
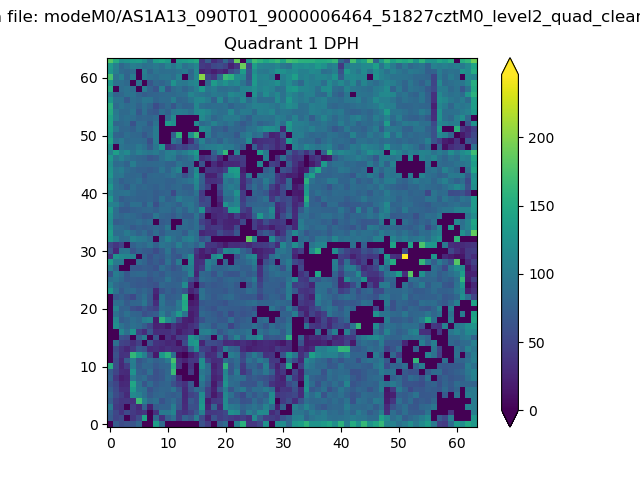
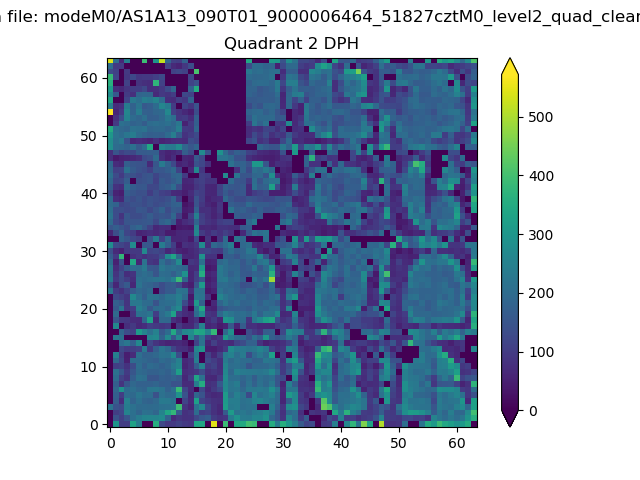
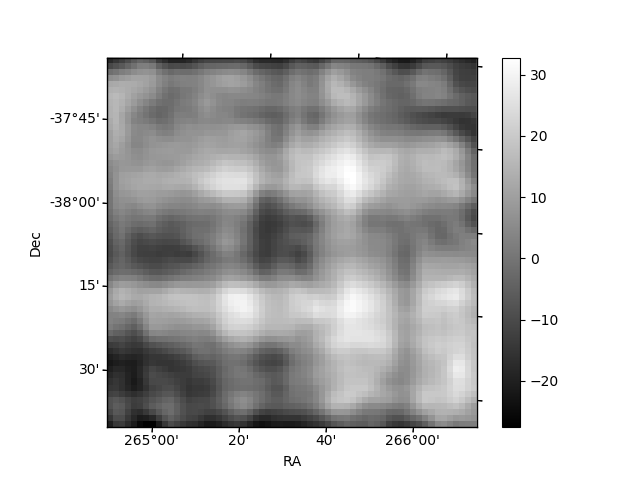
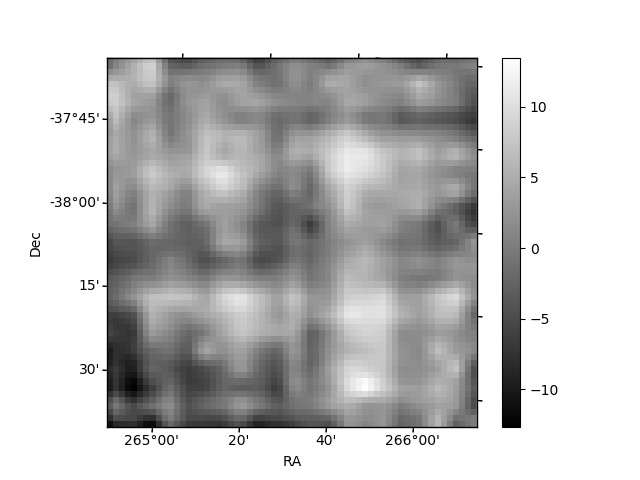
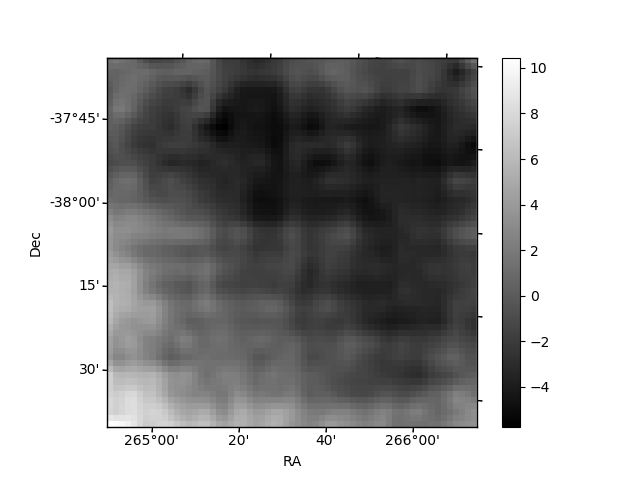
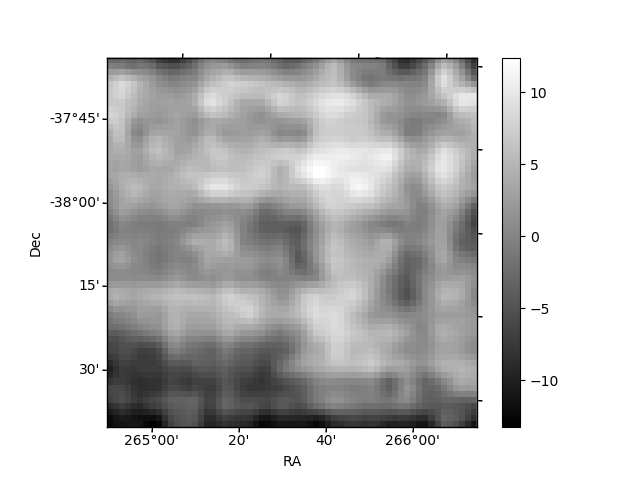
Histogram calculated using DETX and DETY for each event in the final _common_clean file
| Quadrant A | 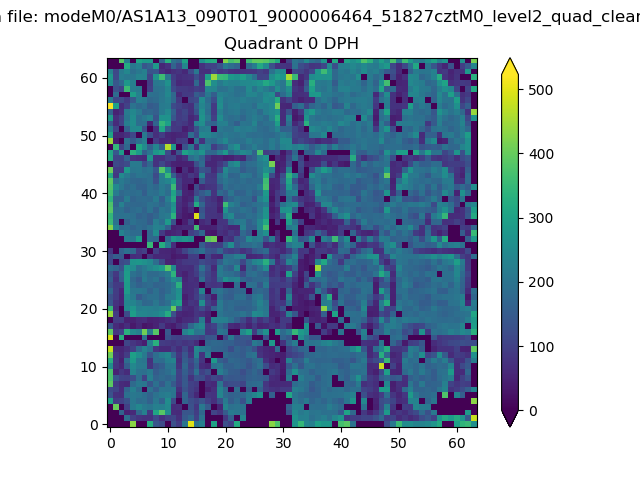 |
 |
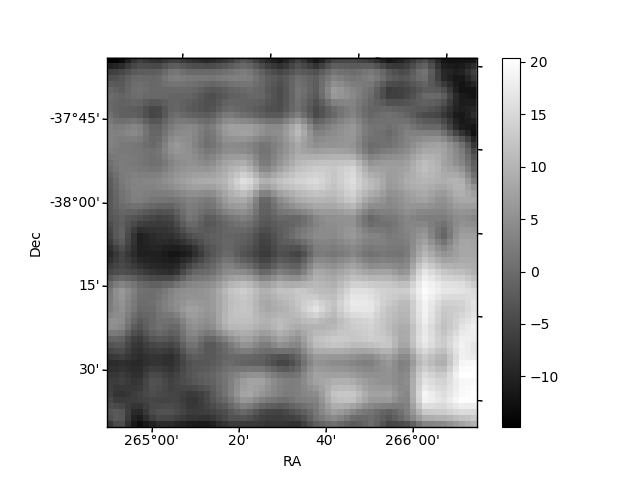
Quadrant B |
|---|---|---|---|
| Quadrant D | 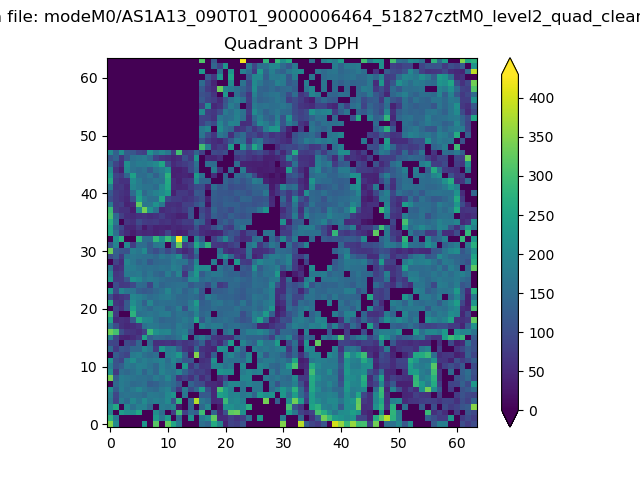 |
 |
Quadrant C |
| Plot type | Count rate plots | Images |
|---|---|---|
| Comparison with Poisson distribution Blue bars denote a histogram of data divided into 1 sec bins. Red curve is a Poisson curve with rate = median count rate of data. |
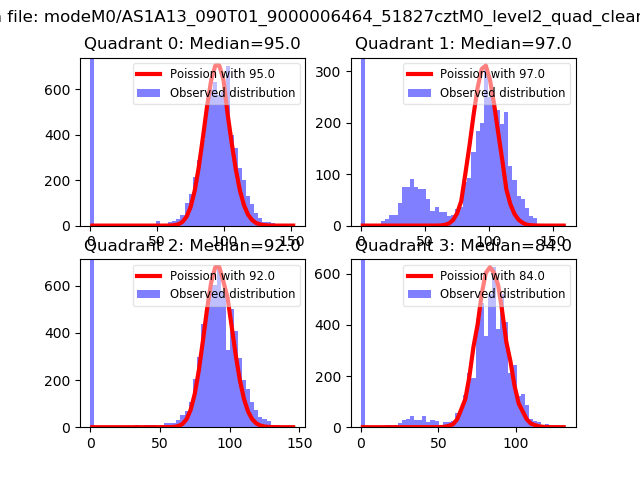 |
 |
| Quadrant-wise count rates Data is divided into 100 sec bins |
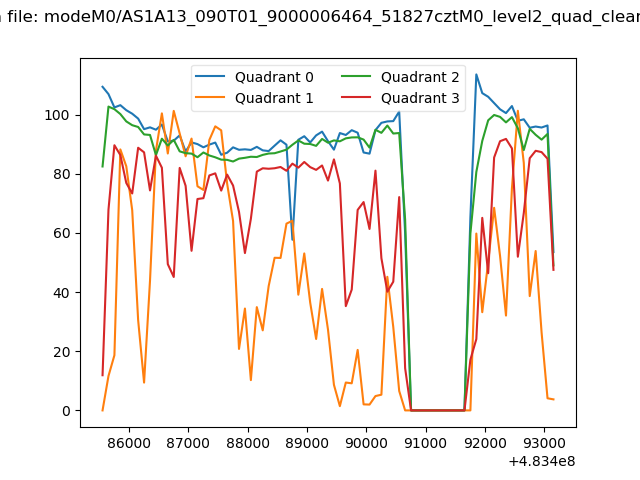 |
|
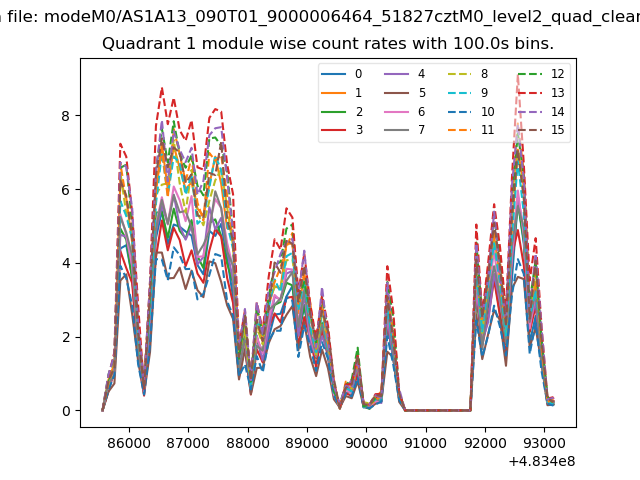
| Module-wise count rates for Quadrant A Data is divided into 100 sec bins |
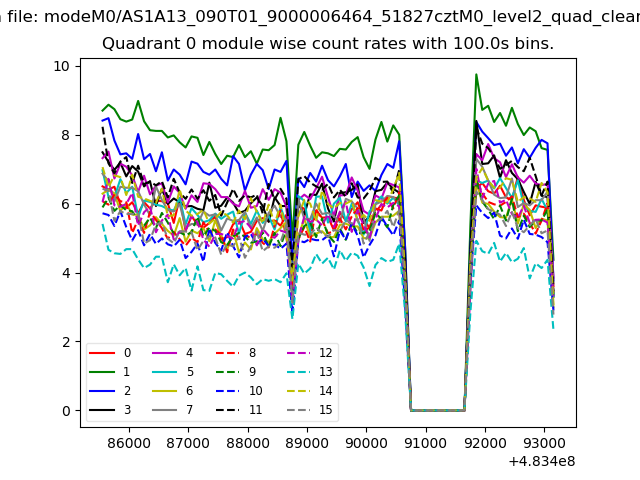 |
 |
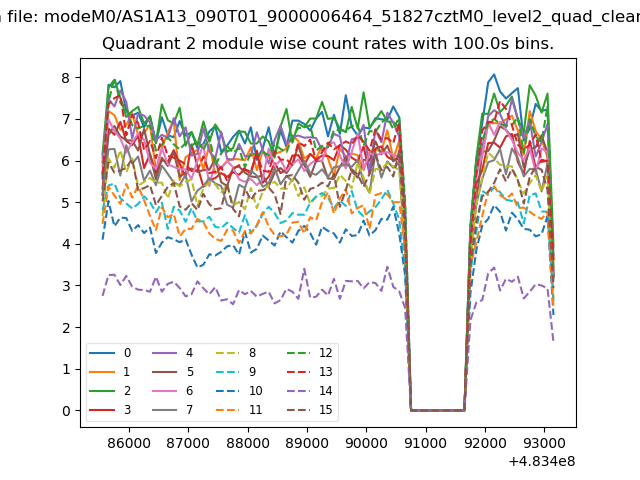
| Module-wise count rates for Quadrant B Data is divided into 100 sec bins |
 |
 |
| Module-wise count rates for Quadrant C Data is divided into 100 sec bins |
 |
 |
| Module-wise count rates for Quadrant D Data is divided into 100 sec bins |
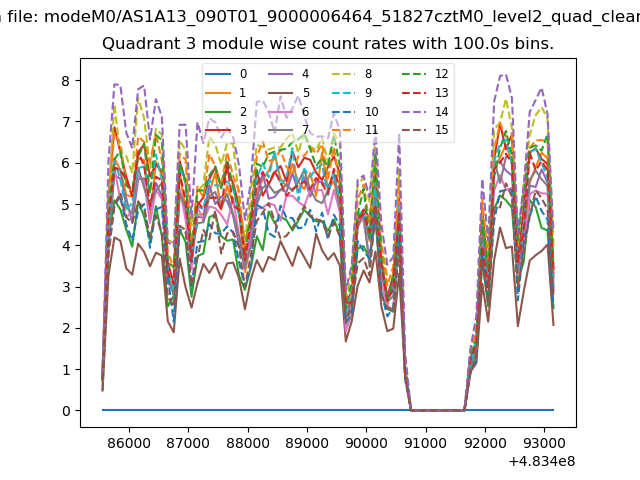 |
 |
| Parameter | Plot |
|---|---|
| CZT HV Monitor | 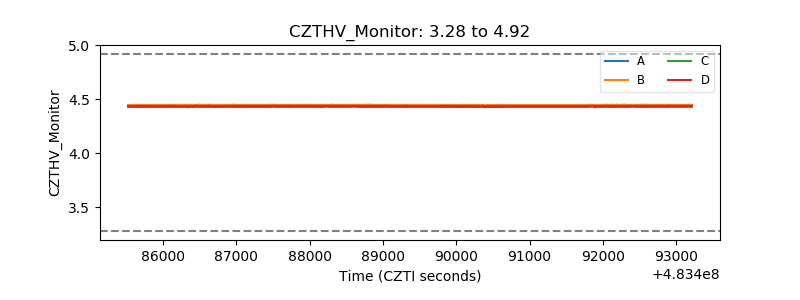 |
| D_VDD | 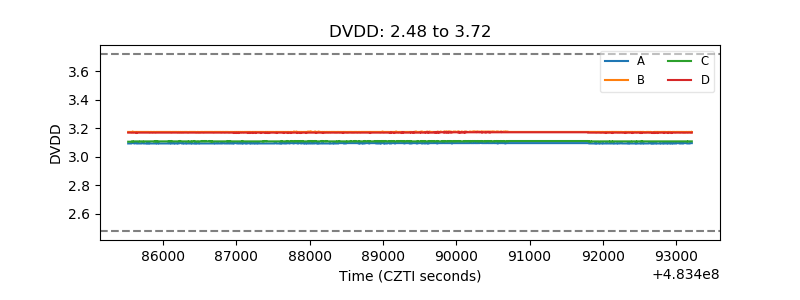 |
| Temperature 1 | 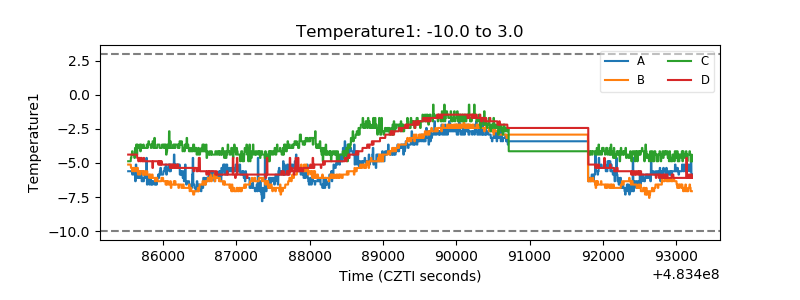 |
| Veto HV Monitor | 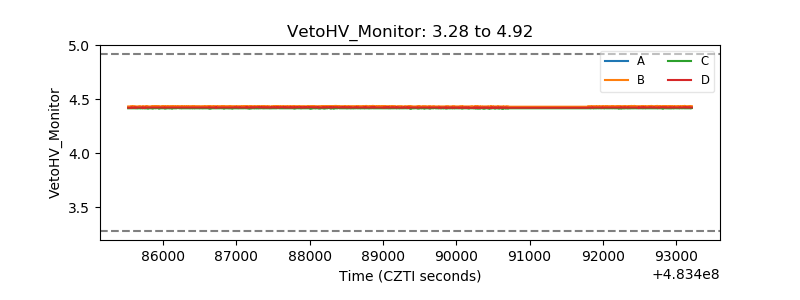 |
| Veto LLD | 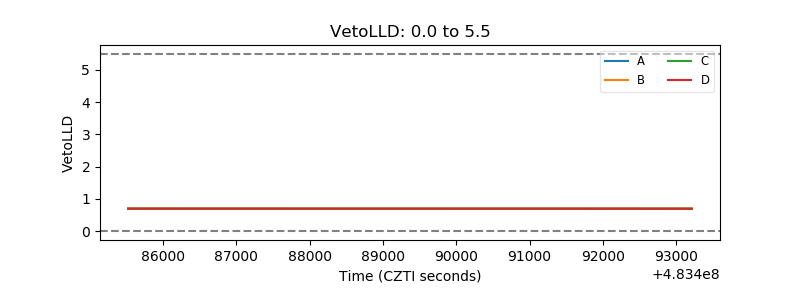 |
| Alpha Counter | 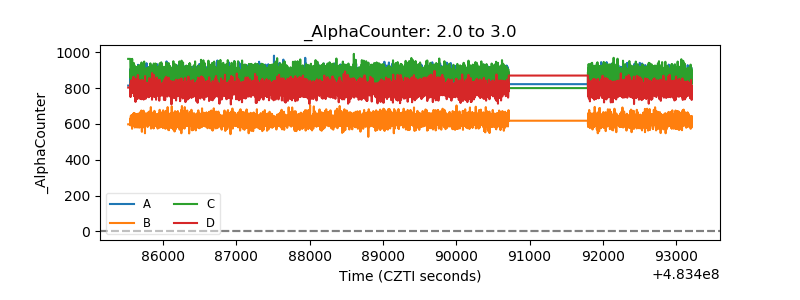 |
| _CPM_Rate | 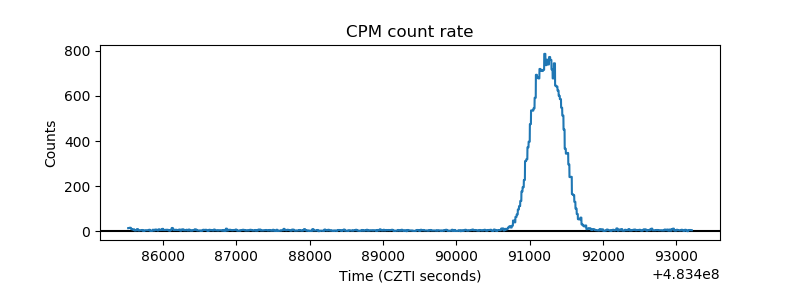 |
| CZT Counter | 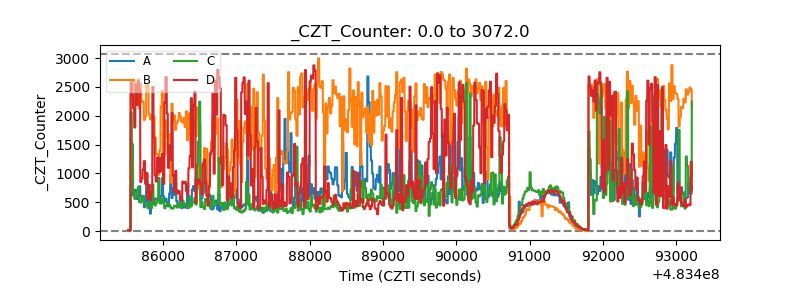 |
| +2.5 Volts monitor | 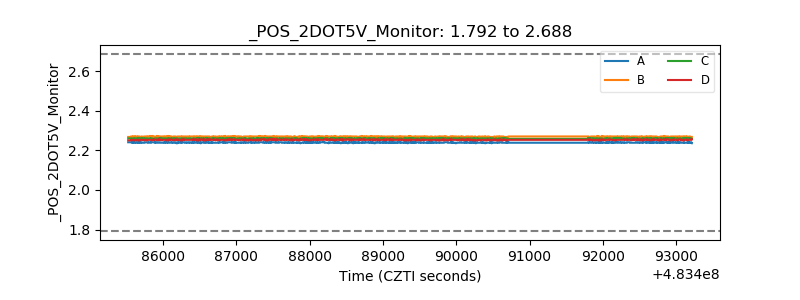 |
| +5 Volts monitor | 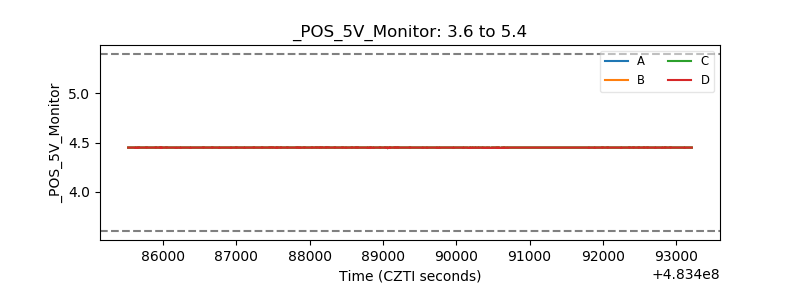 |
| _ROLL_ROT | 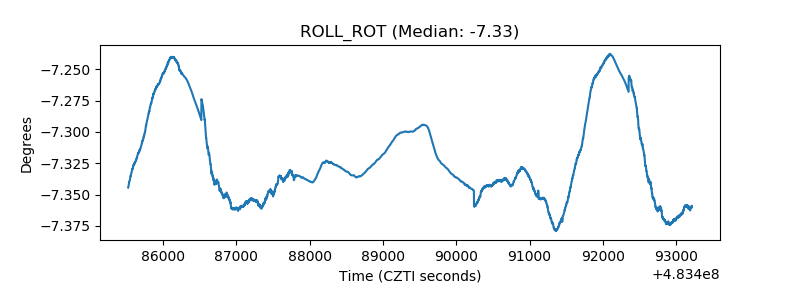 |
| _Roll_DEC | 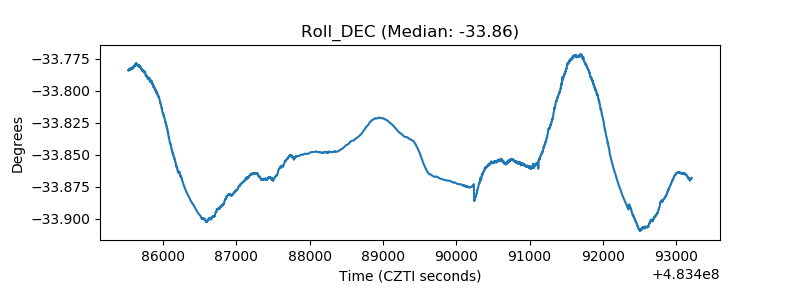 |
| _Roll_RA | 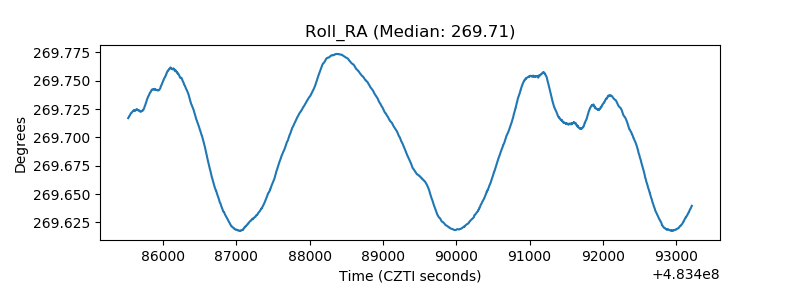 |
| Veto Counter | 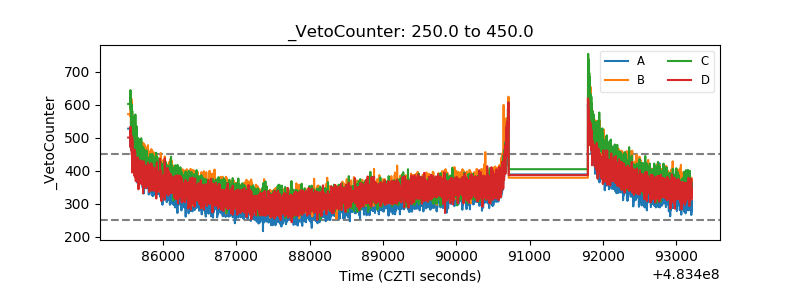 |