| Param | Original file | Final file |
|---|---|---|
| Filename | modeM0/AS1A13_090T01_9000006464_51829cztM0_level2.fits | modeM0/AS1A13_090T01_9000006464_51829cztM0_level2_quad_clean.evt |
| Size (bytes) | 672,390,720 | 91,281,600 |
| Size | 641.2 MB | 87.1 MB |
| Events in quadrant A | 5,844,214 | 607,441 |
| Events in quadrant B | 4,236,946 | 692,601 |
| Events in quadrant C | 4,983,711 | 596,245 |
| Events in quadrant D | 9,318,020 | 411,031 |
| Mode M9 | |||
|---|---|---|---|
| Quadrant | BADHDUFLAG | Total packets | Discarded packets |
| A | 0 | 15 | 0 |
| B | 0 | 16 | 0 |
| C | 0 | 16 | 0 |
| D | 0 | 16 | 0 |
| Mode SS | |||
|---|---|---|---|
| Quadrant | BADHDUFLAG | Total packets | Discarded packets |
| A | 0 | 134 | 0 |
| B | 0 | 134 | 0 |
| C | 0 | 134 | 0 |
| D | 0 | 134 | 0 |
| Mode M0 | |||
|---|---|---|---|
| Quadrant | BADHDUFLAG | Total packets | Discarded packets |
| A | 0 | 21902 | 2 |
| B | 0 | 17028 | 2 |
| C | 0 | 19230 | 2 |
| D | 0 | 32218 | 7 |
| Quadrant | Total seconds | Saturated seconds | Saturation percentage |
|---|---|---|---|
| A | 6542 | 561 | 8.575359% |
| B | 6542 | 266 | 4.066035% |
| C | 6542 | 502 | 7.673494% |
| D | 6541 | 2279 | 34.841767% |
Noise dominated data is calculated using 1-second bins in cleaned event files. If a bin has >2000 counts, and if more than 50% of those come from <1% of pixels, then it is considered to be noise-dominated and hence unusable.
| Quadrant | # 1 sec bins | Bins with >0 counts | Bins with >2000 counts | High rate bins dominated by noise | Noise dominated (total time) | Noise dominated (detector-on time) | Marked lightcurve |
|---|---|---|---|---|---|---|---|
| A | 7657 | 6543 | 423 | 423 | 5.52% | 6.46% | 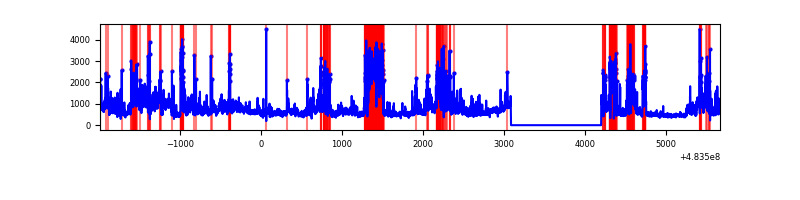 |
| B | 7657 | 6543 | 51 | 51 | 0.67% | 0.78% | 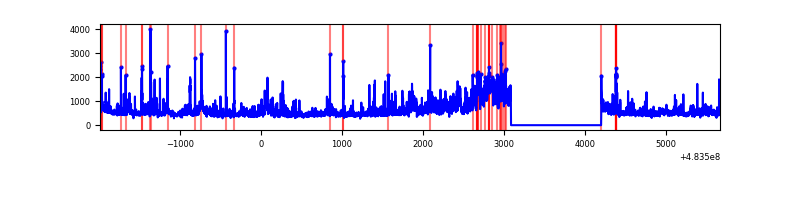 |
| C | 7657 | 6542 | 336 | 336 | 4.39% | 5.14% |  |
| D | 7655 | 6540 | 1674 | 1674 | 21.87% | 25.60% | 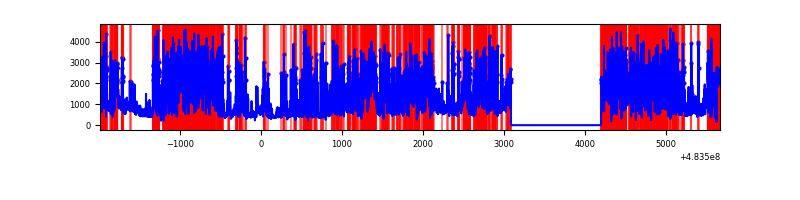 |
Top three noisy pixels from each quadrant. If the there are fewer than three noisy pixels in the level2.evt file, extra rows are filled as -1
| Pixel properties | Quadrant properties | ||||||
|---|---|---|---|---|---|---|---|
| Quadrant | DetID | PixID | Counts | Sigma | Mean | Median | Sigma |
| A | 12 | 3 | 1069245 | 6165.9 | 699 | 684 | 173.3 |
| A | 15 | 174 | 661531 | 3813.28 | 699 | 684 | 173.3 |
| A | 13 | 248 | 568686 | 3277.53 | 699 | 684 | 173.3 |
| B | 4 | 81 | 259479 | 1689.88 | 718 | 693 | 153.1 |
| B | 10 | 128 | 240687 | 1567.17 | 718 | 693 | 153.1 |
| B | 0 | 171 | 136571 | 887.29 | 718 | 693 | 153.1 |
| C | 13 | 3 | 558394 | 2885.13 | 698 | 691 | 193.3 |
| C | 12 | 254 | 287633 | 1484.42 | 698 | 691 | 193.3 |
| C | 0 | 192 | 242826 | 1252.62 | 698 | 691 | 193.3 |
| D | 11 | 129 | 5632363 | 34713.9 | 585 | 564 | 162.2 |
| D | 8 | 176 | 706837 | 4353.4 | 585 | 564 | 162.2 |
| D | 3 | 12 | 303620 | 1868.01 | 585 | 564 | 162.2 |
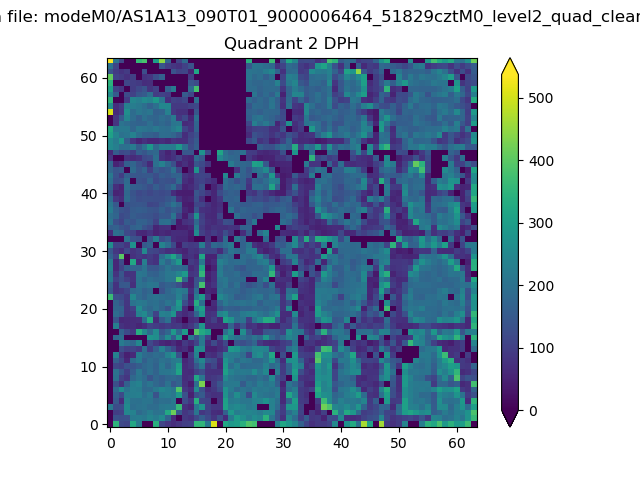
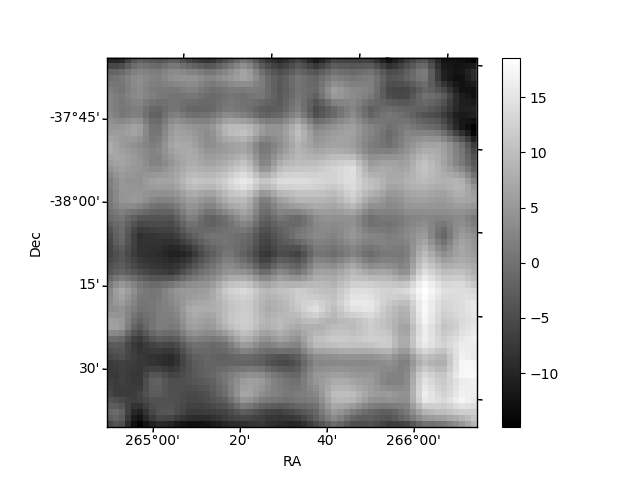
Histogram calculated using DETX and DETY for each event in the final _common_clean file
| Quadrant A |  |
 |
Quadrant B |
|---|---|---|---|
| Quadrant D | 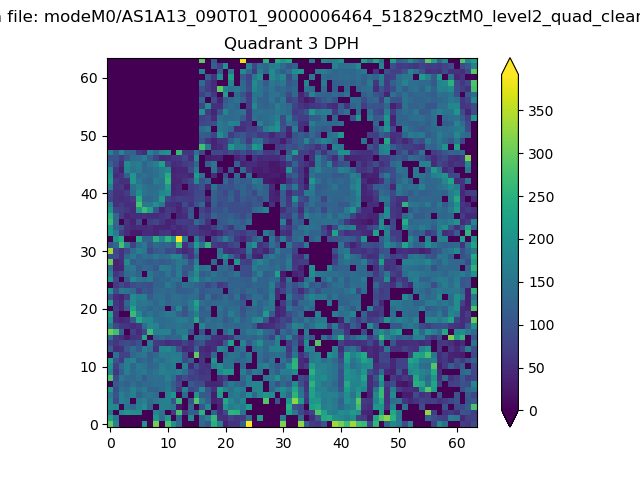 |
 |
Quadrant C |
| Plot type | Count rate plots | Images |
|---|---|---|
| Comparison with Poisson distribution Blue bars denote a histogram of data divided into 1 sec bins. Red curve is a Poisson curve with rate = median count rate of data. |
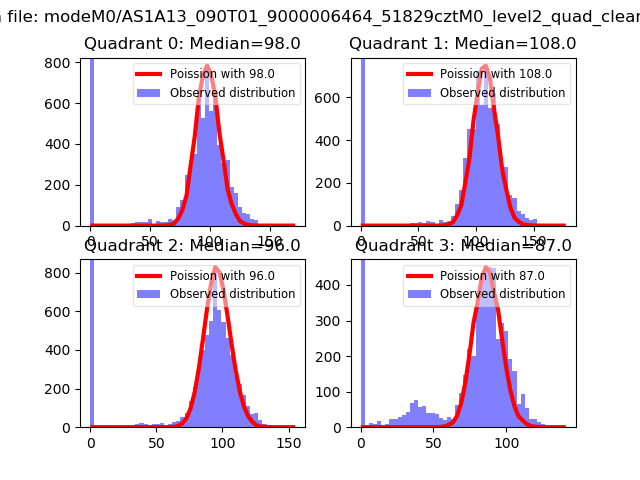 |
 |
| Quadrant-wise count rates Data is divided into 100 sec bins |
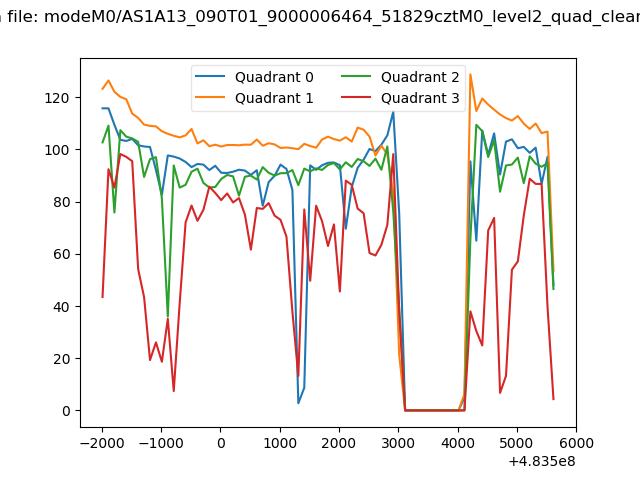 |
|
| Module-wise count rates for Quadrant A Data is divided into 100 sec bins |
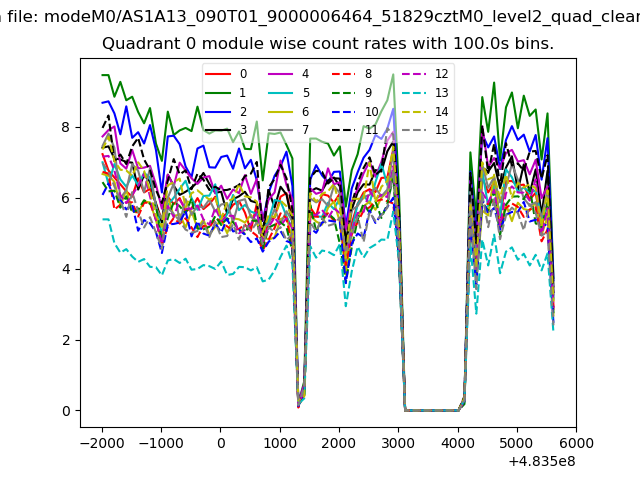 |
 |
| Module-wise count rates for Quadrant B Data is divided into 100 sec bins |
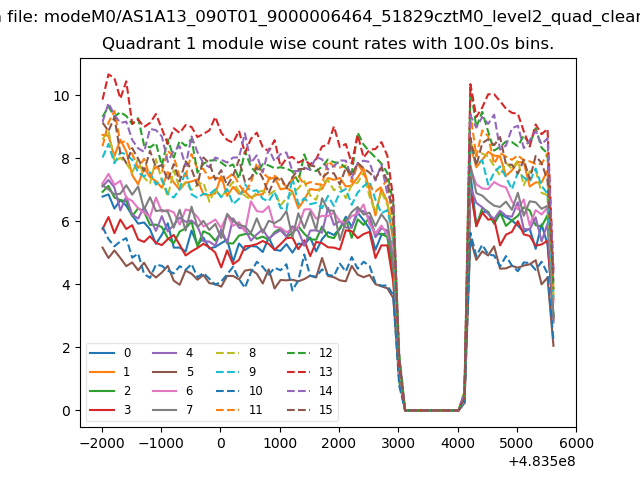 |
 |
| Module-wise count rates for Quadrant C Data is divided into 100 sec bins |
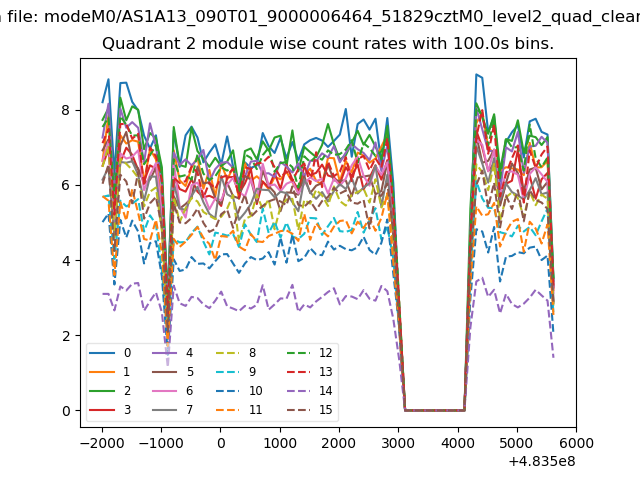 |
 |
| Module-wise count rates for Quadrant D Data is divided into 100 sec bins |
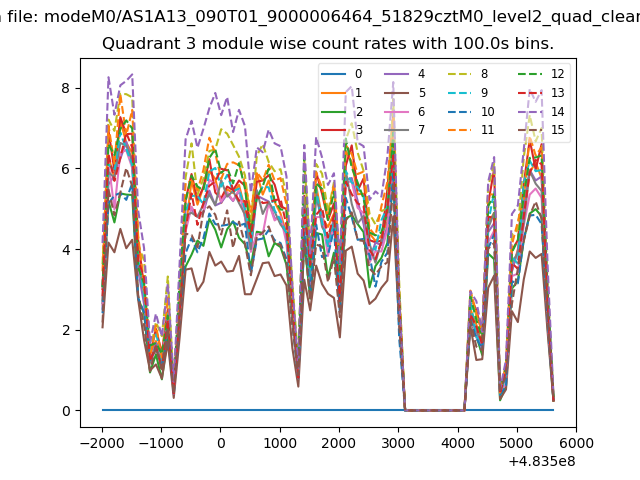 |
 |
| Parameter | Plot |
|---|---|
| CZT HV Monitor | 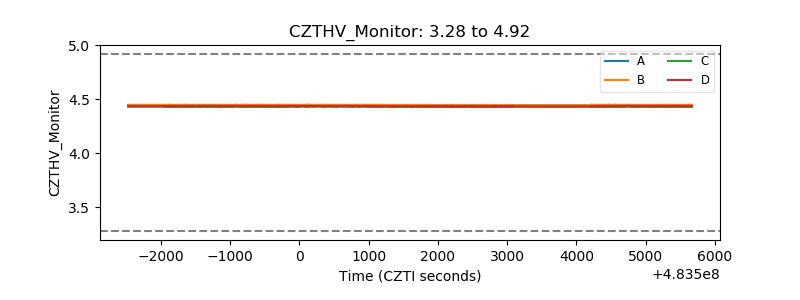 |
| D_VDD | 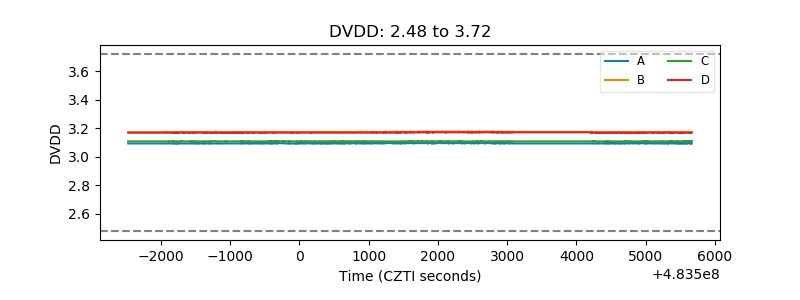 |
| Temperature 1 | 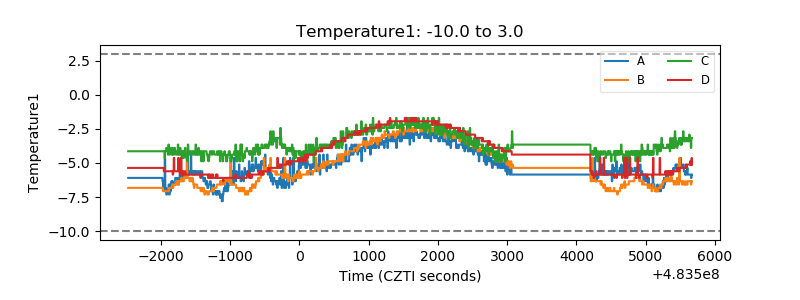 |
| Veto HV Monitor | 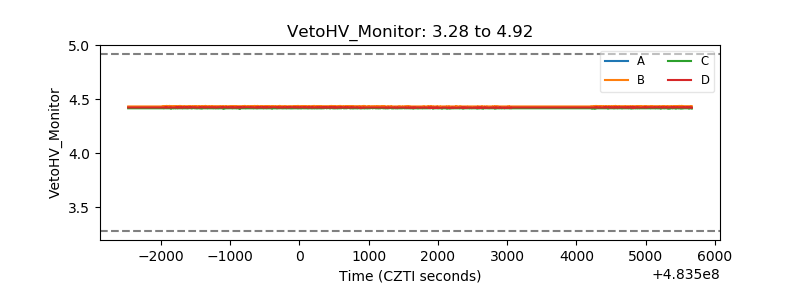 |
| Veto LLD | 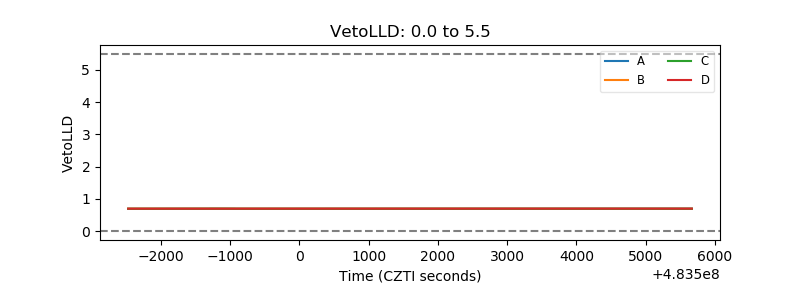 |
| Alpha Counter | 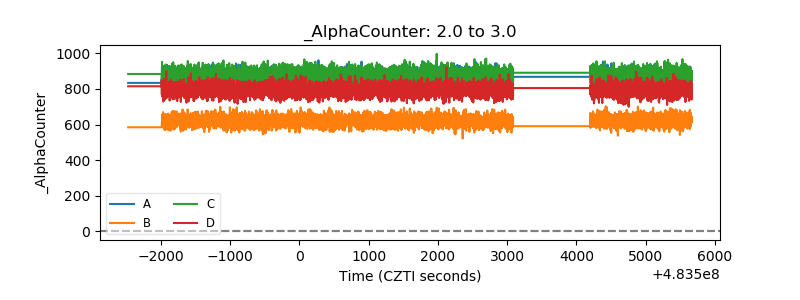 |
| _CPM_Rate | 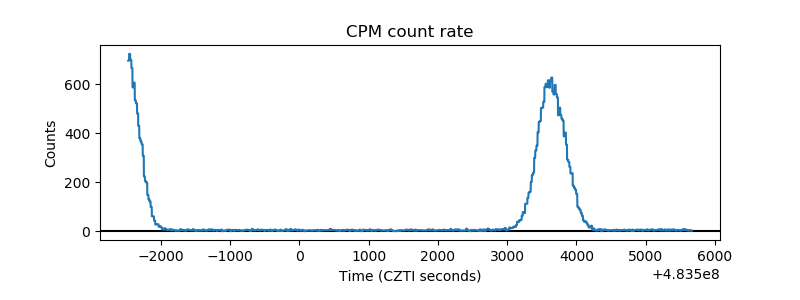 |
| CZT Counter | 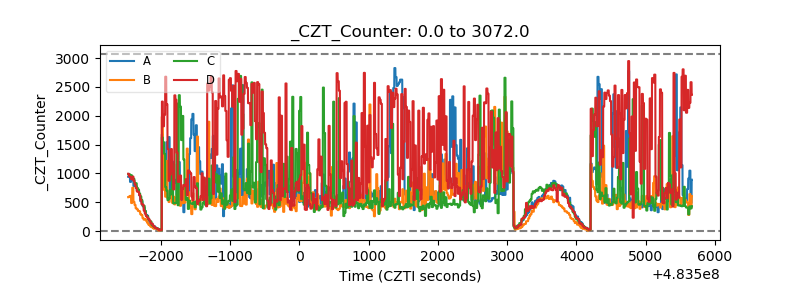 |
| +2.5 Volts monitor | 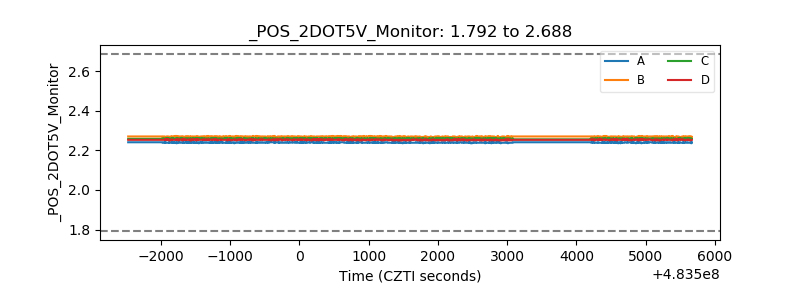 |
| +5 Volts monitor | 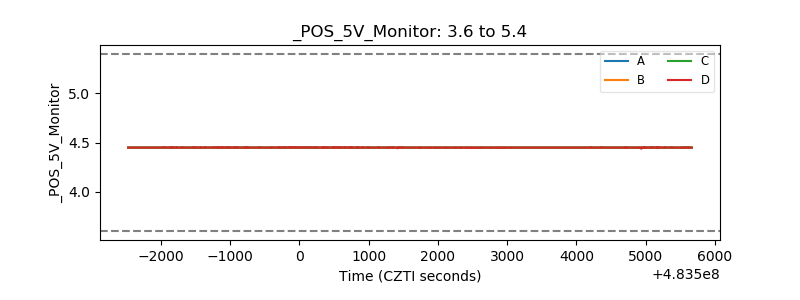 |
| _ROLL_ROT | 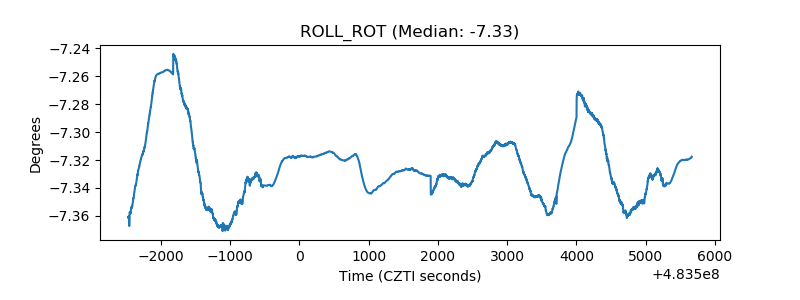 |
| _Roll_DEC | 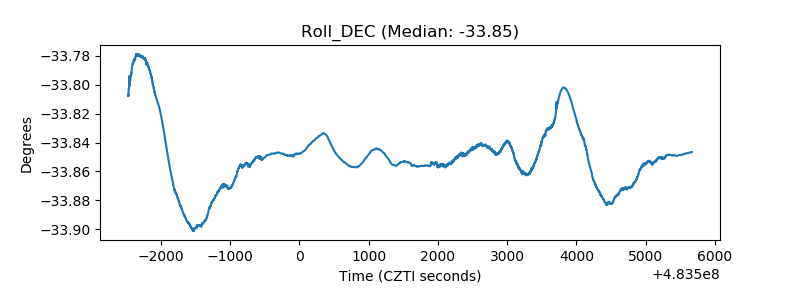 |
| _Roll_RA | 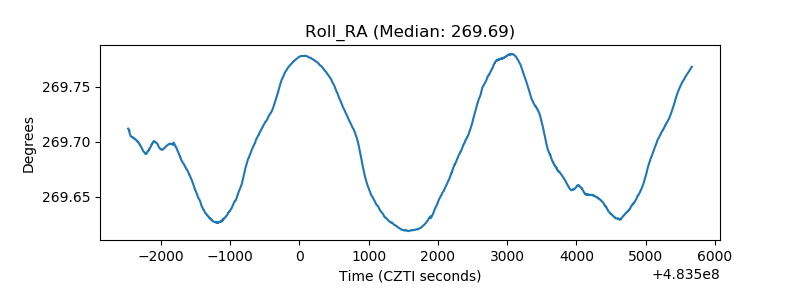 |
| Veto Counter | 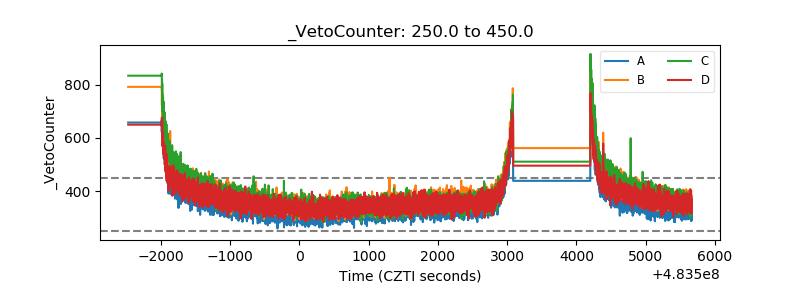 |