| Param | Original file | Final file |
|---|---|---|
| Filename | modeM0/AS1A13_090T01_9000006464_51830cztM0_level2.fits | modeM0/AS1A13_090T01_9000006464_51830cztM0_level2_quad_clean.evt |
| Size (bytes) | 717,108,480 | 90,192,960 |
| Size | 683.9 MB | 86.0 MB |
| Events in quadrant A | 5,454,910 | 626,483 |
| Events in quadrant B | 5,987,605 | 662,854 |
| Events in quadrant C | 4,025,971 | 614,329 |
| Events in quadrant D | 10,566,030 | 366,569 |
| Mode M9 | |||
|---|---|---|---|
| Quadrant | BADHDUFLAG | Total packets | Discarded packets |
| A | 0 | 16 | 0 |
| B | 0 | 17 | 0 |
| C | 0 | 17 | 0 |
| D | 0 | 17 | 0 |
| Mode SS | |||
|---|---|---|---|
| Quadrant | BADHDUFLAG | Total packets | Discarded packets |
| A | 0 | 136 | 0 |
| B | 0 | 136 | 0 |
| C | 0 | 136 | 0 |
| D | 0 | 136 | 0 |
| Mode M0 | |||
|---|---|---|---|
| Quadrant | BADHDUFLAG | Total packets | Discarded packets |
| A | 0 | 20808 | 2 |
| B | 0 | 22302 | 2 |
| C | 0 | 16598 | 2 |
| D | 0 | 35933 | 2 |
| Quadrant | Total seconds | Saturated seconds | Saturation percentage |
|---|---|---|---|
| A | 6596 | 318 | 4.821104% |
| B | 6596 | 619 | 9.384475% |
| C | 6596 | 259 | 3.926622% |
| D | 6596 | 2813 | 42.647059% |
Noise dominated data is calculated using 1-second bins in cleaned event files. If a bin has >2000 counts, and if more than 50% of those come from <1% of pixels, then it is considered to be noise-dominated and hence unusable.
| Quadrant | # 1 sec bins | Bins with >0 counts | Bins with >2000 counts | High rate bins dominated by noise | Noise dominated (total time) | Noise dominated (detector-on time) | Marked lightcurve |
|---|---|---|---|---|---|---|---|
| A | 7666 | 6597 | 179 | 179 | 2.33% | 2.71% | 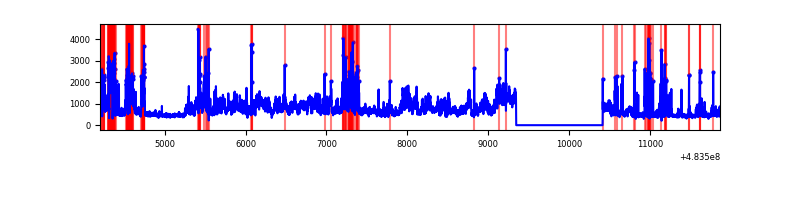 |
| B | 7666 | 6597 | 392 | 392 | 5.11% | 5.94% | 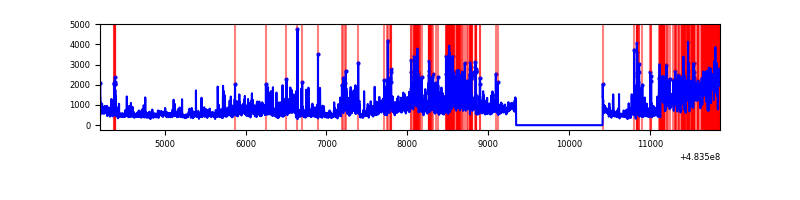 |
| C | 7666 | 6597 | 137 | 137 | 1.79% | 2.08% | 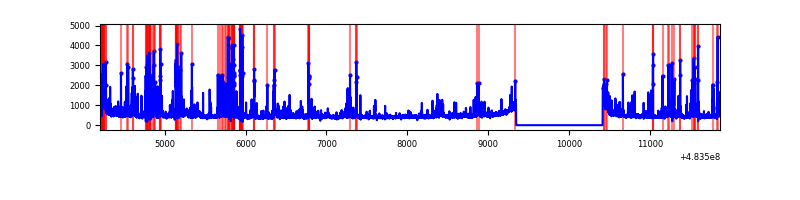 |
| D | 7666 | 6597 | 2214 | 2214 | 28.88% | 33.56% | 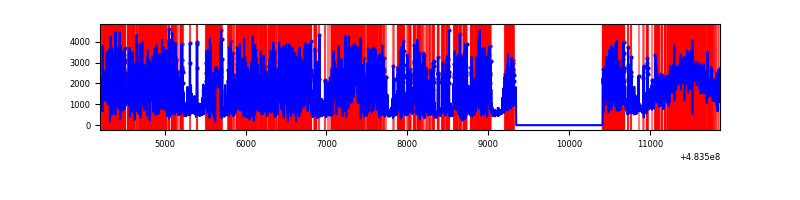 |
Top three noisy pixels from each quadrant. If the there are fewer than three noisy pixels in the level2.evt file, extra rows are filled as -1
| Pixel properties | Quadrant properties | ||||||
|---|---|---|---|---|---|---|---|
| Quadrant | DetID | PixID | Counts | Sigma | Mean | Median | Sigma |
| A | 12 | 3 | 1224650 | 6933.04 | 719 | 701 | 176.5 |
| A | 15 | 174 | 446056 | 2522.71 | 719 | 701 | 176.5 |
| A | 5 | 240 | 355306 | 2008.66 | 719 | 701 | 176.5 |
| B | 10 | 128 | 1120003 | 7376.48 | 711 | 685 | 151.7 |
| B | 15 | 54 | 795308 | 5236.69 | 711 | 685 | 151.7 |
| B | 1 | 223 | 259733 | 1707.17 | 711 | 685 | 151.7 |
| C | 13 | 3 | 357286 | 1800.66 | 713 | 706 | 198.0 |
| C | 15 | 231 | 188795 | 949.81 | 713 | 706 | 198.0 |
| C | 12 | 254 | 147934 | 743.47 | 713 | 706 | 198.0 |
| D | 11 | 129 | 6932274 | 43249.23 | 572 | 551 | 160.3 |
| D | 8 | 176 | 967581 | 6033.61 | 572 | 551 | 160.3 |
| D | 11 | 176 | 100978 | 626.6 | 572 | 551 | 160.3 |
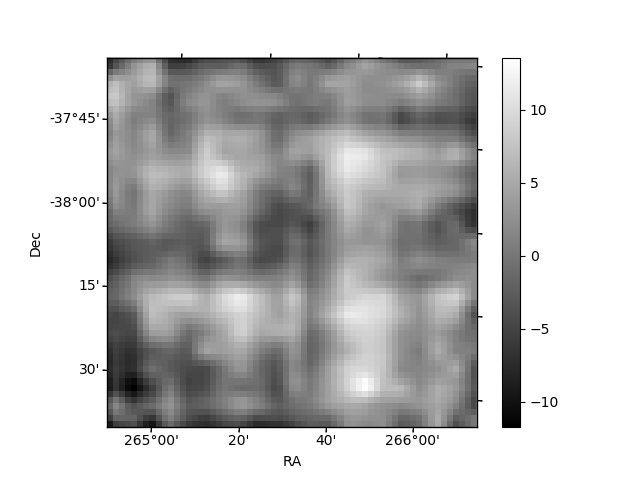
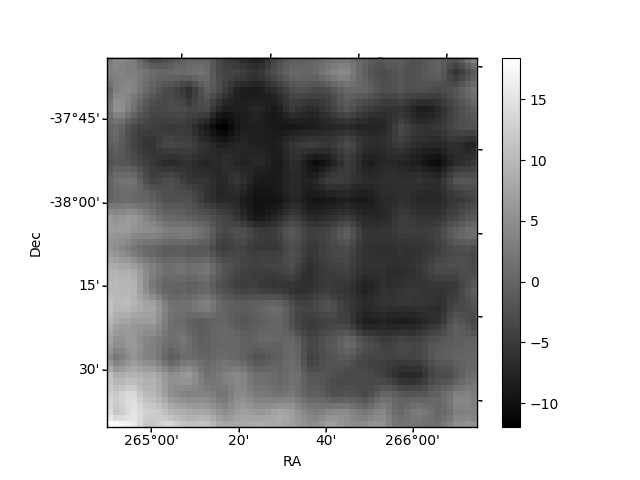
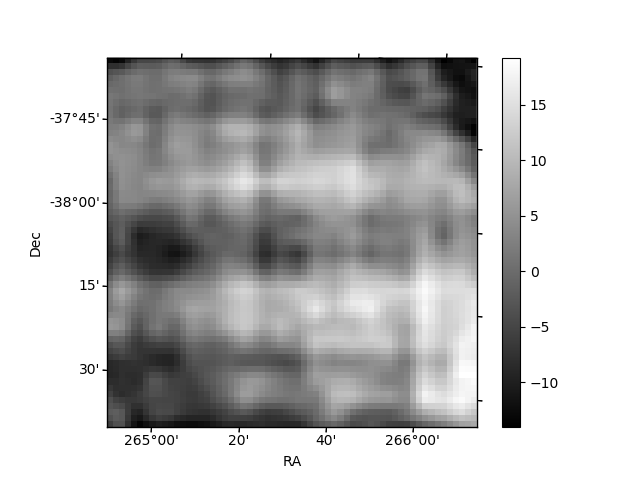
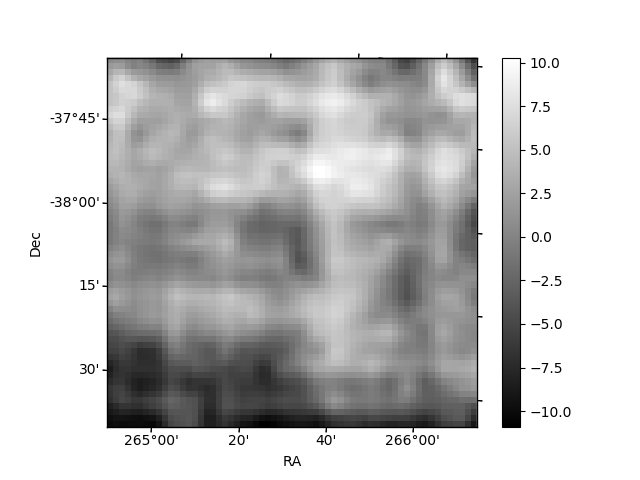
Histogram calculated using DETX and DETY for each event in the final _common_clean file
| Quadrant A | 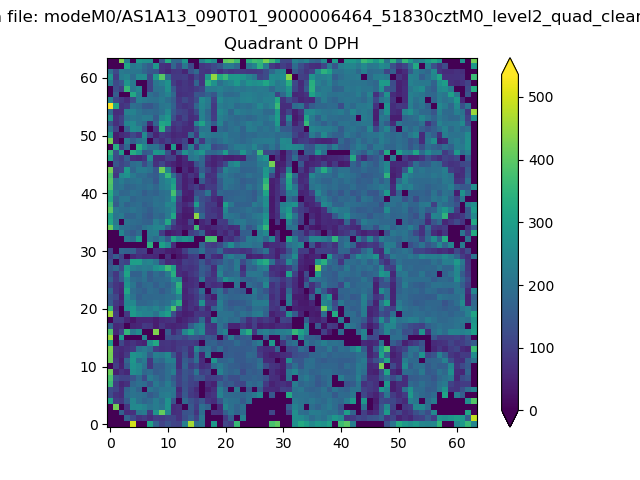 |
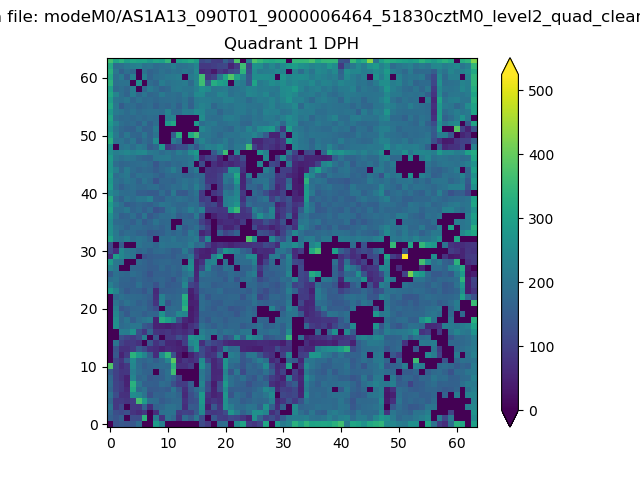 |
Quadrant B |
|---|---|---|---|
| Quadrant D | 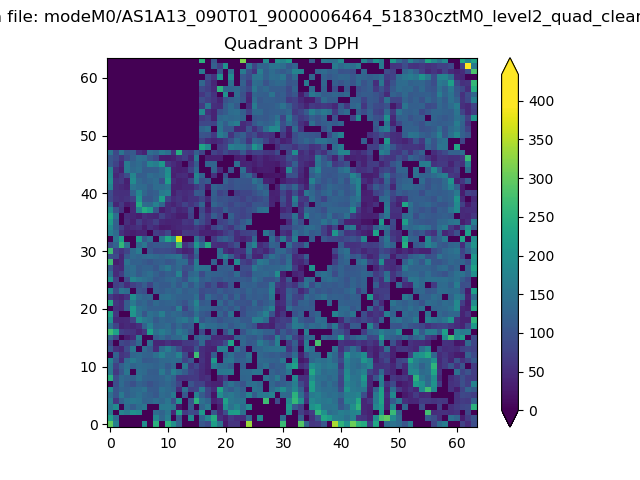 |
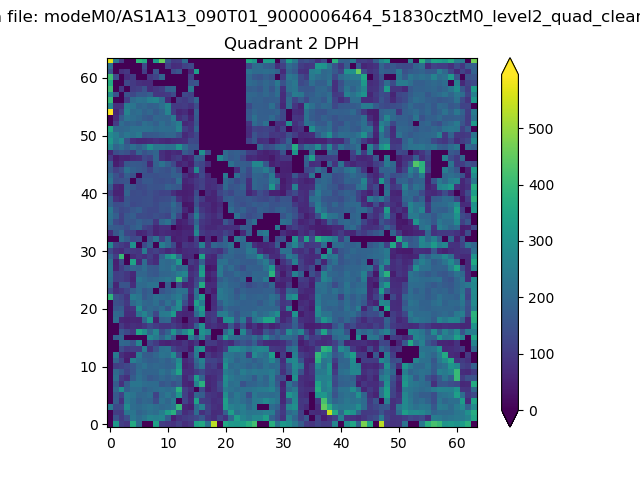 |
Quadrant C |
| Plot type | Count rate plots | Images |
|---|---|---|
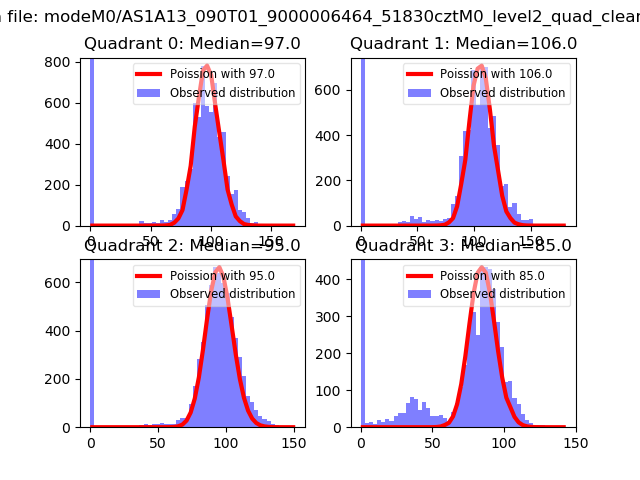
| Comparison with Poisson distribution Blue bars denote a histogram of data divided into 1 sec bins. Red curve is a Poisson curve with rate = median count rate of data. |
 |
 |
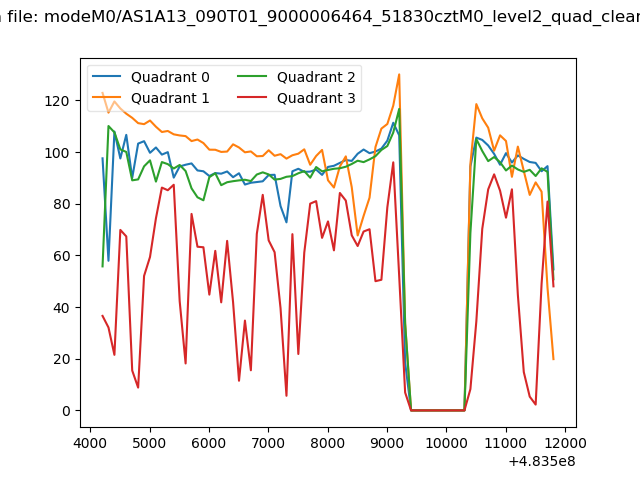
| Quadrant-wise count rates Data is divided into 100 sec bins |
 |
|
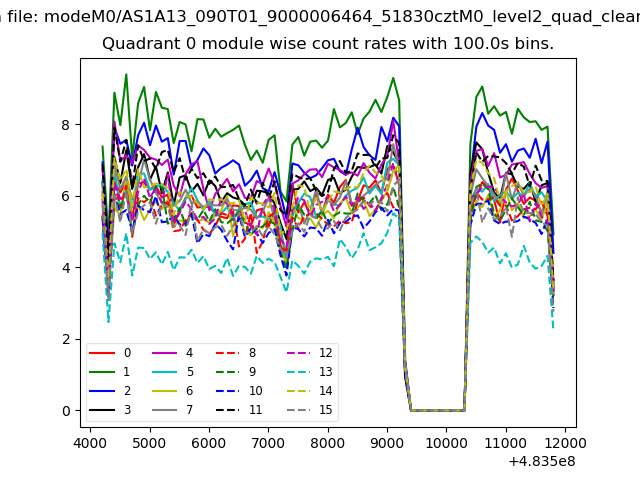
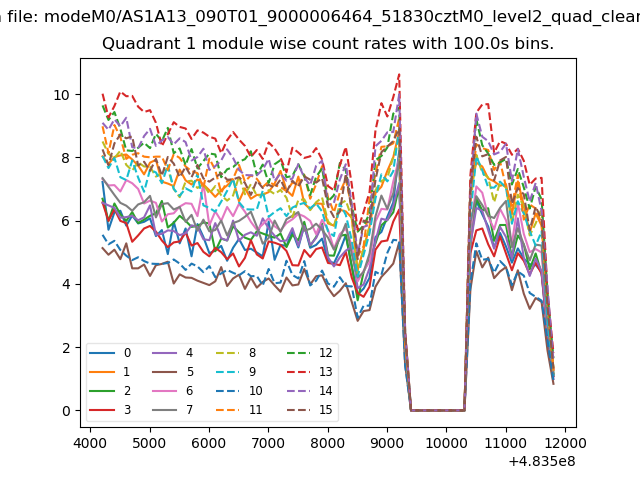
| Module-wise count rates for Quadrant A Data is divided into 100 sec bins |
 |
 |
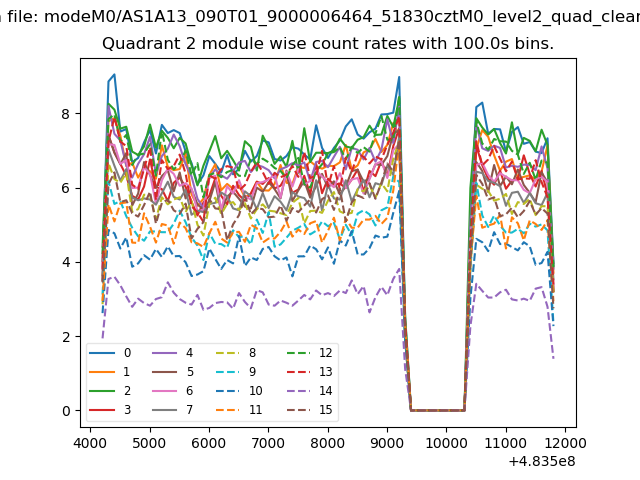
| Module-wise count rates for Quadrant B Data is divided into 100 sec bins |
 |
 |
| Module-wise count rates for Quadrant C Data is divided into 100 sec bins |
 |
 |
| Module-wise count rates for Quadrant D Data is divided into 100 sec bins |
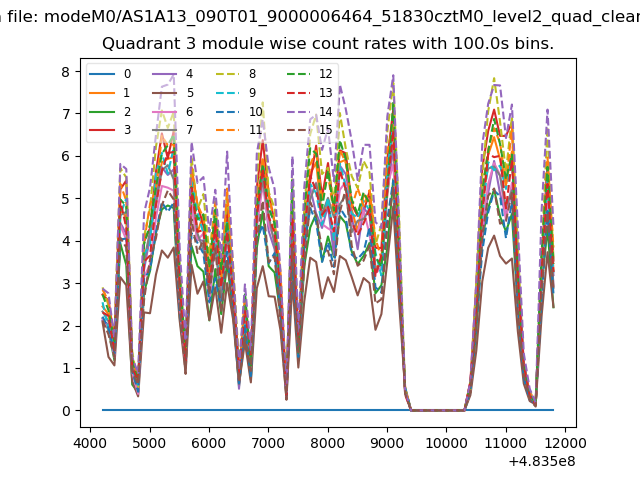 |
 |
| Parameter | Plot |
|---|---|
| CZT HV Monitor | 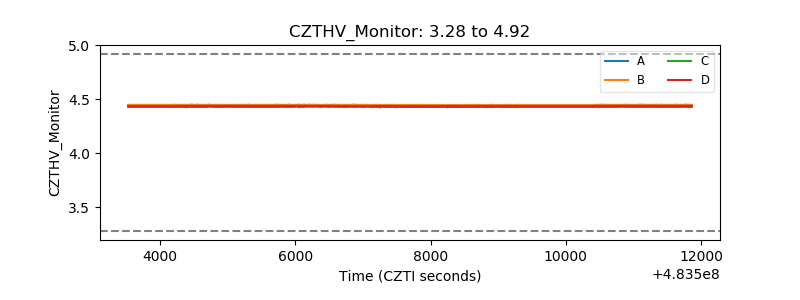 |
| D_VDD | 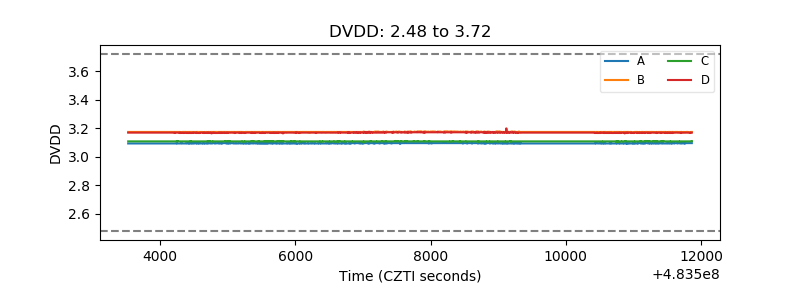 |
| Temperature 1 | 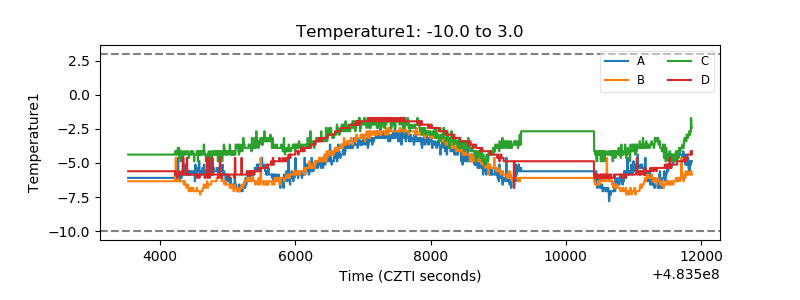 |
| Veto HV Monitor | 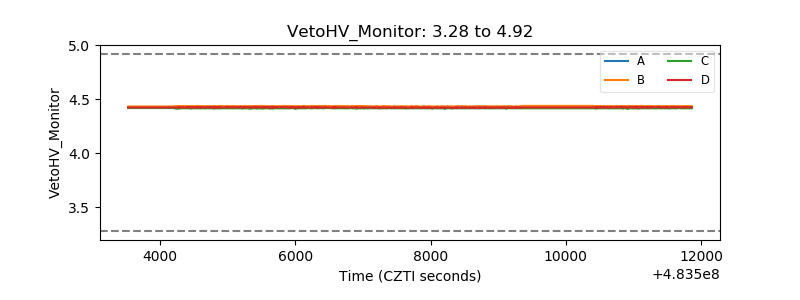 |
| Veto LLD | 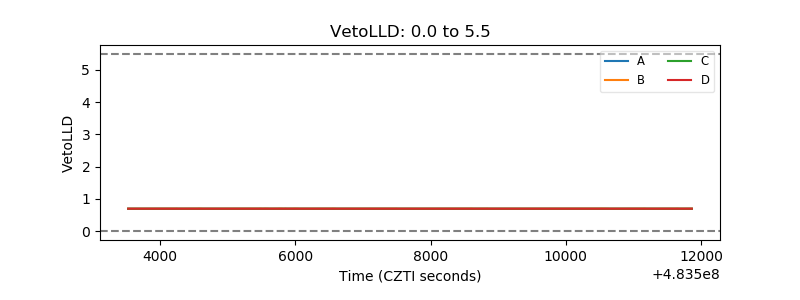 |
| Alpha Counter | 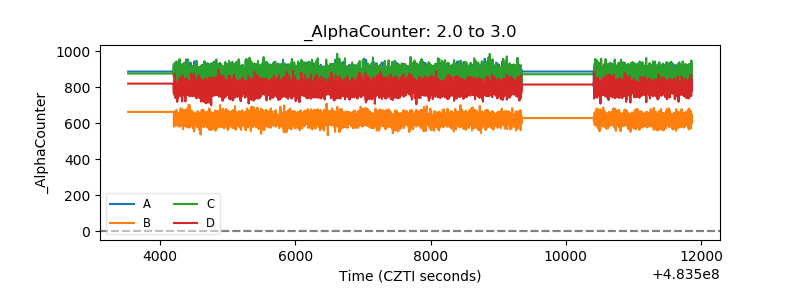 |
| _CPM_Rate | 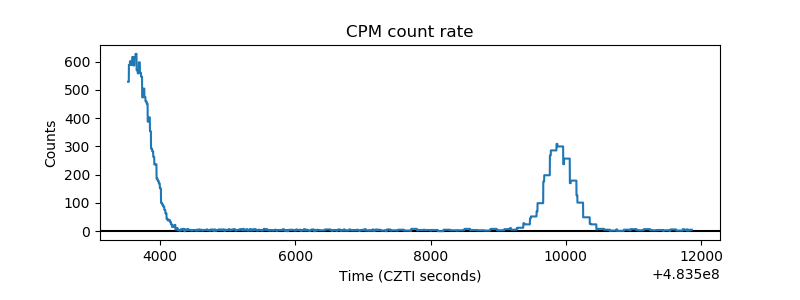 |
| CZT Counter | 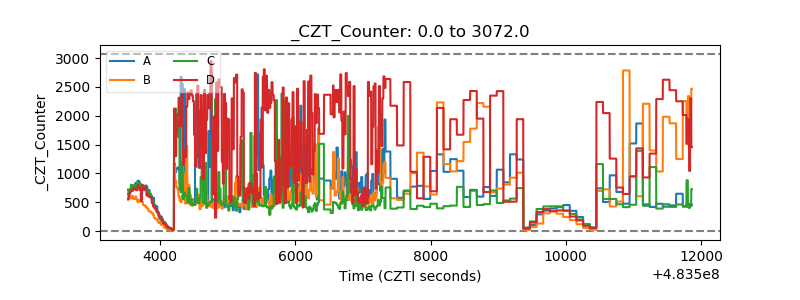 |
| +2.5 Volts monitor | 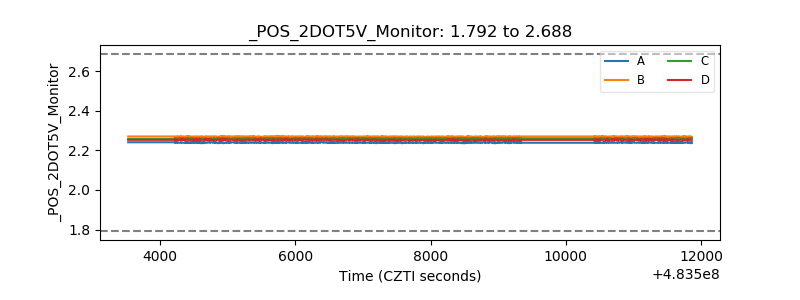 |
| +5 Volts monitor | 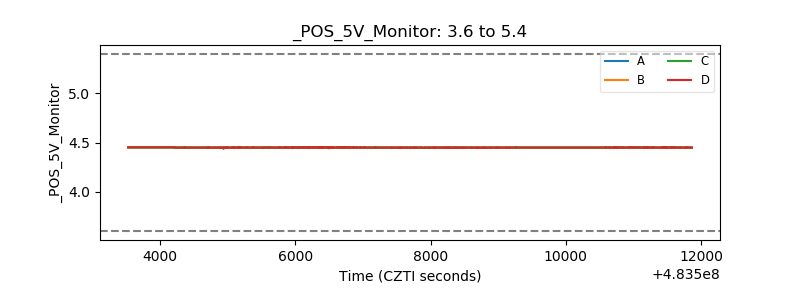 |
| _ROLL_ROT | 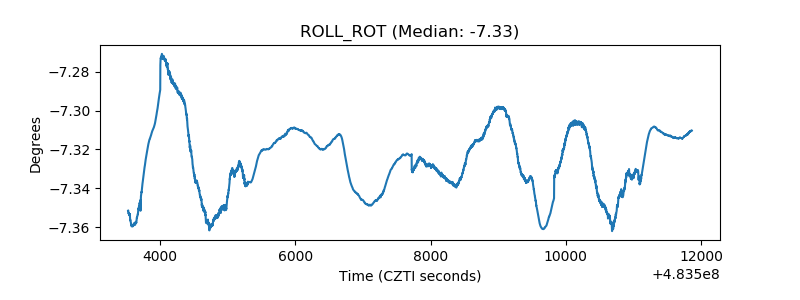 |
| _Roll_DEC | 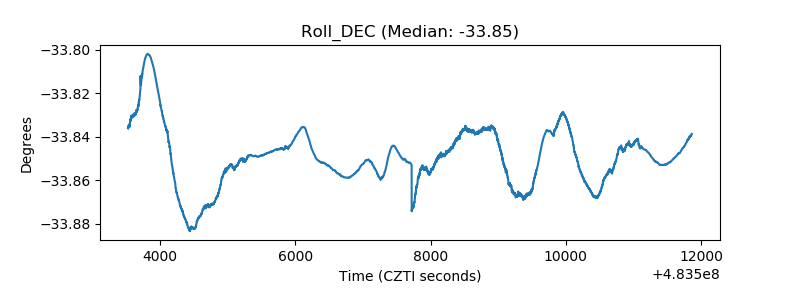 |
| _Roll_RA | 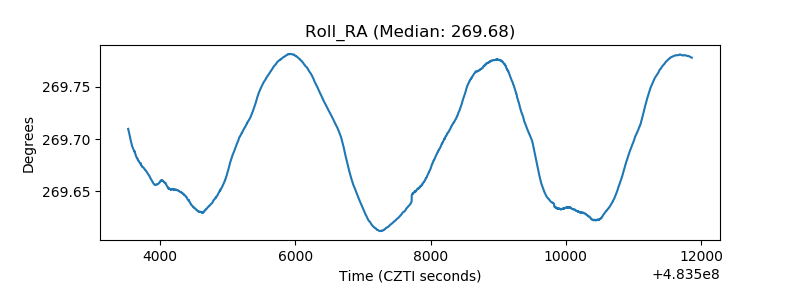 |
| Veto Counter | 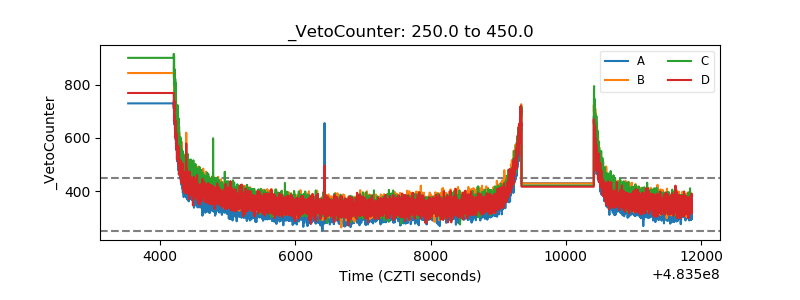 |