| Param | Original file | Final file |
|---|---|---|
| Filename | modeM0/AS1A13_090T01_9000006464_51831cztM0_level2.fits | modeM0/AS1A13_090T01_9000006464_51831cztM0_level2_quad_clean.evt |
| Size (bytes) | 759,582,720 | 75,320,640 |
| Size | 724.4 MB | 71.8 MB |
| Events in quadrant A | 4,700,435 | 554,810 |
| Events in quadrant B | 7,706,331 | 506,602 |
| Events in quadrant C | 3,708,760 | 547,865 |
| Events in quadrant D | 11,528,642 | 244,486 |
| Mode M9 | |||
|---|---|---|---|
| Quadrant | BADHDUFLAG | Total packets | Discarded packets |
| A | 0 | 9 | 0 |
| B | 0 | 9 | 0 |
| C | 0 | 9 | 0 |
| D | 0 | 9 | 0 |
| Mode SS | |||
|---|---|---|---|
| Quadrant | BADHDUFLAG | Total packets | Discarded packets |
| A | 0 | 124 | 0 |
| B | 0 | 124 | 0 |
| C | 0 | 124 | 0 |
| D | 0 | 124 | 0 |
| Mode M0 | |||
|---|---|---|---|
| Quadrant | BADHDUFLAG | Total packets | Discarded packets |
| A | 0 | 18173 | 1 |
| B | 0 | 27124 | 1 |
| C | 0 | 15363 | 1 |
| D | 0 | 38452 | 1 |
| Quadrant | Total seconds | Saturated seconds | Saturation percentage |
|---|---|---|---|
| A | 6109 | 333 | 5.450974% |
| B | 6109 | 1530 | 25.045016% |
| C | 6109 | 249 | 4.075954% |
| D | 6110 | 3506 | 57.381342% |
Noise dominated data is calculated using 1-second bins in cleaned event files. If a bin has >2000 counts, and if more than 50% of those come from <1% of pixels, then it is considered to be noise-dominated and hence unusable.
| Quadrant | # 1 sec bins | Bins with >0 counts | Bins with >2000 counts | High rate bins dominated by noise | Noise dominated (total time) | Noise dominated (detector-on time) | Marked lightcurve |
|---|---|---|---|---|---|---|---|
| A | 6984 | 6110 | 155 | 155 | 2.22% | 2.54% | 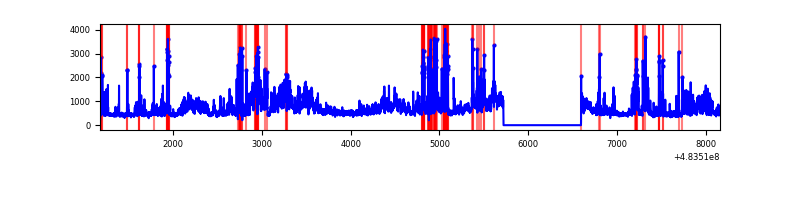 |
| B | 6984 | 6110 | 1107 | 1107 | 15.85% | 18.12% | 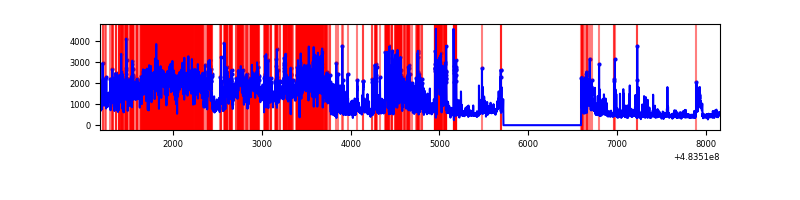 |
| C | 6984 | 6110 | 141 | 141 | 2.02% | 2.31% |  |
| D | 6984 | 6110 | 3047 | 3047 | 43.63% | 49.87% | 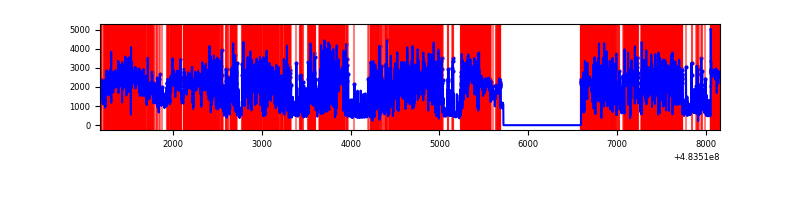 |
Top three noisy pixels from each quadrant. If the there are fewer than three noisy pixels in the level2.evt file, extra rows are filled as -1
| Pixel properties | Quadrant properties | ||||||
|---|---|---|---|---|---|---|---|
| Quadrant | DetID | PixID | Counts | Sigma | Mean | Median | Sigma |
| A | 12 | 3 | 909607 | 5610.87 | 658 | 641 | 162.0 |
| A | 15 | 174 | 500872 | 3087.83 | 658 | 641 | 162.0 |
| A | 5 | 240 | 267055 | 1644.52 | 658 | 641 | 162.0 |
| B | 15 | 54 | 2891544 | 21912.07 | 617 | 595 | 131.9 |
| B | 4 | 206 | 692607 | 5245.13 | 617 | 595 | 131.9 |
| B | 1 | 223 | 305647 | 2312.15 | 617 | 595 | 131.9 |
| C | 0 | 192 | 323713 | 1815.9 | 651 | 647 | 177.9 |
| C | 12 | 254 | 186781 | 1046.23 | 651 | 647 | 177.9 |
| C | 0 | 176 | 135470 | 757.82 | 651 | 647 | 177.9 |
| D | 11 | 129 | 8556349 | 65714.58 | 457 | 440 | 130.2 |
| D | 8 | 176 | 557230 | 4276.49 | 457 | 440 | 130.2 |
| D | 12 | 6 | 296731 | 2275.69 | 457 | 440 | 130.2 |
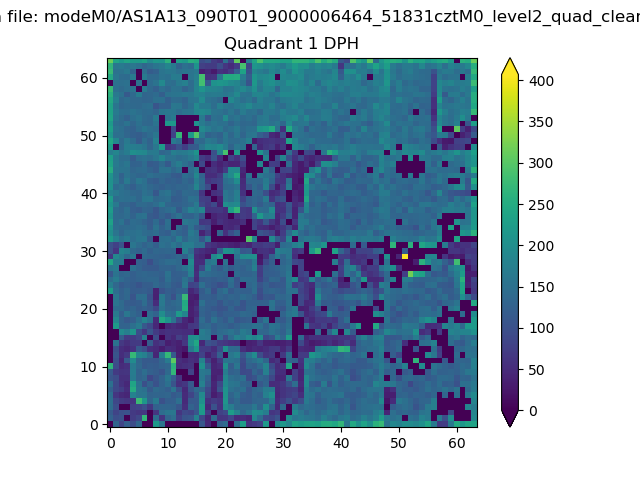
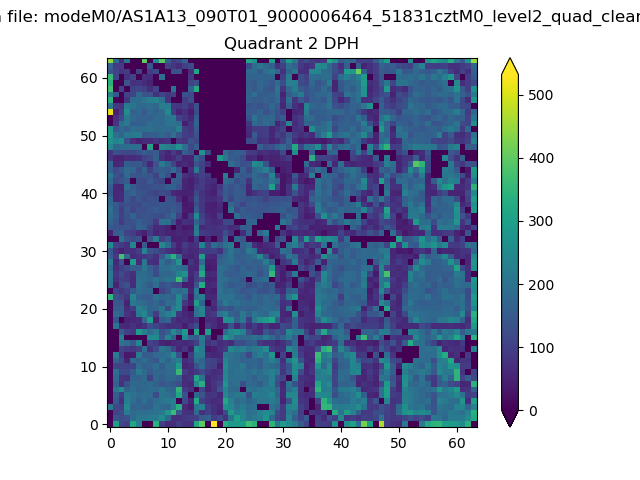
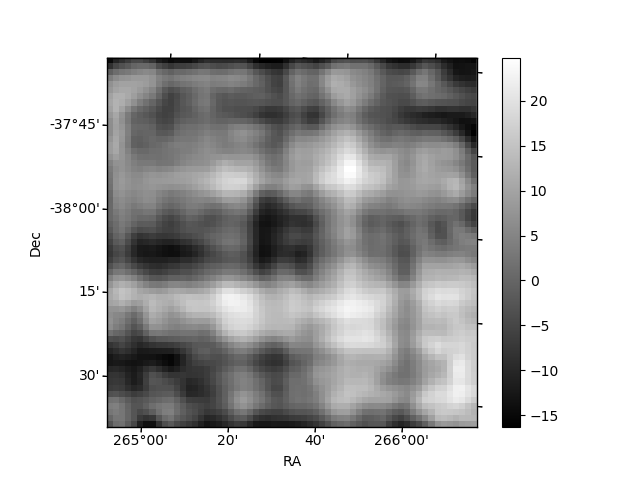
Histogram calculated using DETX and DETY for each event in the final _common_clean file
| Quadrant A | 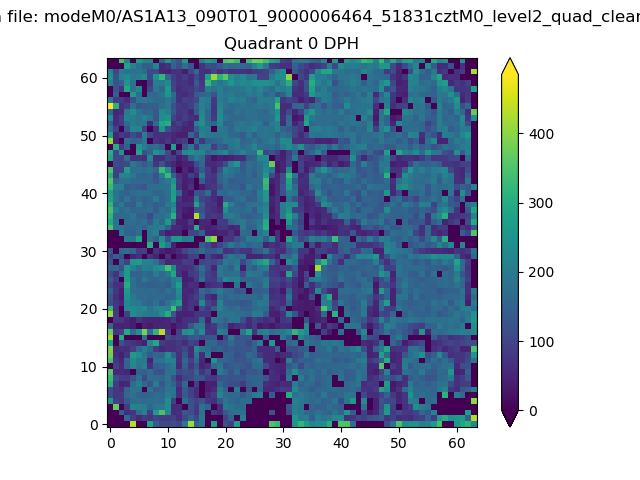 |
 |
Quadrant B |
|---|---|---|---|
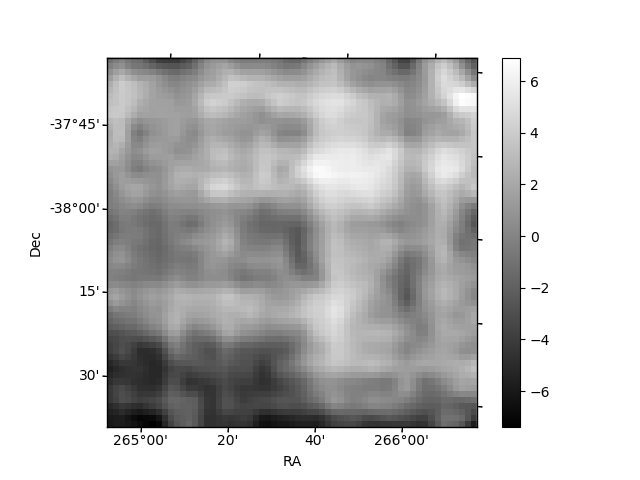
| Quadrant D | 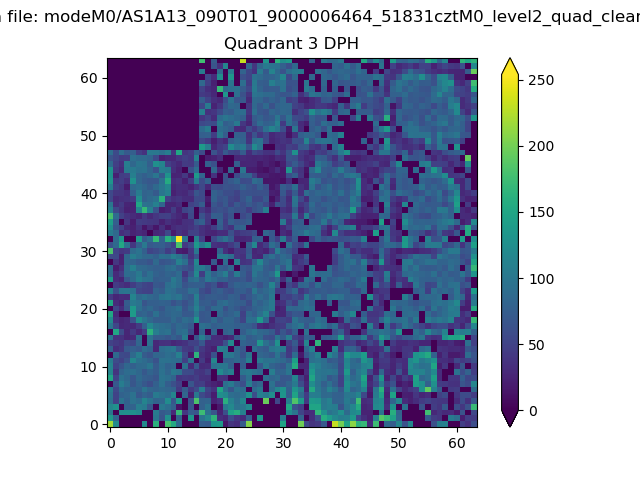 |
 |
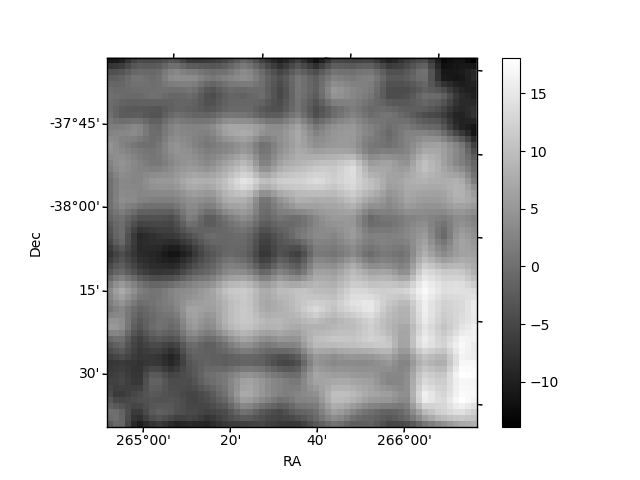
Quadrant C |
| Plot type | Count rate plots | Images |
|---|---|---|
| Comparison with Poisson distribution Blue bars denote a histogram of data divided into 1 sec bins. Red curve is a Poisson curve with rate = median count rate of data. |
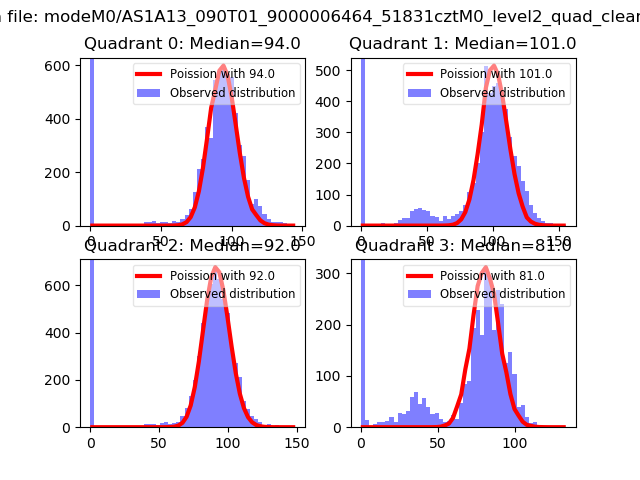 |
 |
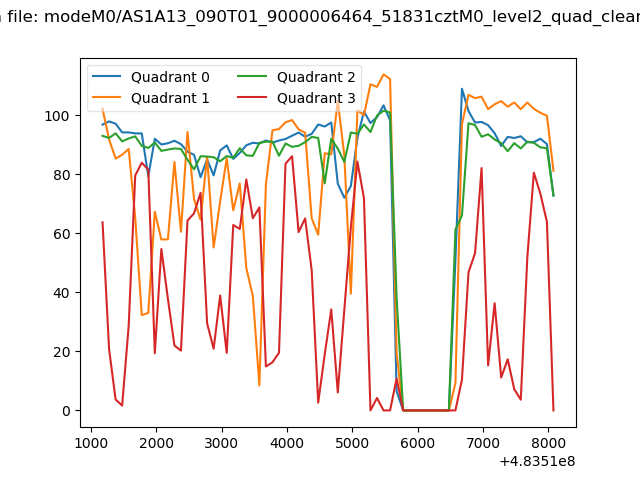
| Quadrant-wise count rates Data is divided into 100 sec bins |
 |
|
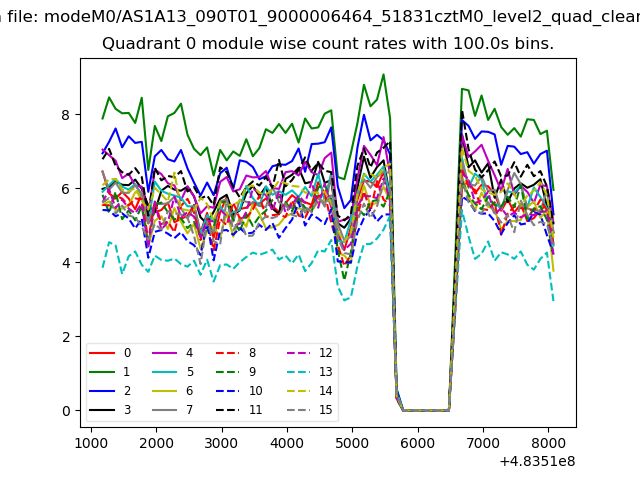
| Module-wise count rates for Quadrant A Data is divided into 100 sec bins |
 |
 |
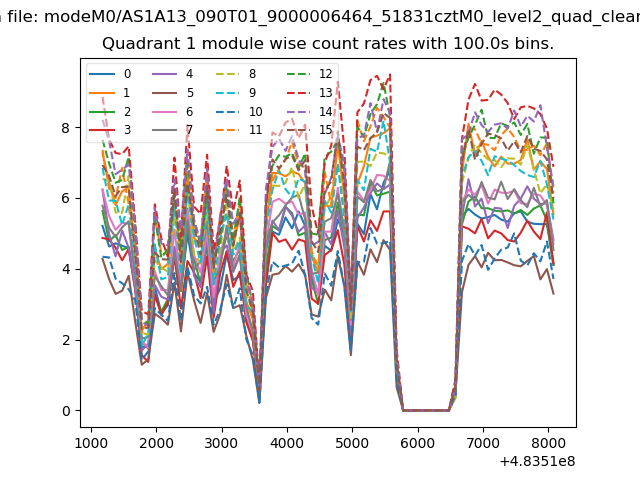
| Module-wise count rates for Quadrant B Data is divided into 100 sec bins |
 |
 |
| Module-wise count rates for Quadrant C Data is divided into 100 sec bins |
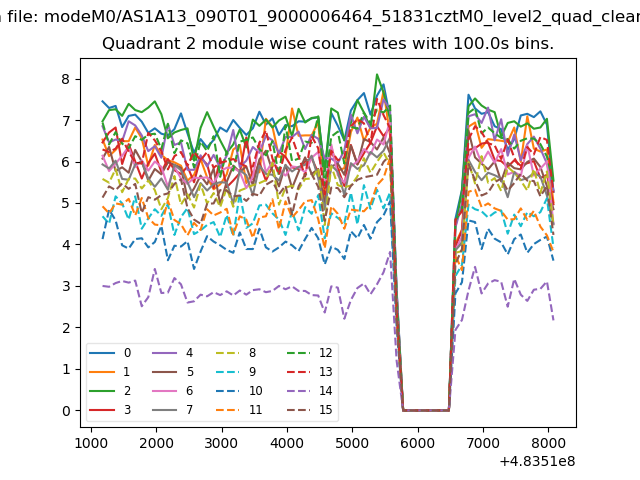 |
 |
| Module-wise count rates for Quadrant D Data is divided into 100 sec bins |
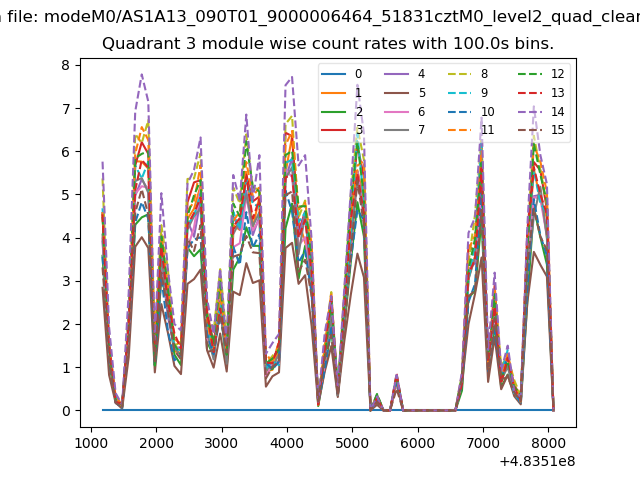 |
 |
| Parameter | Plot |
|---|---|
| CZT HV Monitor | 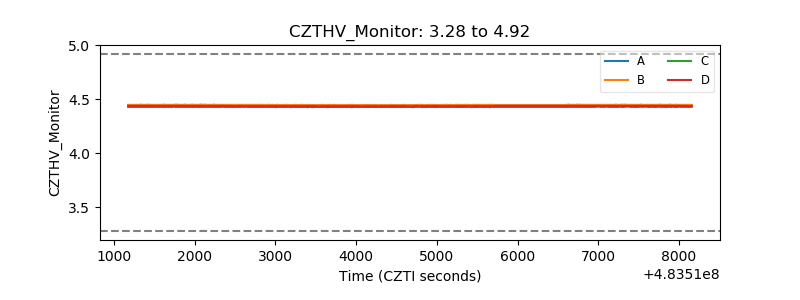 |
| D_VDD | 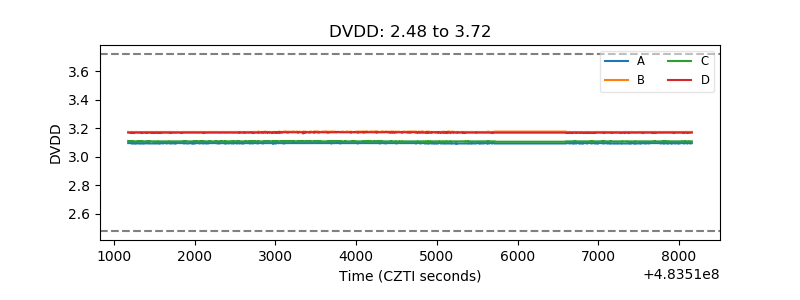 |
| Temperature 1 | 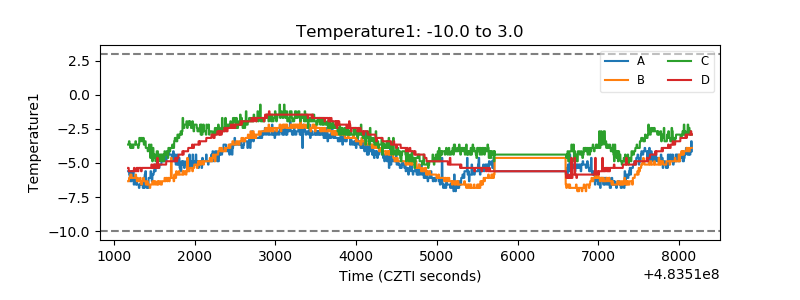 |
| Veto HV Monitor | 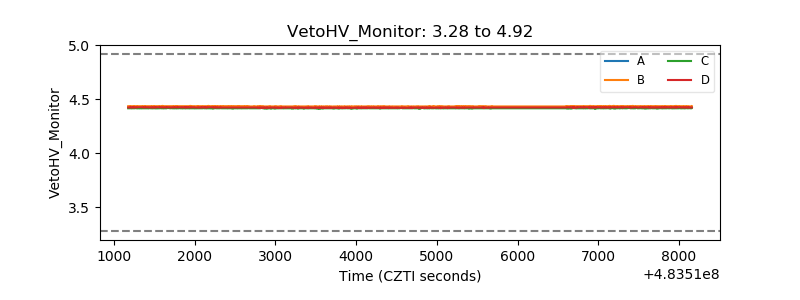 |
| Veto LLD | 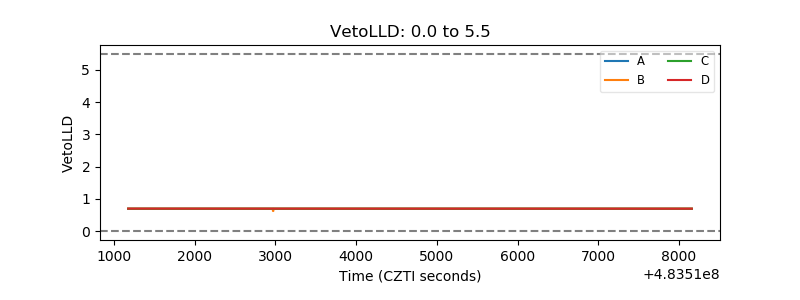 |
| Alpha Counter | 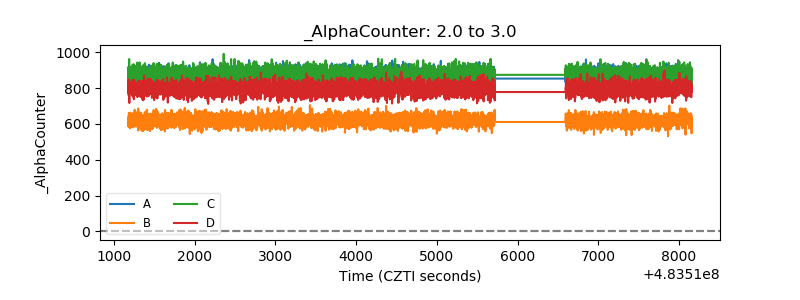 |
| _CPM_Rate | 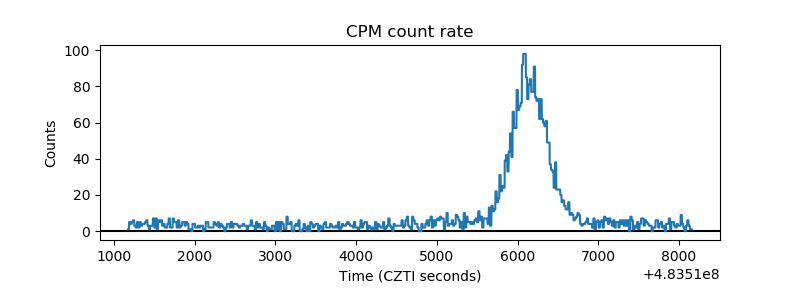 |
| CZT Counter | 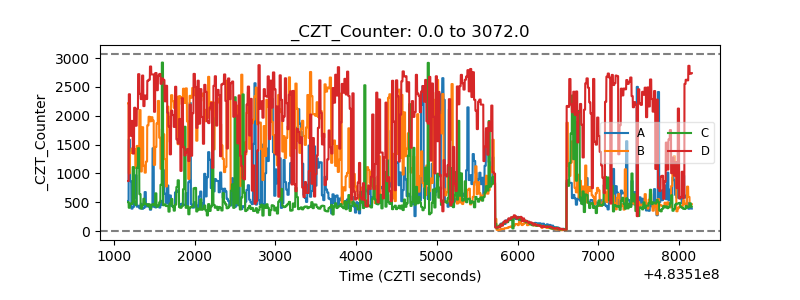 |
| +2.5 Volts monitor | 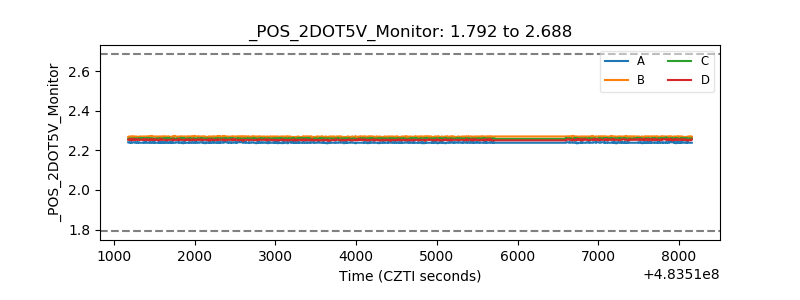 |
| +5 Volts monitor | 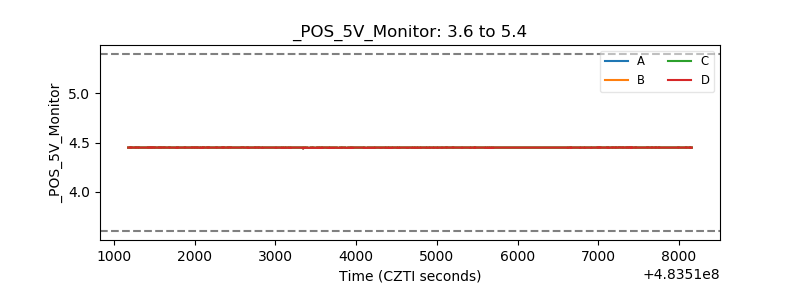 |
| _ROLL_ROT | 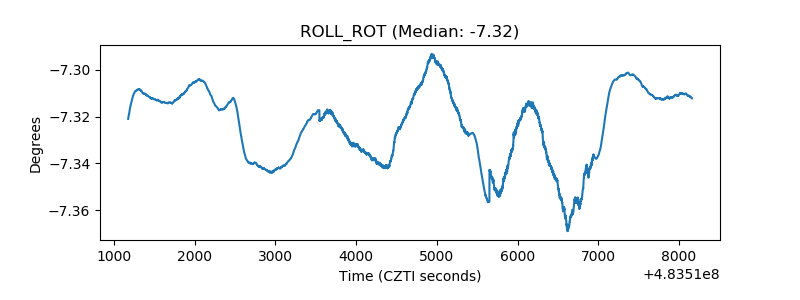 |
| _Roll_DEC | 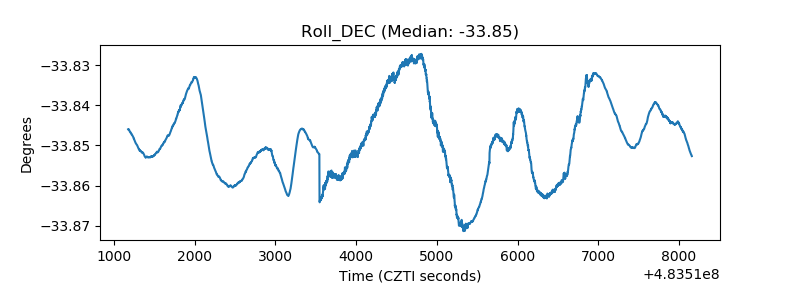 |
| _Roll_RA | 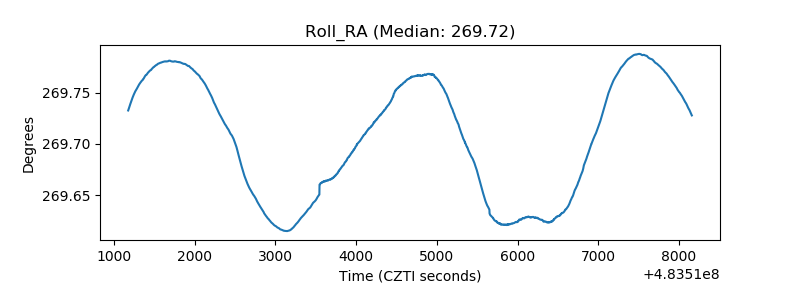 |
| Veto Counter | 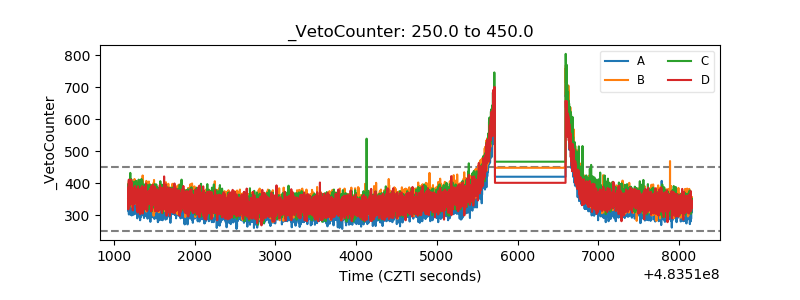 |