| Param | Original file | Final file |
|---|---|---|
| Filename | modeM0/AS1A13_090T01_9000006464_51832cztM0_level2.fits | modeM0/AS1A13_090T01_9000006464_51832cztM0_level2_quad_clean.evt |
| Size (bytes) | 406,278,720 | 48,142,080 |
| Size | 387.5 MB | 45.9 MB |
| Events in quadrant A | 2,340,084 | 342,315 |
| Events in quadrant B | 2,763,053 | 362,023 |
| Events in quadrant C | 2,412,454 | 332,860 |
| Events in quadrant D | 7,229,042 | 153,145 |
| Mode SS | |||
|---|---|---|---|
| Quadrant | BADHDUFLAG | Total packets | Discarded packets |
| A | 0 | 76 | 0 |
| B | 0 | 76 | 0 |
| C | 0 | 76 | 0 |
| D | 0 | 76 | 0 |
| Mode M0 | |||
|---|---|---|---|
| Quadrant | BADHDUFLAG | Total packets | Discarded packets |
| A | 0 | 9473 | 0 |
| B | 0 | 10841 | 0 |
| C | 0 | 9917 | 0 |
| D | 0 | 24068 | 0 |
| Quadrant | Total seconds | Saturated seconds | Saturation percentage |
|---|---|---|---|
| A | 3779 | 48 | 1.270177% |
| B | 3779 | 201 | 5.318867% |
| C | 3779 | 126 | 3.334215% |
| D | 3779 | 2136 | 56.522890% |
Noise dominated data is calculated using 1-second bins in cleaned event files. If a bin has >2000 counts, and if more than 50% of those come from <1% of pixels, then it is considered to be noise-dominated and hence unusable.
| Quadrant | # 1 sec bins | Bins with >0 counts | Bins with >2000 counts | High rate bins dominated by noise | Noise dominated (total time) | Noise dominated (detector-on time) | Marked lightcurve |
|---|---|---|---|---|---|---|---|
| A | 3779 | 3779 | 36 | 36 | 0.95% | 0.95% | 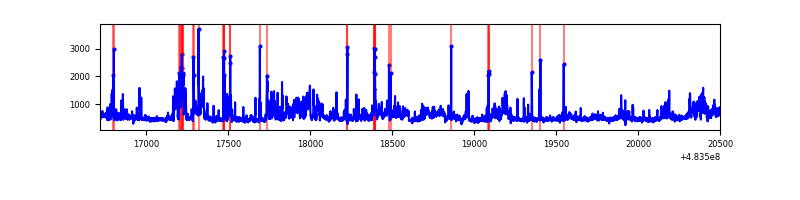 |
| B | 3779 | 3779 | 137 | 137 | 3.63% | 3.63% | 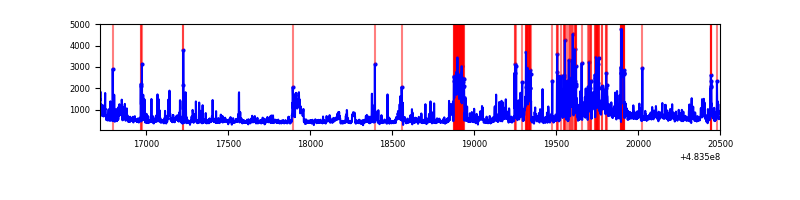 |
| C | 3779 | 3779 | 115 | 115 | 3.04% | 3.04% | 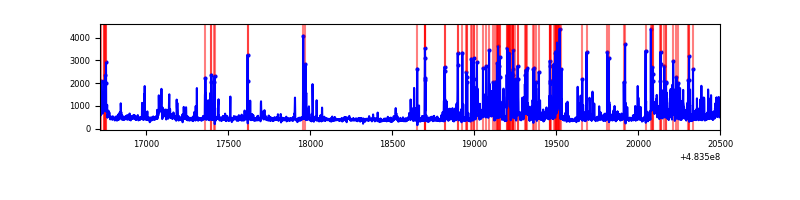 |
| D | 3779 | 3779 | 1895 | 1895 | 50.15% | 50.15% | 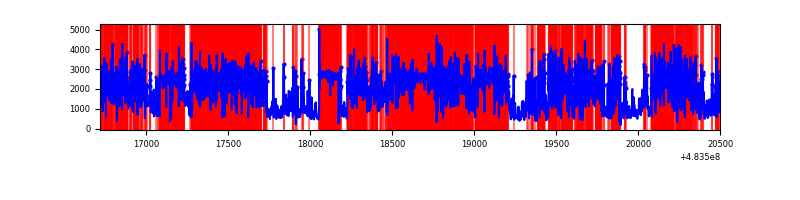 |
Top three noisy pixels from each quadrant. If the there are fewer than three noisy pixels in the level2.evt file, extra rows are filled as -1
| Pixel properties | Quadrant properties | ||||||
|---|---|---|---|---|---|---|---|
| Quadrant | DetID | PixID | Counts | Sigma | Mean | Median | Sigma |
| A | 12 | 3 | 267695 | 2788.33 | 388 | 378 | 95.9 |
| A | 15 | 174 | 140276 | 1459.25 | 388 | 378 | 95.9 |
| A | 3 | 14 | 99614 | 1035.11 | 388 | 378 | 95.9 |
| B | 4 | 206 | 519774 | 6408.29 | 378 | 366 | 81.1 |
| B | 10 | 128 | 200149 | 2464.86 | 378 | 366 | 81.1 |
| B | 5 | 32 | 113807 | 1399.6 | 378 | 366 | 81.1 |
| C | 12 | 254 | 587722 | 5654.32 | 377 | 374 | 103.9 |
| C | 0 | 192 | 98613 | 945.73 | 377 | 374 | 103.9 |
| C | 0 | 176 | 65683 | 628.72 | 377 | 374 | 103.9 |
| D | 11 | 129 | 5533393 | 70986.51 | 277 | 266 | 77.9 |
| D | 8 | 176 | 297181 | 3809.23 | 277 | 266 | 77.9 |
| D | 11 | 176 | 86305 | 1103.83 | 277 | 266 | 77.9 |
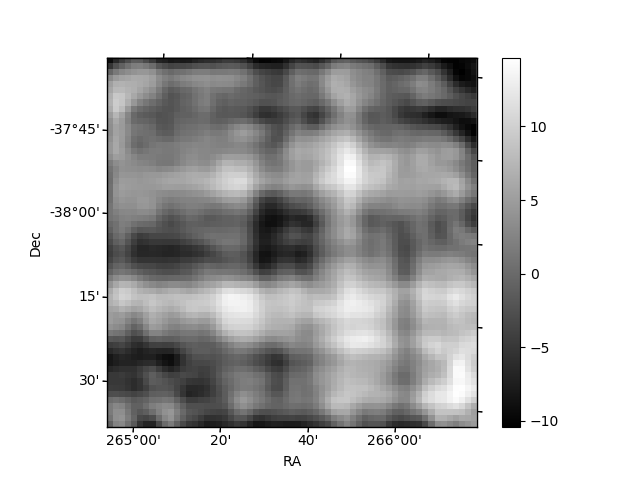
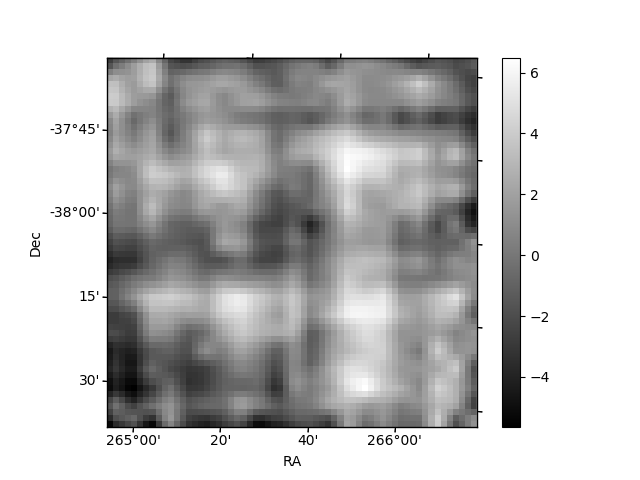
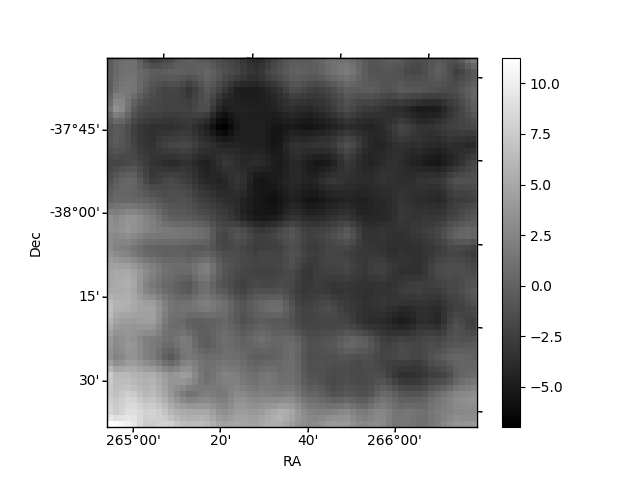
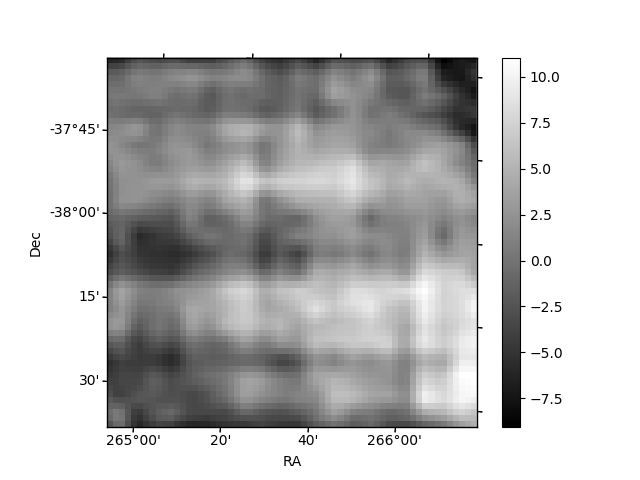
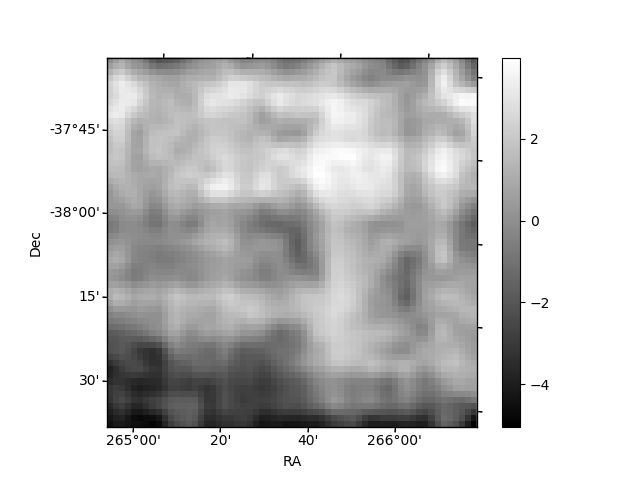
Histogram calculated using DETX and DETY for each event in the final _common_clean file
| Quadrant A | 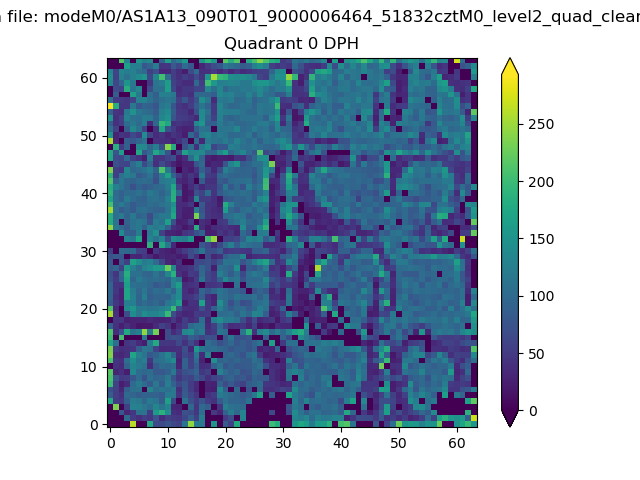 |
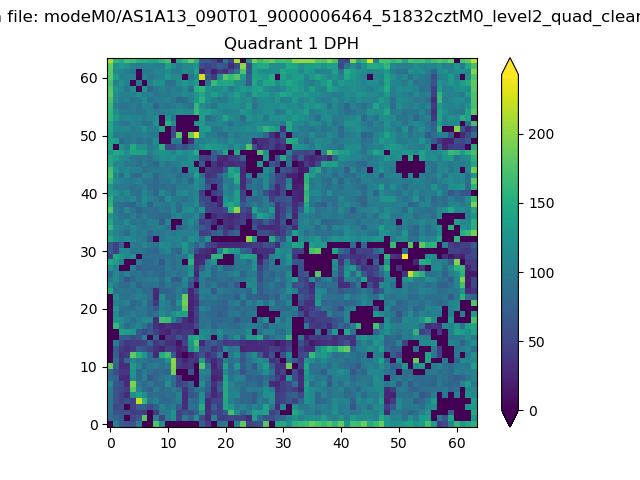 |
Quadrant B |
|---|---|---|---|
| Quadrant D | 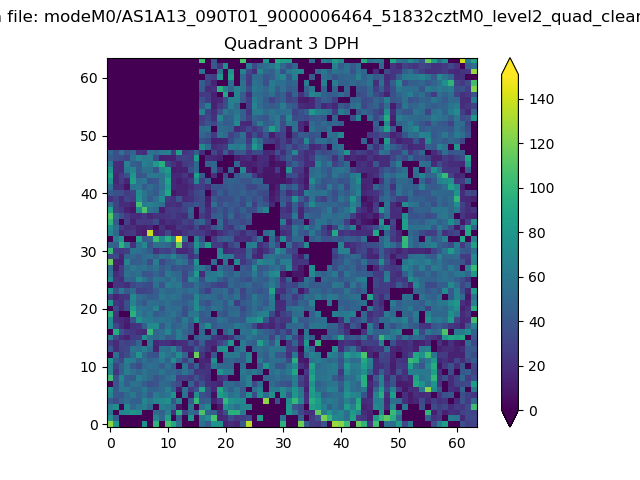 |
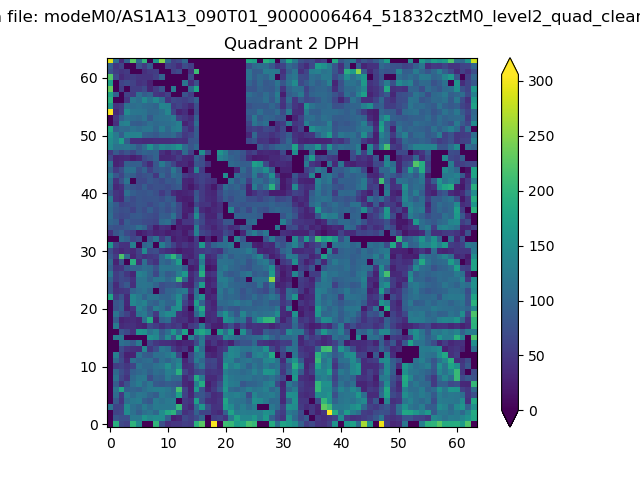 |
Quadrant C |
| Plot type | Count rate plots | Images |
|---|---|---|
| Comparison with Poisson distribution Blue bars denote a histogram of data divided into 1 sec bins. Red curve is a Poisson curve with rate = median count rate of data. |
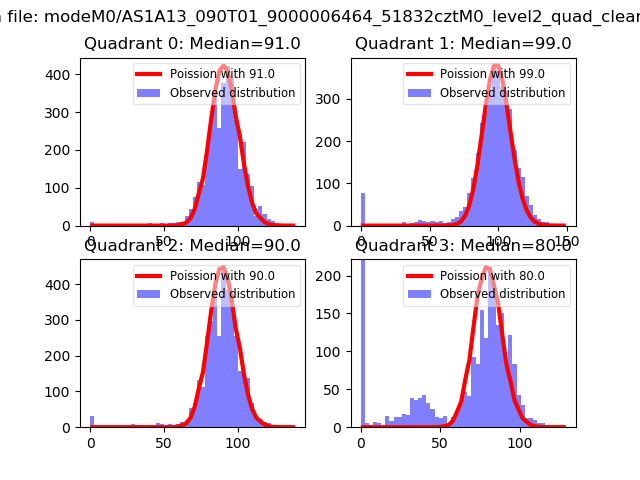 |
 |
| Quadrant-wise count rates Data is divided into 100 sec bins |
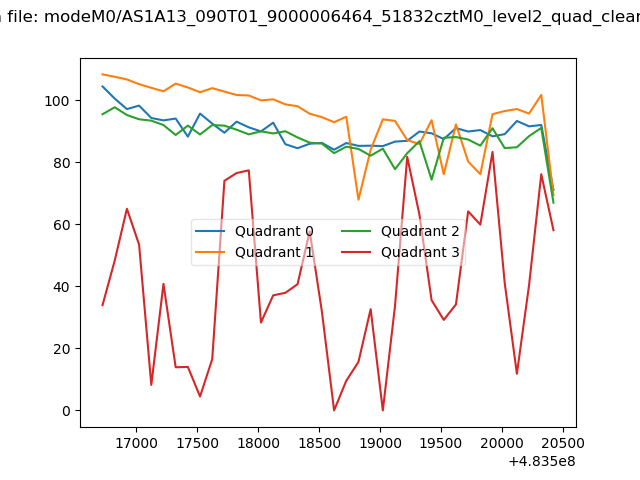 |
|
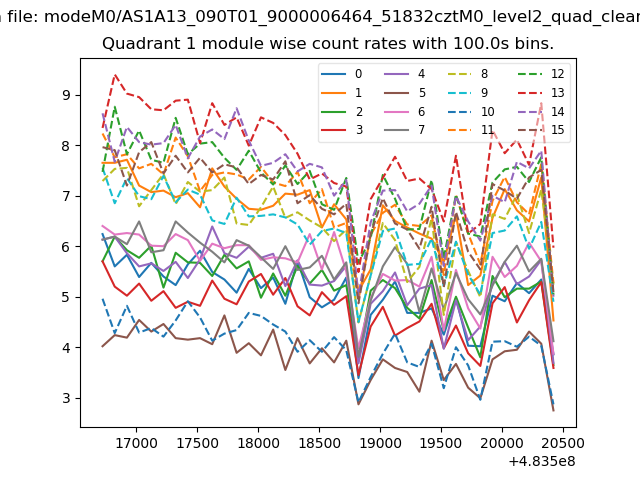
| Module-wise count rates for Quadrant A Data is divided into 100 sec bins |
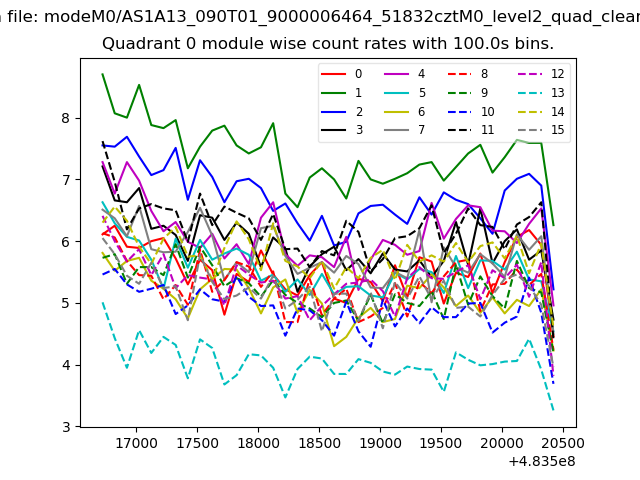 |
 |
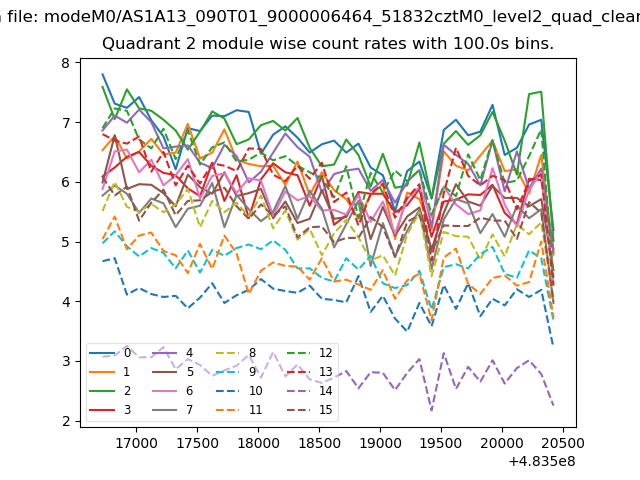
| Module-wise count rates for Quadrant B Data is divided into 100 sec bins |
 |
 |
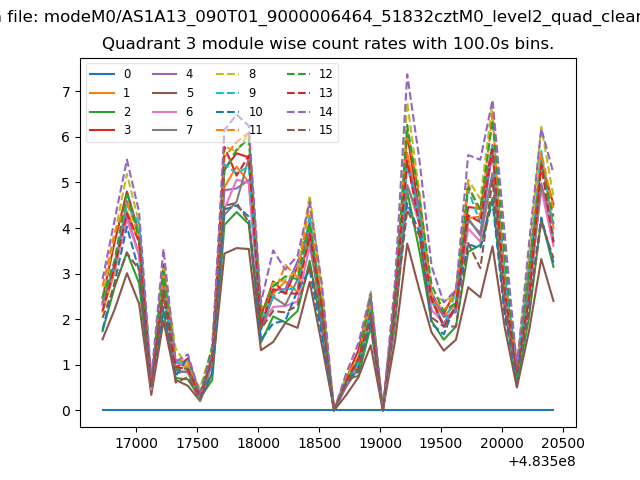
| Module-wise count rates for Quadrant C Data is divided into 100 sec bins |
 |
 |
| Module-wise count rates for Quadrant D Data is divided into 100 sec bins |
 |
 |
| Parameter | Plot |
|---|---|
| CZT HV Monitor | 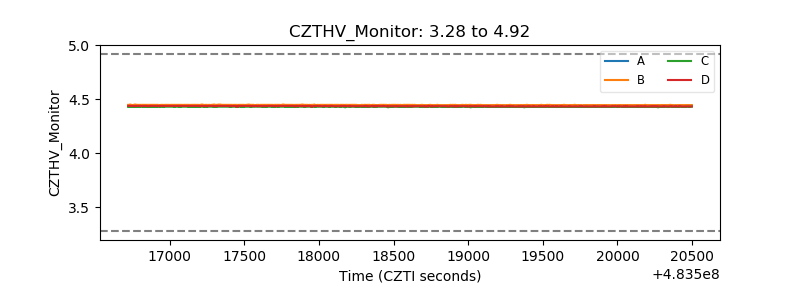 |
| D_VDD | 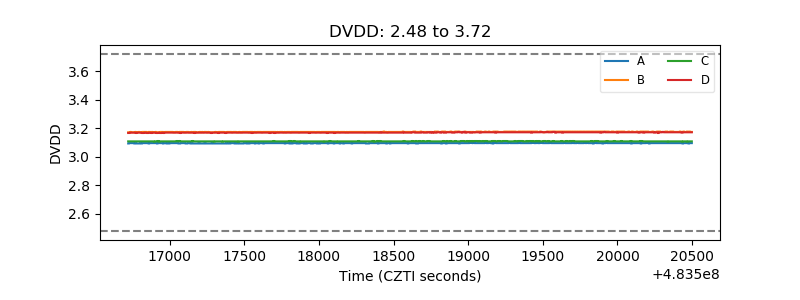 |
| Temperature 1 | 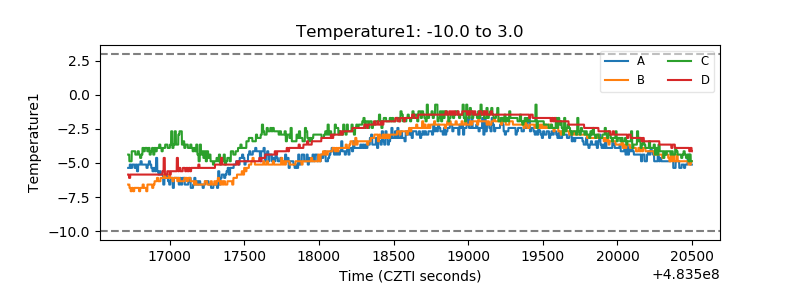 |
| Veto HV Monitor | 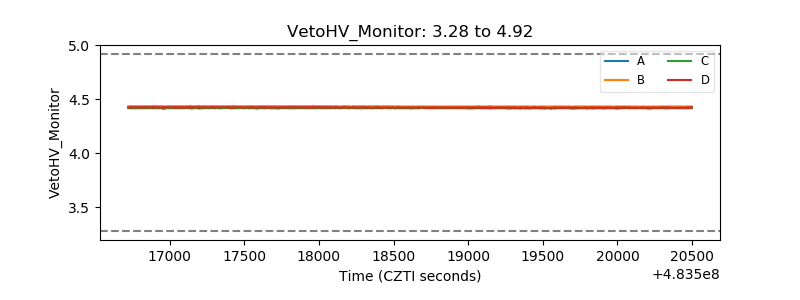 |
| Veto LLD | 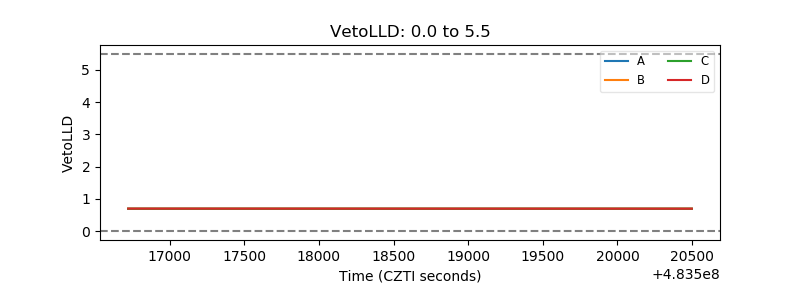 |
| Alpha Counter | 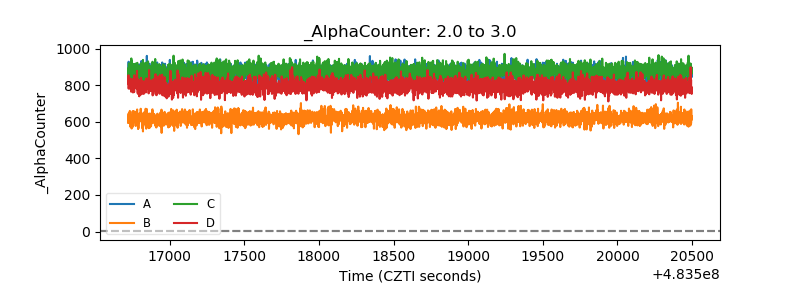 |
| _CPM_Rate | 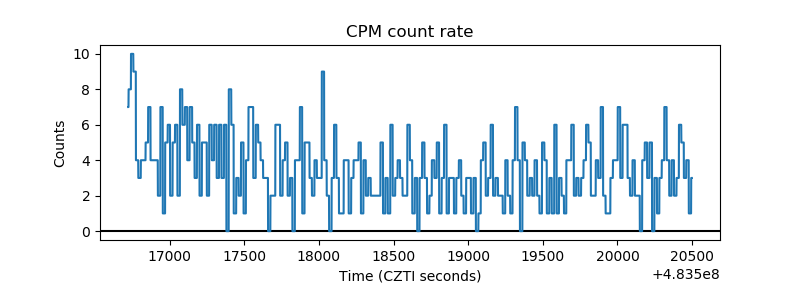 |
| CZT Counter | 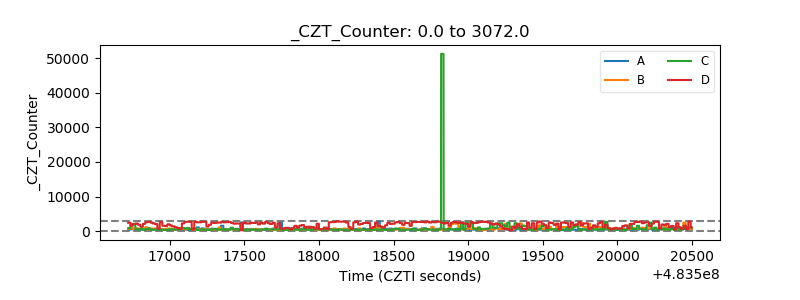 |
| +2.5 Volts monitor | 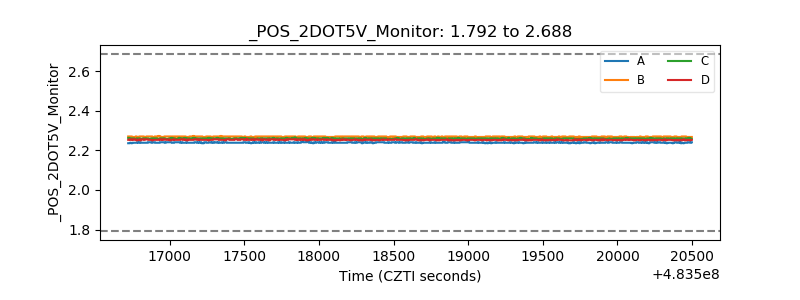 |
| +5 Volts monitor | 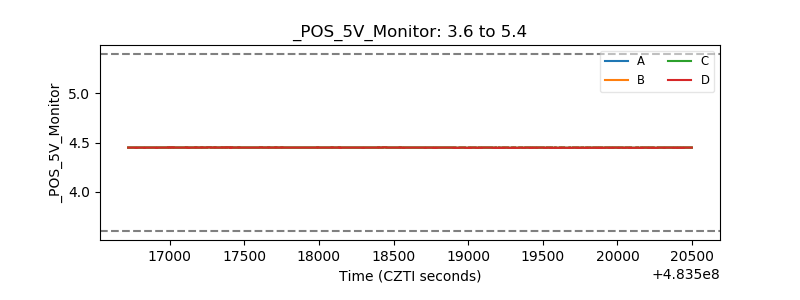 |
| _ROLL_ROT | 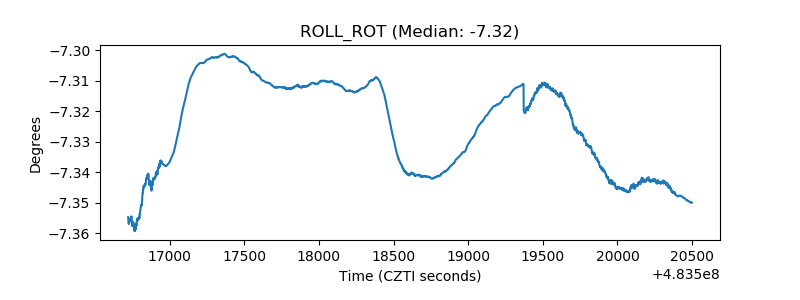 |
| _Roll_DEC | 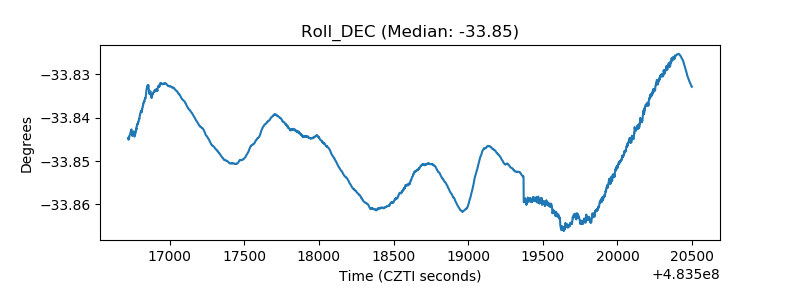 |
| _Roll_RA | 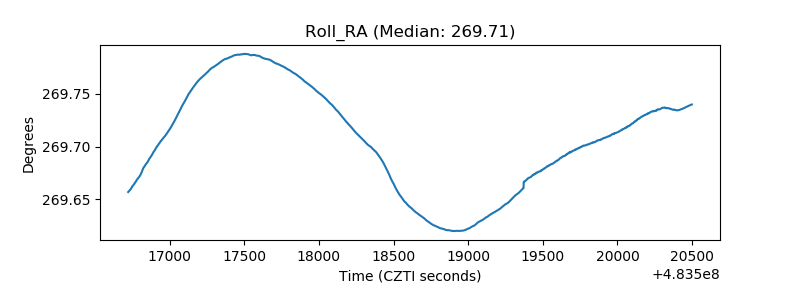 |
| Veto Counter | 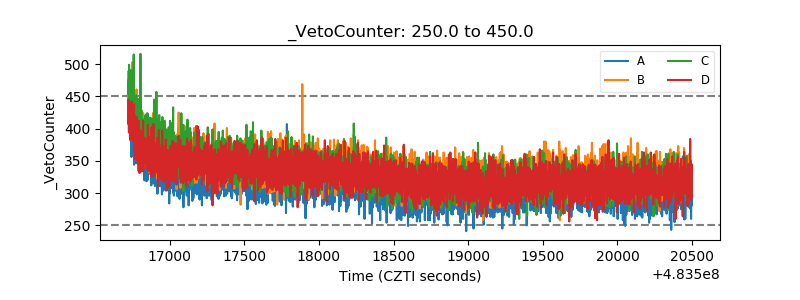 |