| Param | Original file | Final file |
|---|---|---|
| Filename | modeM0/AS1A13_090T01_9000006464_51922cztM0_level2.fits | modeM0/AS1A13_090T01_9000006464_51922cztM0_level2_quad_clean.evt |
| Size (bytes) | 1,095,865,920 | 74,289,600 |
| Size | 1.0 GB | 70.8 MB |
| Events in quadrant A | 13,326,942 | 314,111 |
| Events in quadrant B | 5,345,557 | 666,723 |
| Events in quadrant C | 10,258,683 | 432,509 |
| Events in quadrant D | 11,090,876 | 344,895 |
| Mode SS | |||
|---|---|---|---|
| Quadrant | BADHDUFLAG | Total packets | Discarded packets |
| A | 0 | 140 | 0 |
| B | 0 | 140 | 0 |
| C | 0 | 140 | 0 |
| D | 0 | 140 | 0 |
| Mode M0 | |||
|---|---|---|---|
| Quadrant | BADHDUFLAG | Total packets | Discarded packets |
| A | 0 | 44468 | 0 |
| B | 0 | 20805 | 0 |
| C | 0 | 35338 | 0 |
| D | 0 | 37795 | 0 |
| Quadrant | Total seconds | Saturated seconds | Saturation percentage |
|---|---|---|---|
| A | 7043 | 3851 | 54.678404% |
| B | 7043 | 542 | 7.695584% |
| C | 7043 | 2516 | 35.723413% |
| D | 7043 | 3140 | 44.583274% |
Noise dominated data is calculated using 1-second bins in cleaned event files. If a bin has >2000 counts, and if more than 50% of those come from <1% of pixels, then it is considered to be noise-dominated and hence unusable.
| Quadrant | # 1 sec bins | Bins with >0 counts | Bins with >2000 counts | High rate bins dominated by noise | Noise dominated (total time) | Noise dominated (detector-on time) | Marked lightcurve |
|---|---|---|---|---|---|---|---|
| A | 7043 | 7043 | 3743 | 3743 | 53.14% | 53.14% | 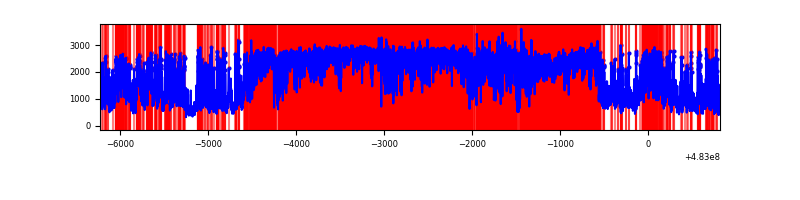 |
| B | 7043 | 7043 | 351 | 351 | 4.98% | 4.98% | 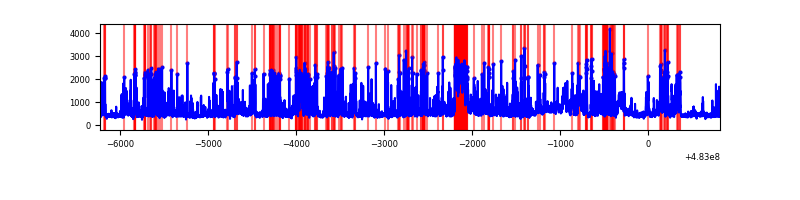 |
| C | 7043 | 7043 | 2318 | 2318 | 32.91% | 32.91% | 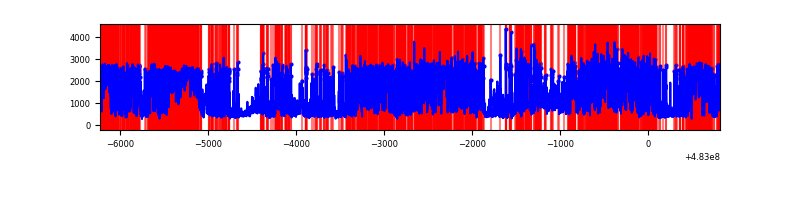 |
| D | 7043 | 7043 | 2892 | 2892 | 41.06% | 41.06% | 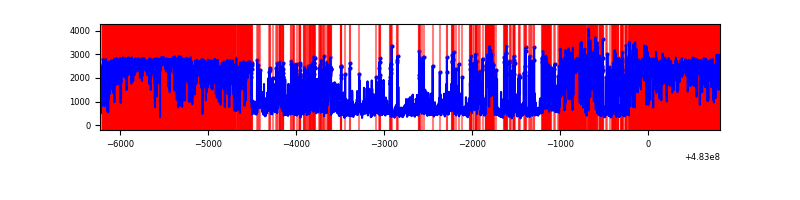 |
Top three noisy pixels from each quadrant. If the there are fewer than three noisy pixels in the level2.evt file, extra rows are filled as -1
| Pixel properties | Quadrant properties | ||||||
|---|---|---|---|---|---|---|---|
| Quadrant | DetID | PixID | Counts | Sigma | Mean | Median | Sigma |
| A | 8 | 248 | 8375147 | 59745.23 | 564 | 551 | 140.2 |
| A | 3 | 95 | 605897 | 4318.6 | 564 | 551 | 140.2 |
| A | 12 | 3 | 559005 | 3984.07 | 564 | 551 | 140.2 |
| B | 5 | 185 | 649821 | 4309.5 | 710 | 686 | 150.6 |
| B | 12 | 32 | 557245 | 3694.9 | 710 | 686 | 150.6 |
| B | 10 | 44 | 303066 | 2007.45 | 710 | 686 | 150.6 |
| C | 15 | 224 | 5601344 | 34355.96 | 595 | 590 | 163.0 |
| C | 15 | 158 | 606504 | 3716.78 | 595 | 590 | 163.0 |
| C | 13 | 3 | 305845 | 1872.49 | 595 | 590 | 163.0 |
| D | 12 | 17 | 5186943 | 35832.95 | 506 | 484 | 144.7 |
| D | 6 | 42 | 1256105 | 8675.01 | 506 | 484 | 144.7 |
| D | 7 | 60 | 384403 | 2652.47 | 506 | 484 | 144.7 |
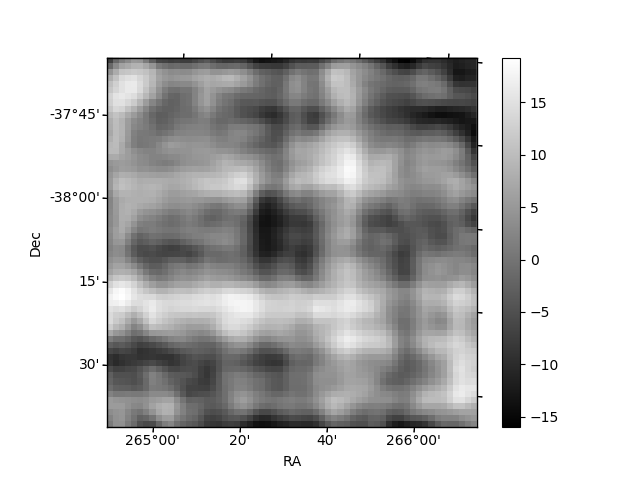
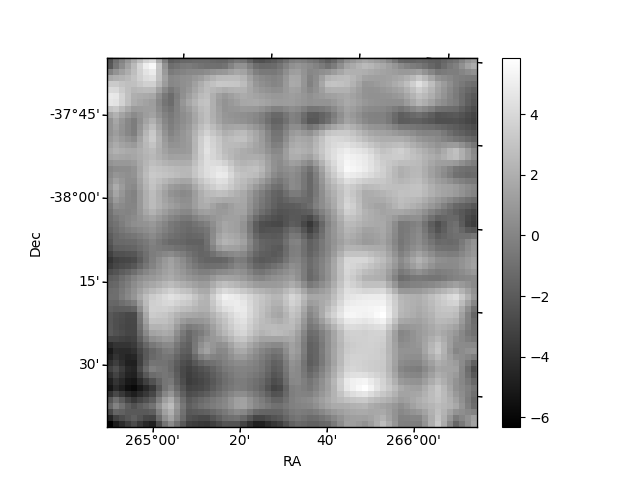
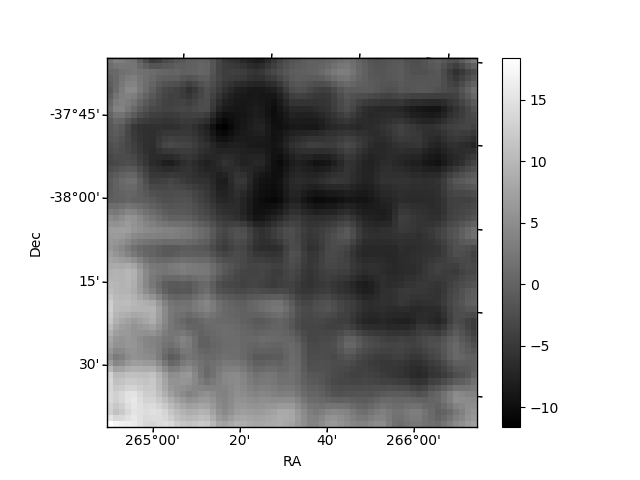
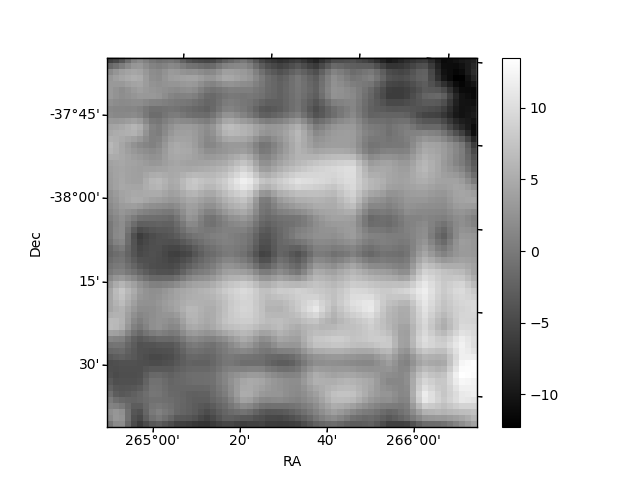
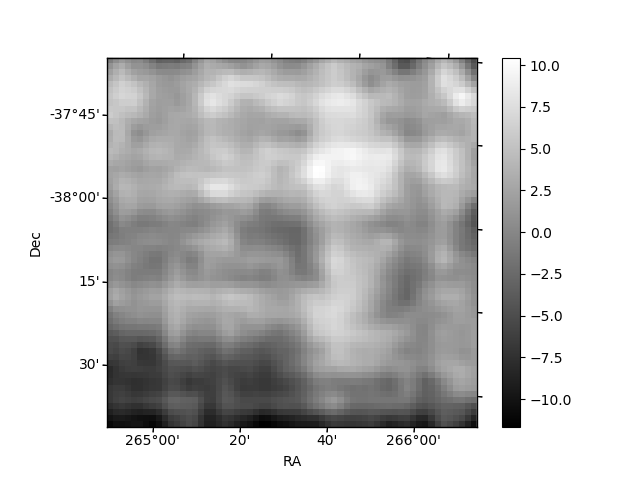
Histogram calculated using DETX and DETY for each event in the final _common_clean file
| Quadrant A | 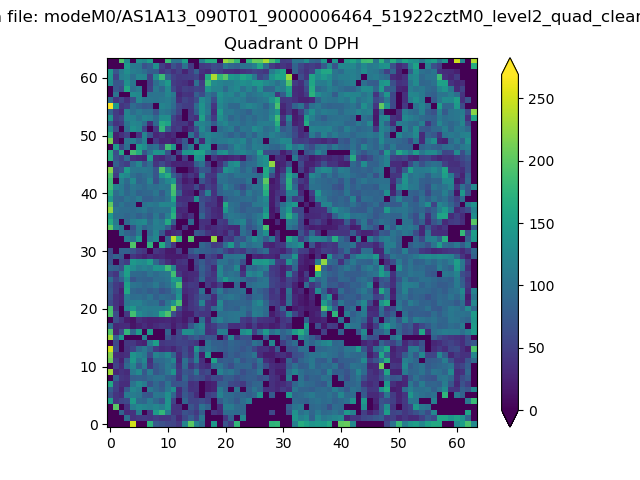 |
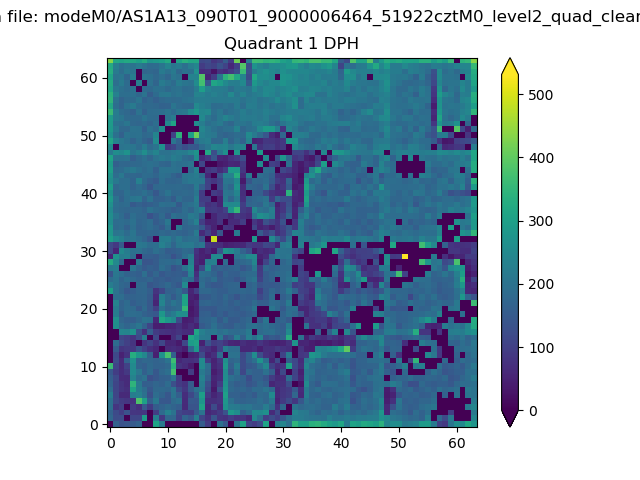 |
Quadrant B |
|---|---|---|---|
| Quadrant D | 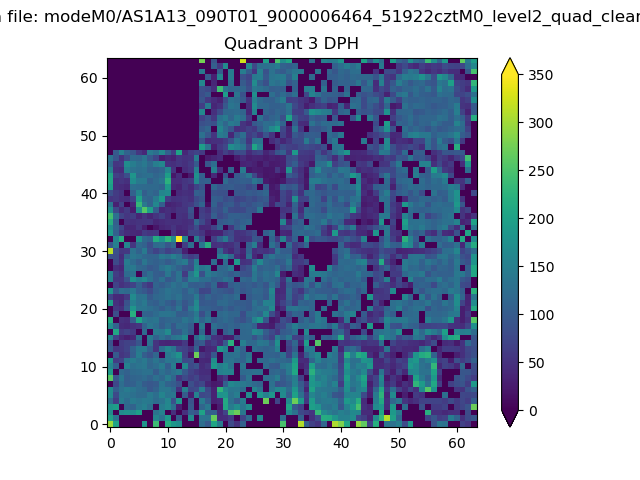 |
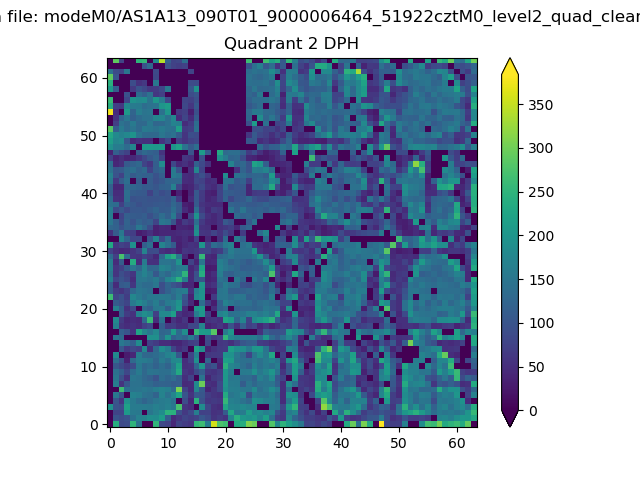 |
Quadrant C |
| Plot type | Count rate plots | Images |
|---|---|---|
| Comparison with Poisson distribution Blue bars denote a histogram of data divided into 1 sec bins. Red curve is a Poisson curve with rate = median count rate of data. |
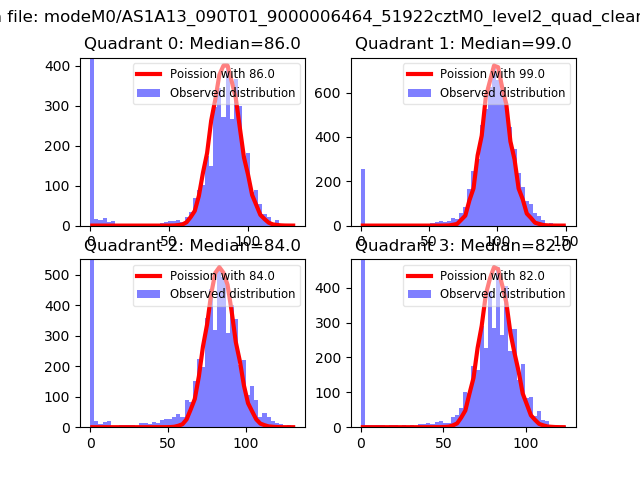 |
 |
| Quadrant-wise count rates Data is divided into 100 sec bins |
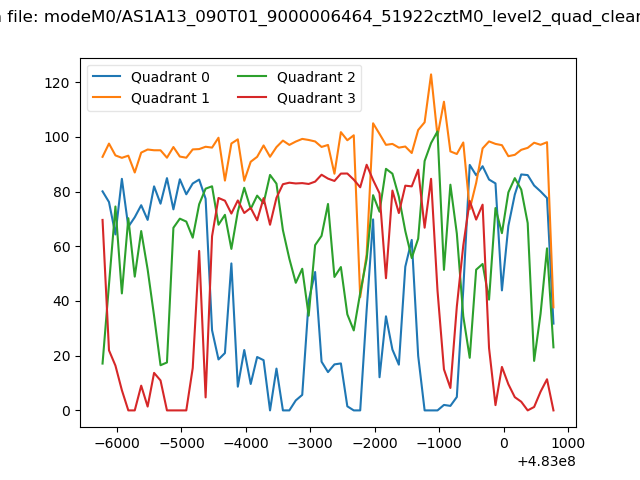 |
|
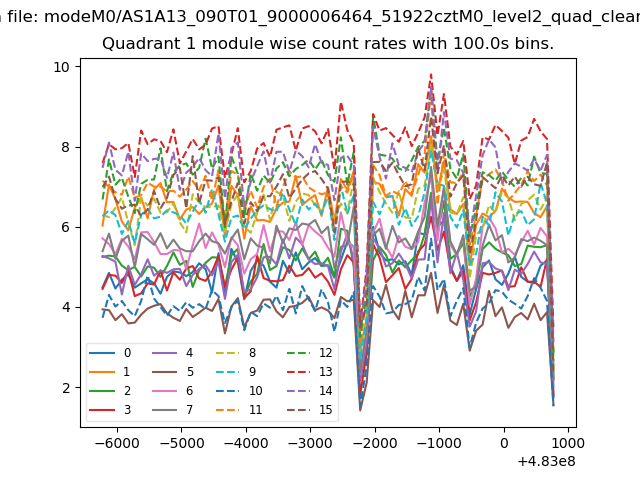
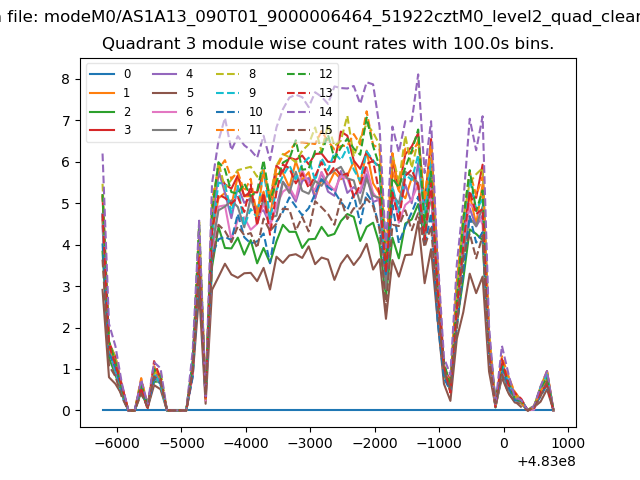
| Module-wise count rates for Quadrant A Data is divided into 100 sec bins |
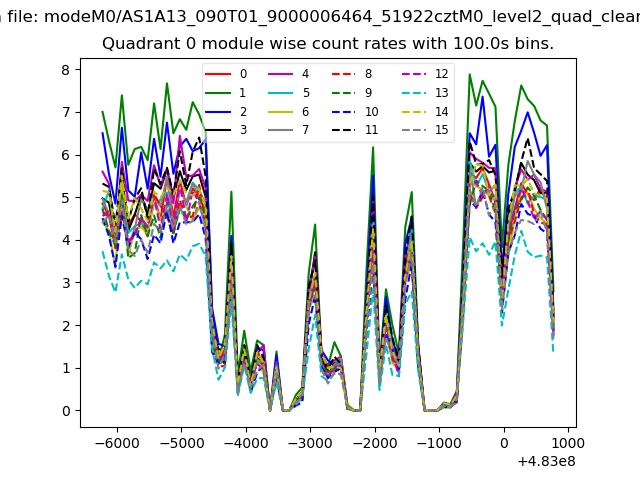 |
 |
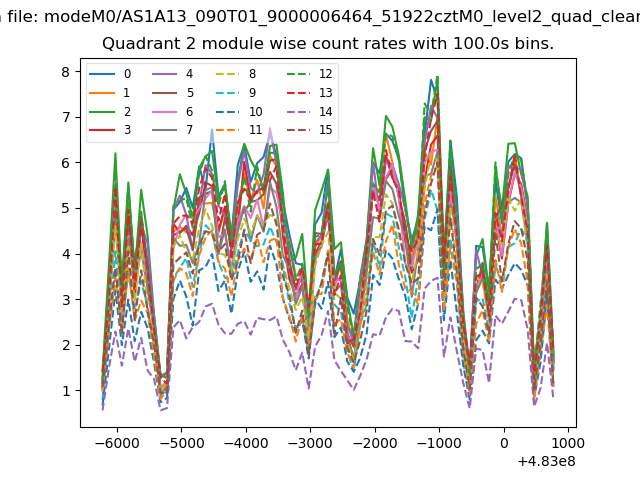
| Module-wise count rates for Quadrant B Data is divided into 100 sec bins |
 |
 |
| Module-wise count rates for Quadrant C Data is divided into 100 sec bins |
 |
 |
| Module-wise count rates for Quadrant D Data is divided into 100 sec bins |
 |
 |
| Parameter | Plot |
|---|---|
| CZT HV Monitor | 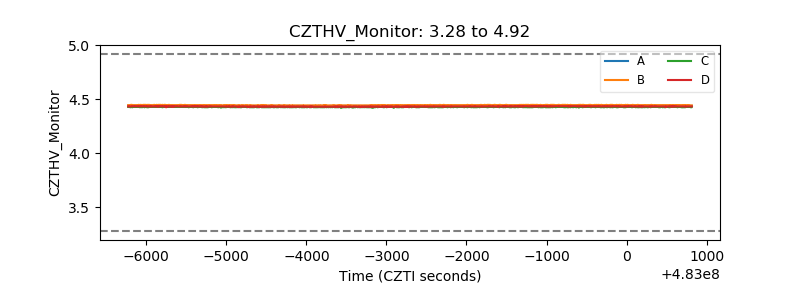 |
| D_VDD | 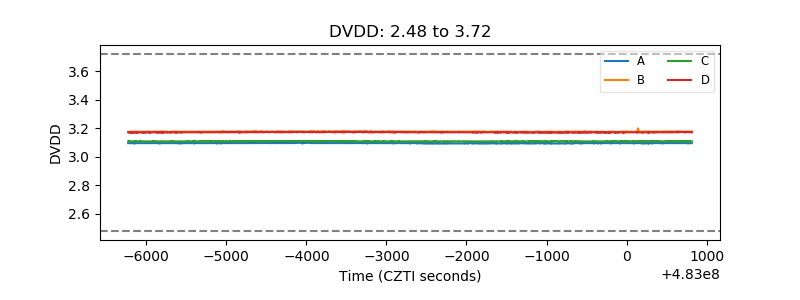 |
| Temperature 1 | 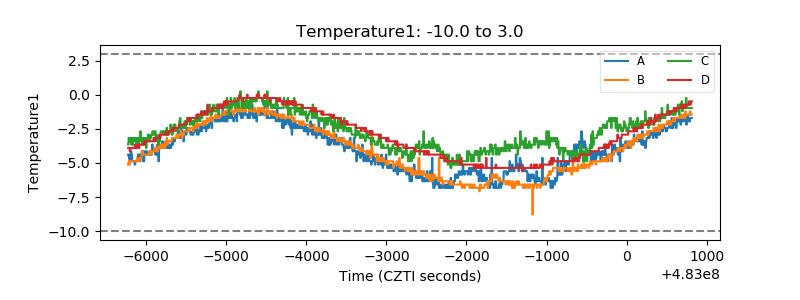 |
| Veto HV Monitor | 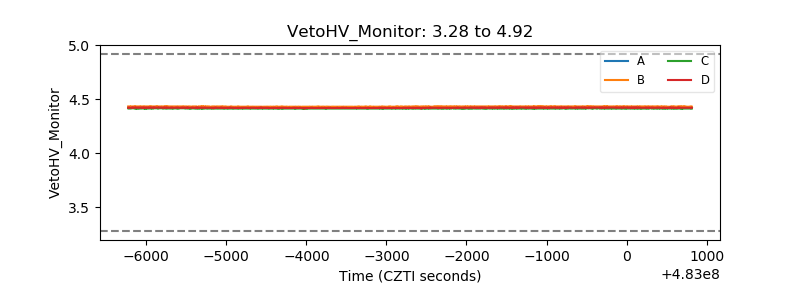 |
| Veto LLD | 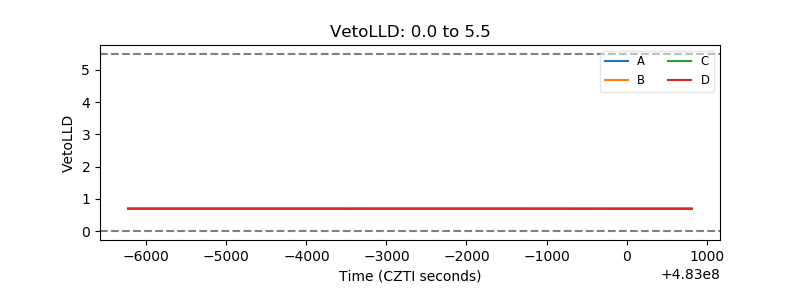 |
| Alpha Counter | 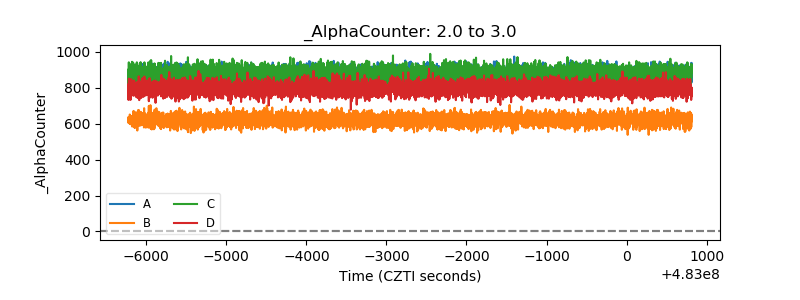 |
| _CPM_Rate | 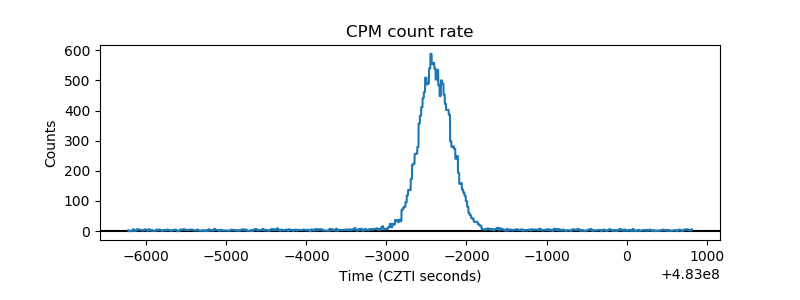 |
| CZT Counter | 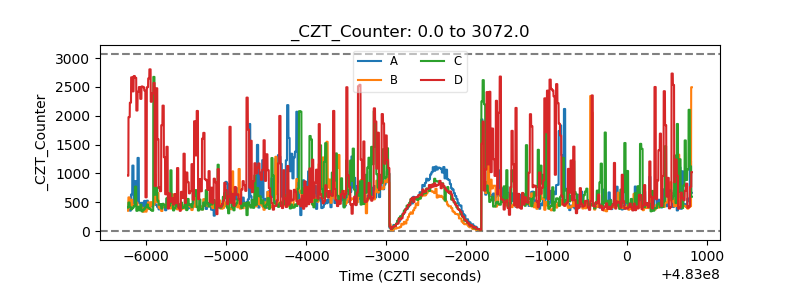 |
| +2.5 Volts monitor | 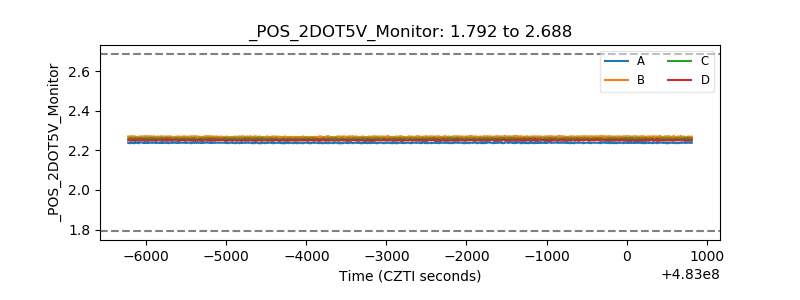 |
| +5 Volts monitor | 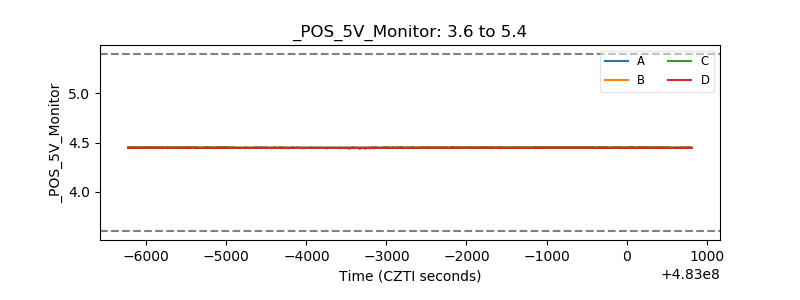 |
| _ROLL_ROT | 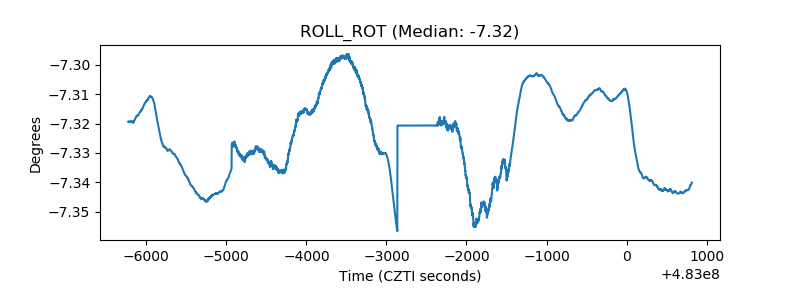 |
| _Roll_DEC | 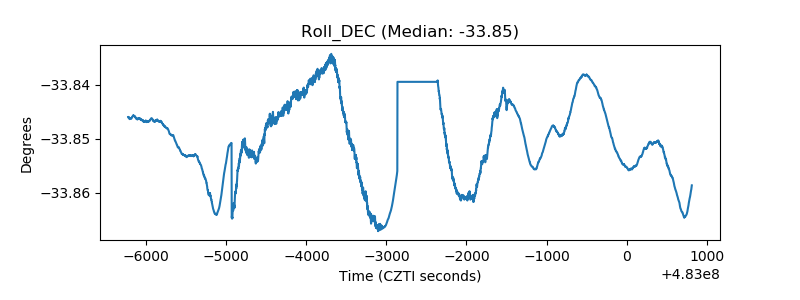 |
| _Roll_RA | 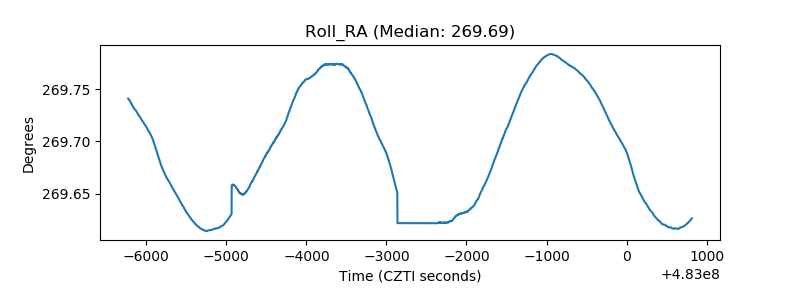 |
| Veto Counter | 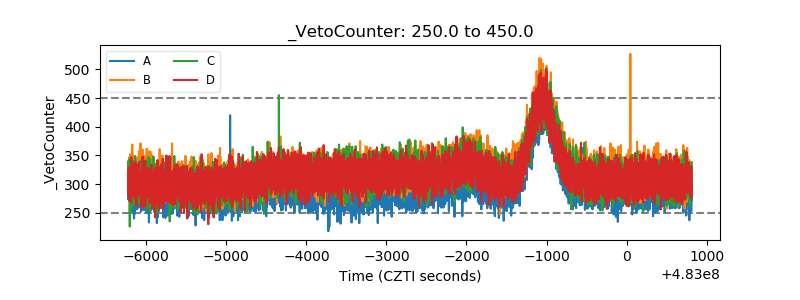 |