| Param | Original file | Final file |
|---|---|---|
| Filename | modeM0/AS1C09_011T05_9000006466cztM0_level2.fits | modeM0/AS1C09_011T05_9000006466cztM0_level2_quad_clean.evt |
| Size (bytes) | 4,793,820,480 | 2,155,498,560 |
| Size | 4.5 GB | 2.0 GB |
| Events in quadrant A | 32,413,014 | 8,944,207 |
| Events in quadrant B | 26,164,548 | 8,088,163 |
| Events in quadrant C | 30,740,638 | 8,554,550 |
| Events in quadrant D | 20,273,728 | 4,265,920 |
| Mode SS | |||
|---|---|---|---|
| Quadrant | BADHDUFLAG | Total packets | Discarded packets |
| A | 0 | 10593 | 0 |
| B | 0 | 10594 | 0 |
| C | 0 | 10594 | 0 |
| D | 0 | 10742 | 0 |
| Mode M0 | |||
|---|---|---|---|
| Quadrant | BADHDUFLAG | Total packets | Discarded packets |
| A | 0 | 1854521 | 0 |
| B | 0 | 1754357 | 0 |
| C | 0 | 1721739 | 0 |
| D | 0 | 2951470 | 0 |
| Mode M9 | |||
|---|---|---|---|
| Quadrant | BADHDUFLAG | Total packets | Discarded packets |
| A | 0 | 600 | 0 |
| B | 0 | 602 | 0 |
| C | 0 | 600 | 0 |
| D | 0 | 602 | 0 |
| Quadrant | Total seconds | Saturated seconds | Saturation percentage |
|---|---|---|---|
| A | 523131 | 59071 | 11.291818% |
| B | 523524 | 67946 | 12.978584% |
| C | 523814 | 64914 | 12.392567% |
| D | 522738 | 245093 | 46.886394% |
Noise dominated data is calculated using 1-second bins in cleaned event files. If a bin has >2000 counts, and if more than 50% of those come from <1% of pixels, then it is considered to be noise-dominated and hence unusable.
| Quadrant | # 1 sec bins | Bins with >0 counts | Bins with >2000 counts | High rate bins dominated by noise | Noise dominated (total time) | Noise dominated (detector-on time) | Marked lightcurve |
|---|---|---|---|---|---|---|---|
| A | 607160 | 523197 | 0 | 0 | 0.00% | 0.00% | 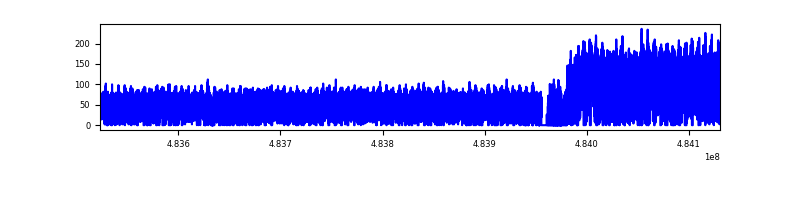 |
| B | 607160 | 494805 | 0 | 0 | 0.00% | 0.00% | 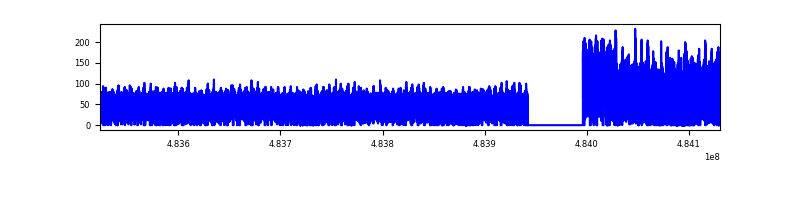 |
| C | 607161 | 524356 | 0 | 0 | 0.00% | 0.00% |  |
| D | 607160 | 504966 | 0 | 0 | 0.00% | 0.00% | 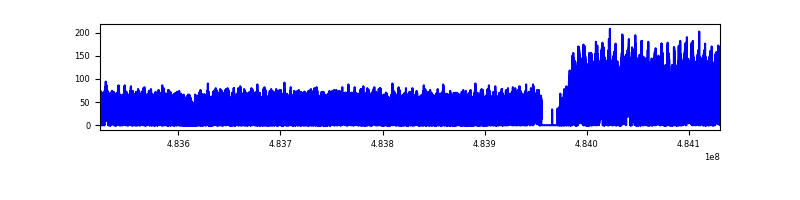 |
Top three noisy pixels from each quadrant. If the there are fewer than three noisy pixels in the level2.evt file, extra rows are filled as -1
| Pixel properties | Quadrant properties | ||||||
|---|---|---|---|---|---|---|---|
| Quadrant | DetID | PixID | Counts | Sigma | Mean | Median | Sigma |
| A | 14 | 188 | 29051 | 9.07 | 8680 | 8224 | 2295.9 |
| A | 9 | 255 | 26866 | 8.12 | 8680 | 8224 | 2295.9 |
| A | 14 | 204 | 24031 | 6.88 | 8680 | 8224 | 2295.9 |
| B | 2 | 9 | 25756 | 12.76 | 7036 | 6743 | 1489.8 |
| B | 2 | 8 | 23030 | 10.93 | 7036 | 6743 | 1489.8 |
| B | 9 | 173 | 18147 | 7.65 | 7036 | 6743 | 1489.8 |
| C | 2 | 31 | 21346 | 5.51 | 8392 | 7903 | 2440.3 |
| C | 3 | 203 | 20461 | 5.15 | 8392 | 7903 | 2440.3 |
| C | 15 | 127 | 20365 | 5.11 | 8392 | 7903 | 2440.3 |
| D | 6 | 218 | 20878 | 8.99 | 5931 | 5374 | 1724.9 |
| D | 15 | 11 | 16722 | 6.58 | 5931 | 5374 | 1724.9 |
| D | 3 | 30 | 15893 | 6.1 | 5931 | 5374 | 1724.9 |
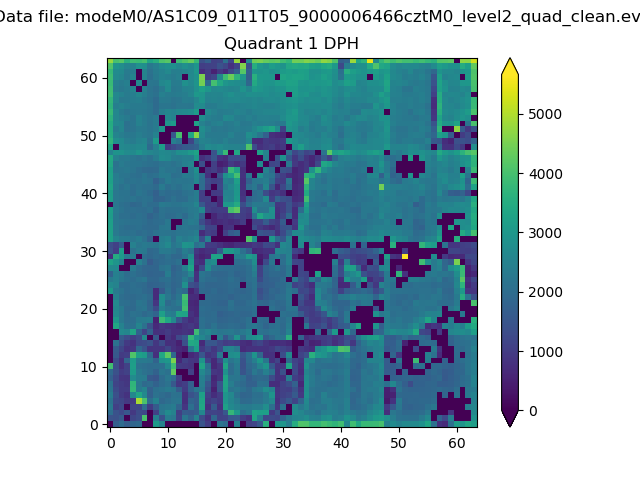
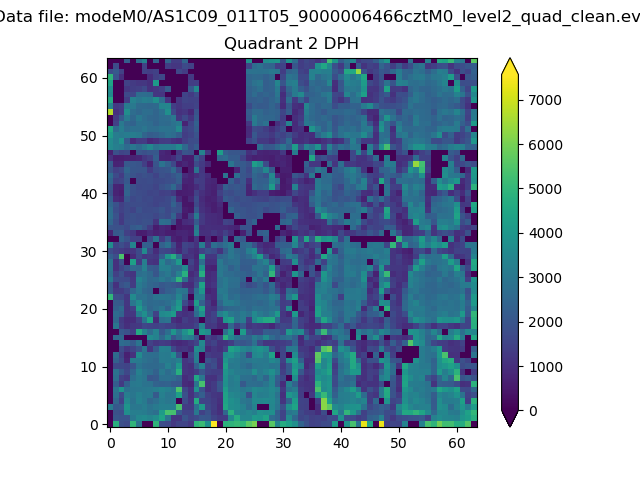
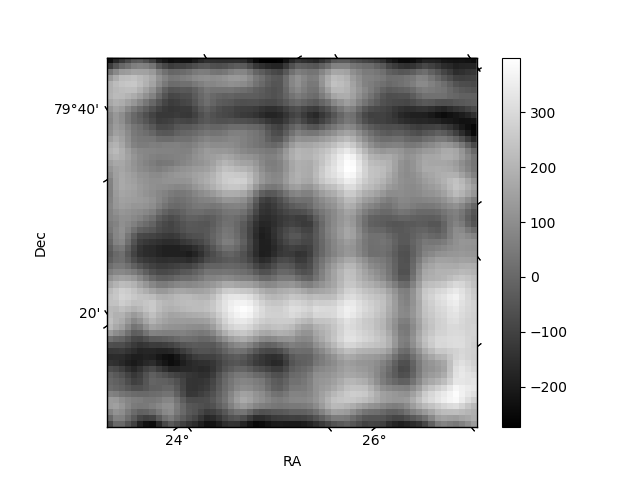
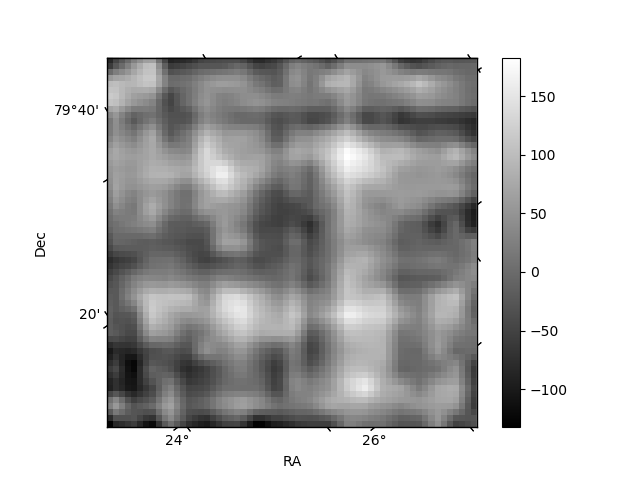
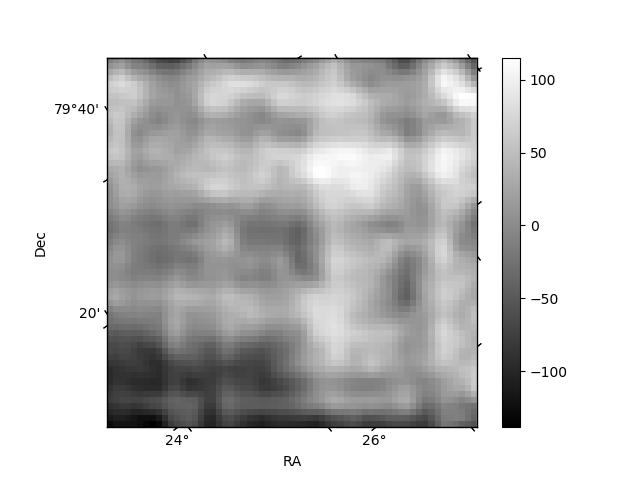
Histogram calculated using DETX and DETY for each event in the final _common_clean file
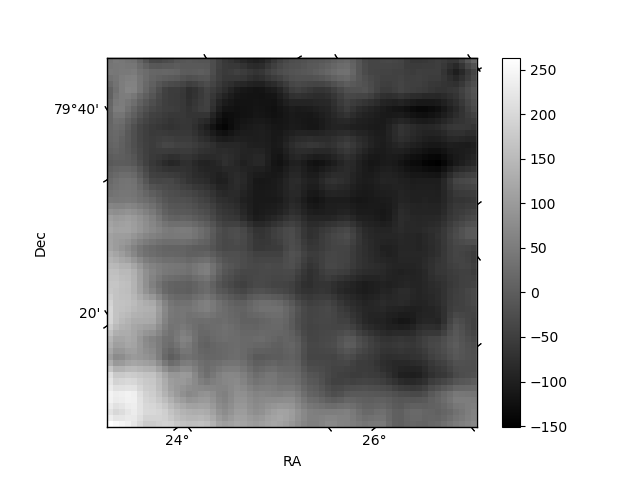
| Quadrant A | 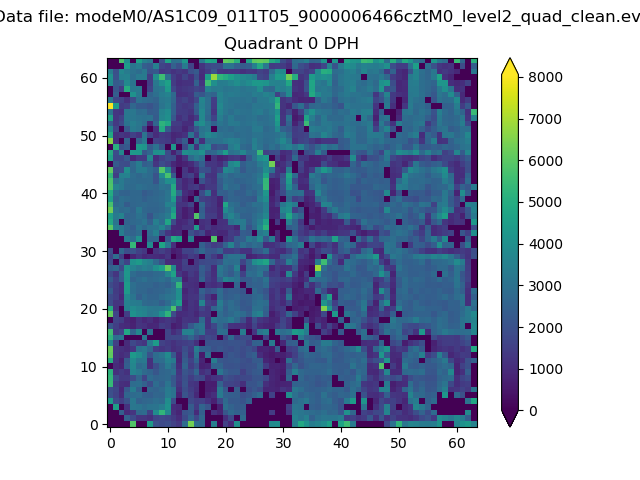 |
 |
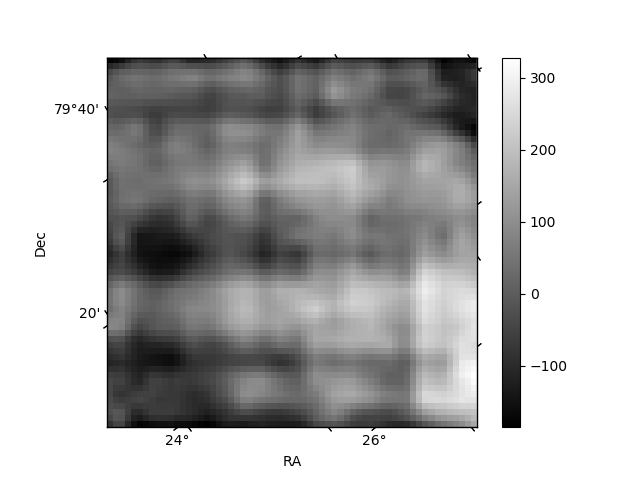
Quadrant B |
|---|---|---|---|
| Quadrant D | 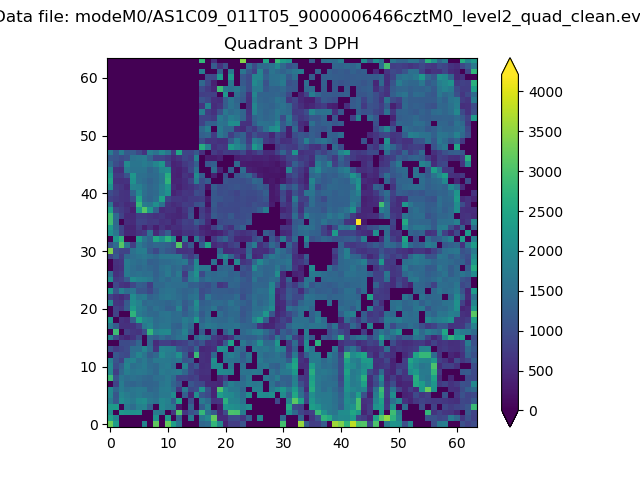 |
 |
Quadrant C |
| Plot type | Count rate plots | Images |
|---|---|---|
| Comparison with Poisson distribution Blue bars denote a histogram of data divided into 1 sec bins. Red curve is a Poisson curve with rate = median count rate of data. |
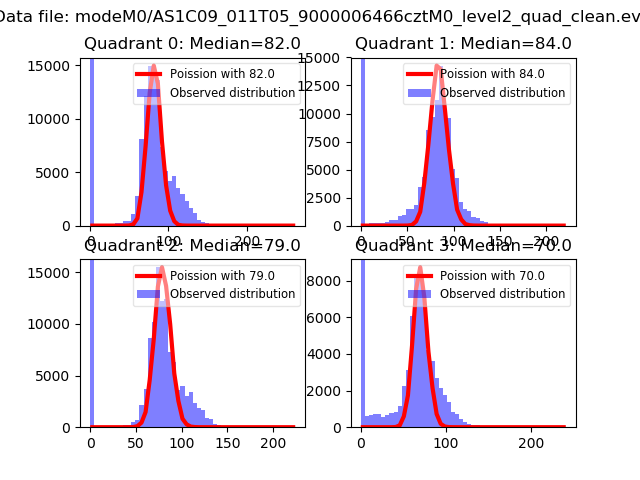 |
 |
| Quadrant-wise count rates Data is divided into 100 sec bins |
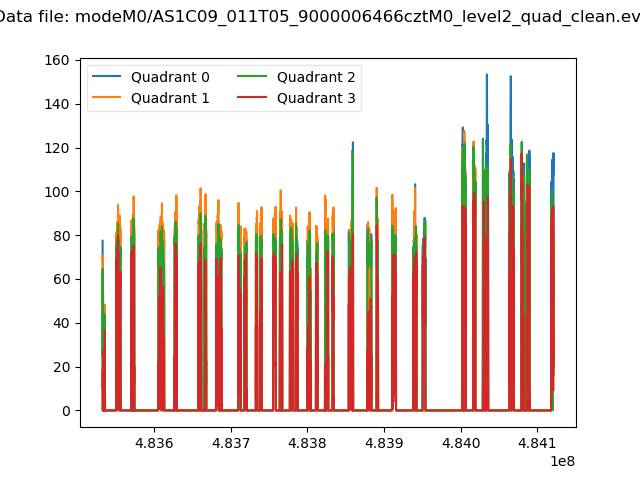 |
|
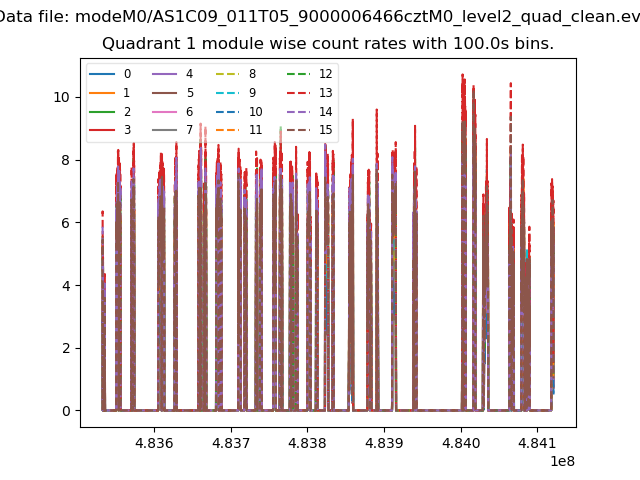
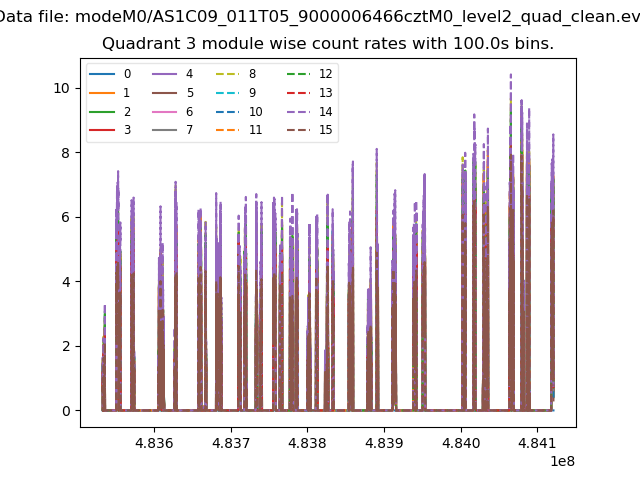
| Module-wise count rates for Quadrant A Data is divided into 100 sec bins |
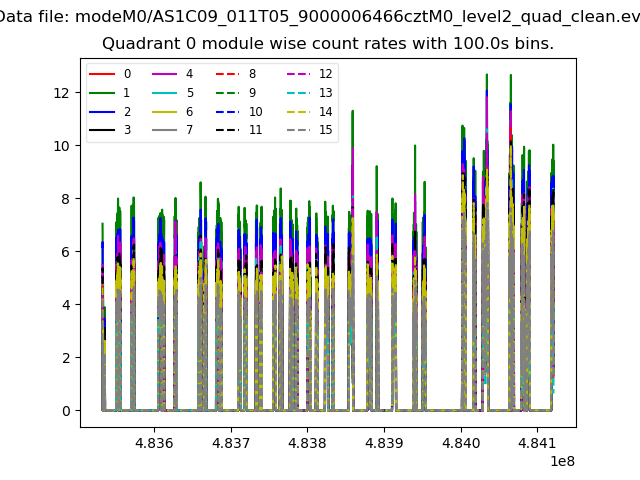 |
 |
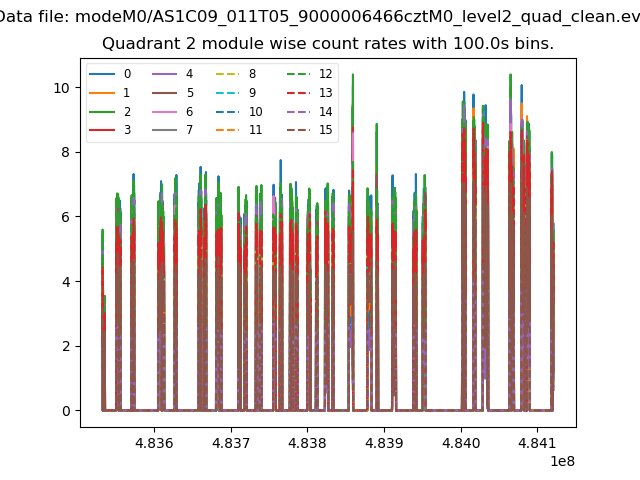
| Module-wise count rates for Quadrant B Data is divided into 100 sec bins |
 |
 |
| Module-wise count rates for Quadrant C Data is divided into 100 sec bins |
 |
 |
| Module-wise count rates for Quadrant D Data is divided into 100 sec bins |
 |
 |
| Parameter | Plot |
|---|---|
| CZT HV Monitor | 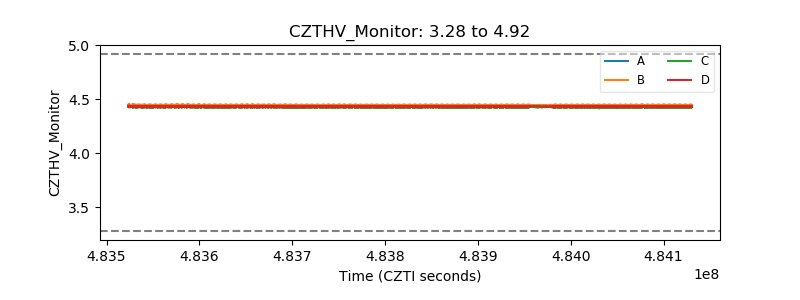 |
| D_VDD |  |
| Temperature 1 | 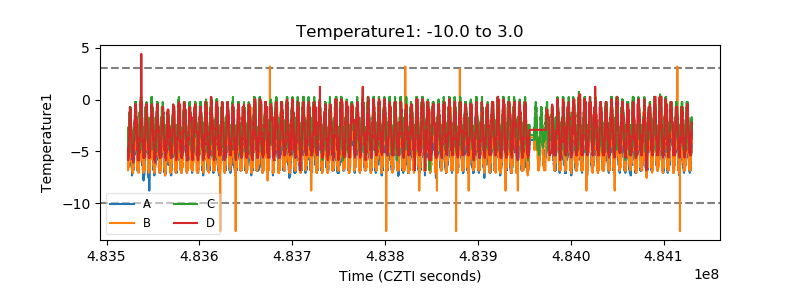 |
| Veto HV Monitor | 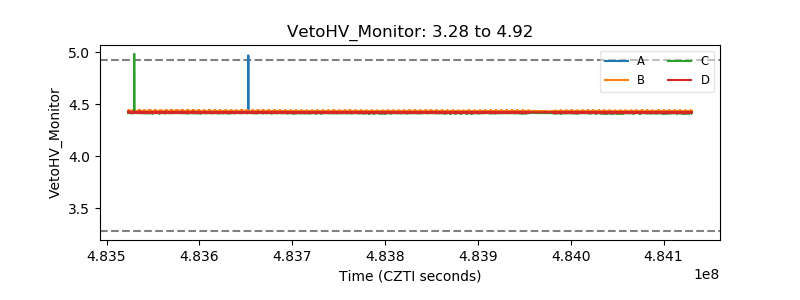 |
| Veto LLD | 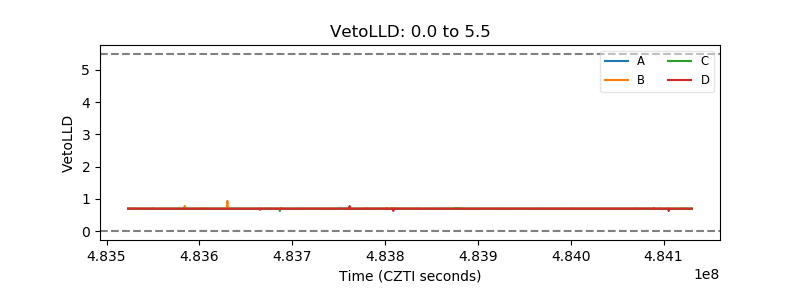 |
| Alpha Counter | 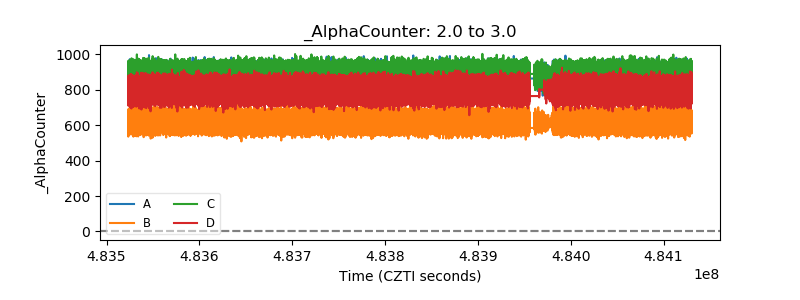 |
| _CPM_Rate | 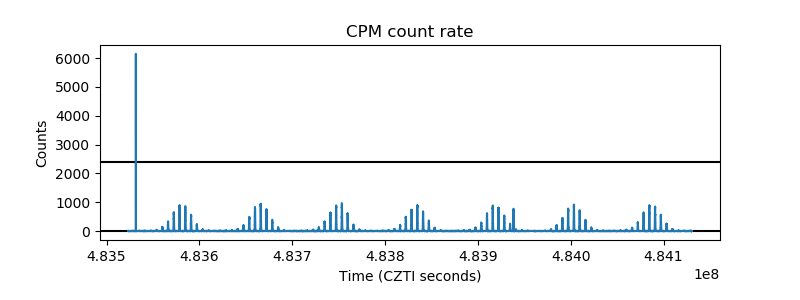 |
| CZT Counter | 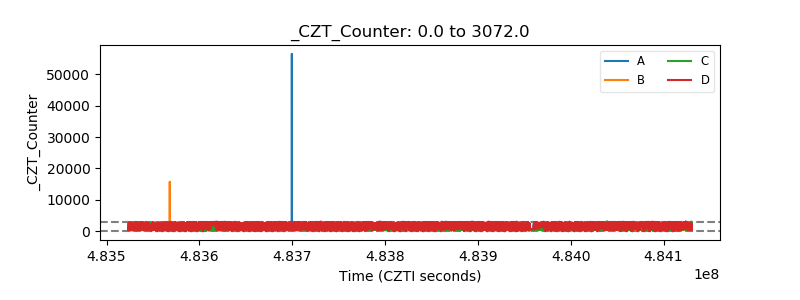 |
| +2.5 Volts monitor | 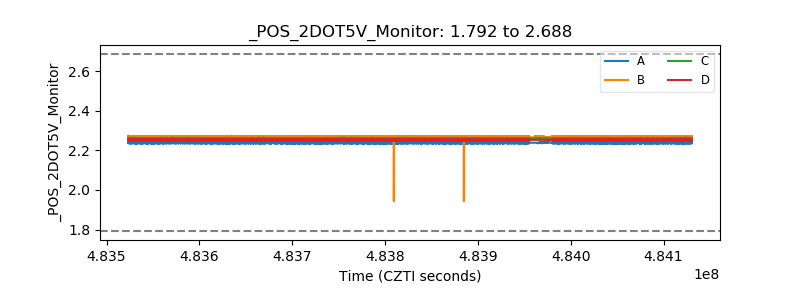 |
| +5 Volts monitor | 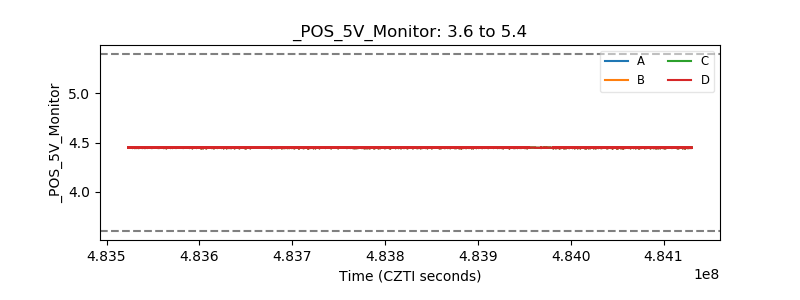 |
| _ROLL_ROT | 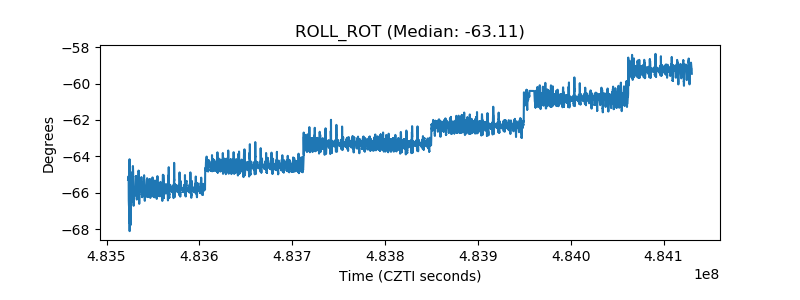 |
| _Roll_DEC | 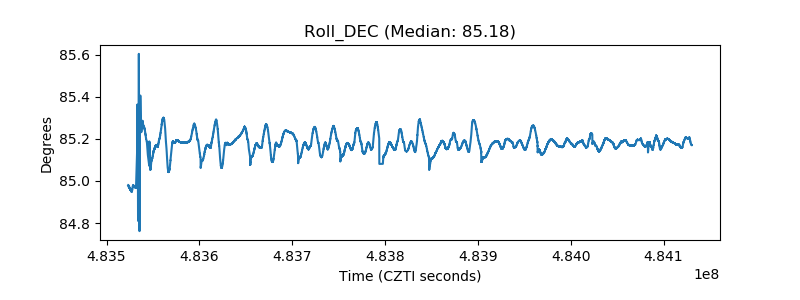 |
| _Roll_RA | 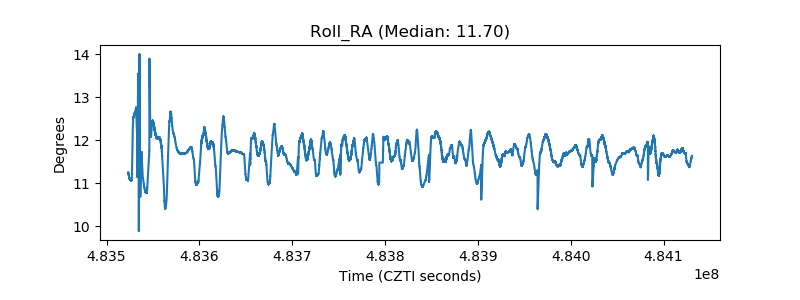 |
| Veto Counter | 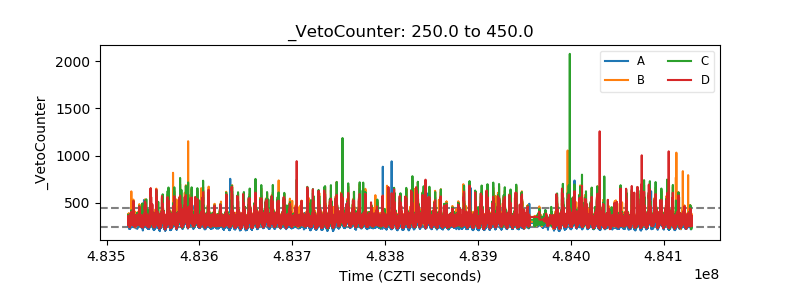 |